| Param | Original file | Final file |
|---|---|---|
| Filename | modeM0/AS1C07_001T09_9000005236_36701cztM0_level2.evt | modeM0/AS1C07_001T09_9000005236_36701cztM0_level2_quad_clean.evt |
| Size (bytes) | 523,656,000 | 107,216,640 |
| Size | 499.4 MB | 102.2 MB |
| Events in quadrant A | 2,906,576 | 742,261 |
| Events in quadrant B | 3,106,933 | 720,822 |
| Events in quadrant C | 3,705,950 | 714,036 |
| Events in quadrant D | 5,739,175 | 657,296 |
| Mode SS | |||
|---|---|---|---|
| Quadrant | BADHDUFLAG | Total packets | Discarded packets |
| A | 0 | 120 | 0 |
| B | 0 | 120 | 0 |
| C | 0 | 120 | 0 |
| D | 0 | 120 | 0 |
| Mode M9 | |||
|---|---|---|---|
| Quadrant | BADHDUFLAG | Total packets | Discarded packets |
| A | 0 | 13 | 0 |
| B | 0 | 13 | 0 |
| C | 0 | 13 | 0 |
| D | 0 | 13 | 0 |
| Mode M0 | |||
|---|---|---|---|
| Quadrant | BADHDUFLAG | Total packets | Discarded packets |
| A | 0 | 12511 | 3 |
| B | 0 | 12987 | 2 |
| C | 0 | 14703 | 2 |
| D | 0 | 21145 | 2 |
| Quadrant | Total seconds | Saturated seconds | Saturation percentage |
|---|---|---|---|
| A | 5902 | 21 | 0.355812% |
| B | 5902 | 84 | 1.423246% |
| C | 5902 | 207 | 3.507286% |
| D | 5903 | 797 | 13.501609% |
Noise dominated data is calculated using 1-second bins in cleaned event files. If a bin has >2000 counts, and if more than 50% of those come from <1% of pixels, then it is considered to be noise-dominated and hence unusable.
| Quadrant | # 1 sec bins | Bins with >0 counts | Bins with >2000 counts | High rate bins dominated by noise | Noise dominated (total time) | Noise dominated (detector-on time) | Marked lightcurve |
|---|---|---|---|---|---|---|---|
| A | 7186 | 5903 | 4 | 4 | 0.06% | 0.07% | 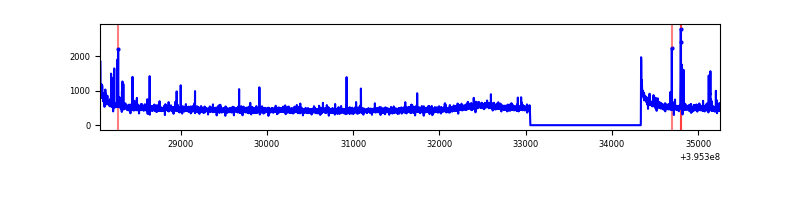 |
| B | 7186 | 5903 | 59 | 59 | 0.82% | 1.00% | 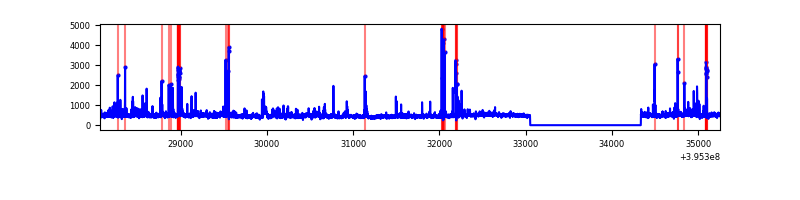 |
| C | 7186 | 5903 | 149 | 149 | 2.07% | 2.52% | 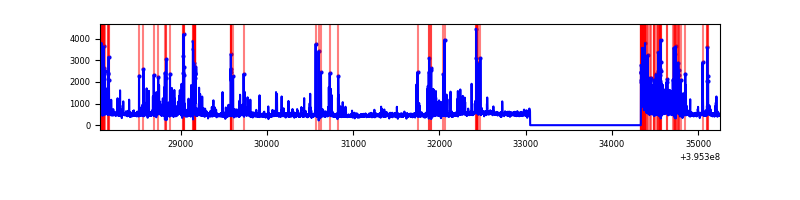 |
| D | 7187 | 5904 | 707 | 707 | 9.84% | 11.97% | 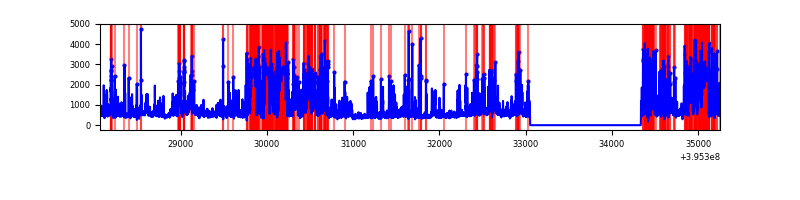 |
Top three noisy pixels from each quadrant. If the there are fewer than three noisy pixels in the level2.evt file, extra rows are filled as -1
| Pixel properties | Quadrant properties | ||||||
|---|---|---|---|---|---|---|---|
| Quadrant | DetID | PixID | Counts | Sigma | Mean | Median | Sigma |
| A | 10 | 83 | 246141 | 1835.96 | 659 | 646 | 133.7 |
| A | 9 | 143 | 49297 | 363.84 | 659 | 646 | 133.7 |
| A | 13 | 6 | 24705 | 179.93 | 659 | 646 | 133.7 |
| B | 5 | 200 | 125625 | 1026.19 | 647 | 631 | 121.8 |
| B | 5 | 255 | 85381 | 695.79 | 647 | 631 | 121.8 |
| B | 0 | 189 | 62404 | 507.15 | 647 | 631 | 121.8 |
| C | 14 | 254 | 560687 | 3778.51 | 633 | 636 | 148.2 |
| C | 0 | 10 | 323205 | 2176.29 | 633 | 636 | 148.2 |
| C | 15 | 214 | 265482 | 1786.85 | 633 | 636 | 148.2 |
| D | 12 | 233 | 1890337 | 12595.45 | 607 | 591 | 150.0 |
| D | 14 | 52 | 484222 | 3223.48 | 607 | 591 | 150.0 |
| D | 13 | 171 | 362325 | 2411.01 | 607 | 591 | 150.0 |
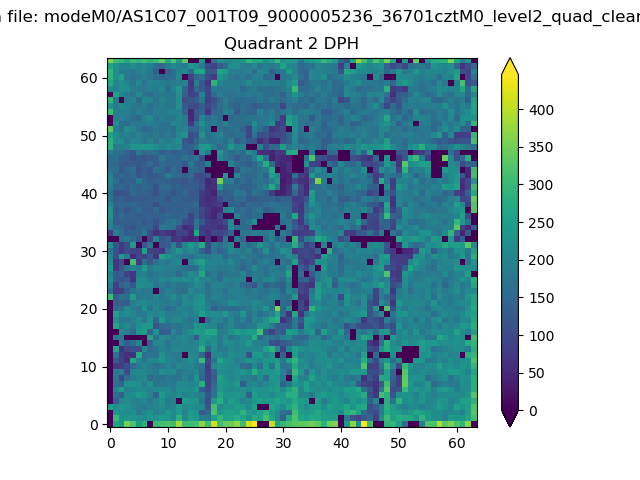
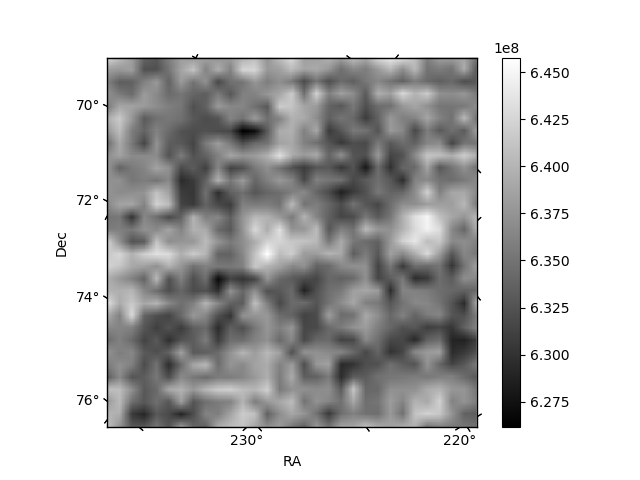
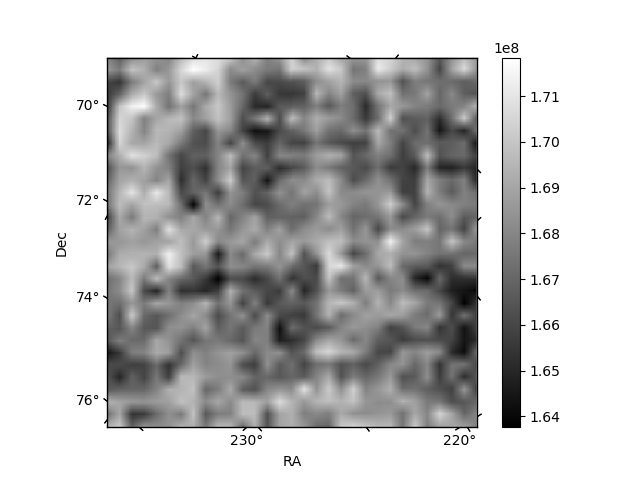
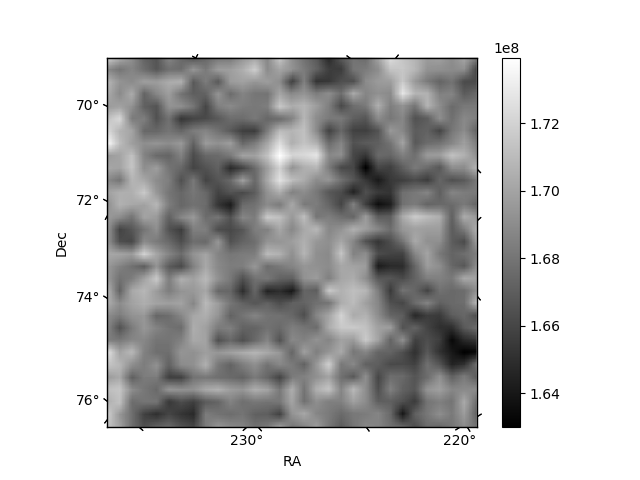
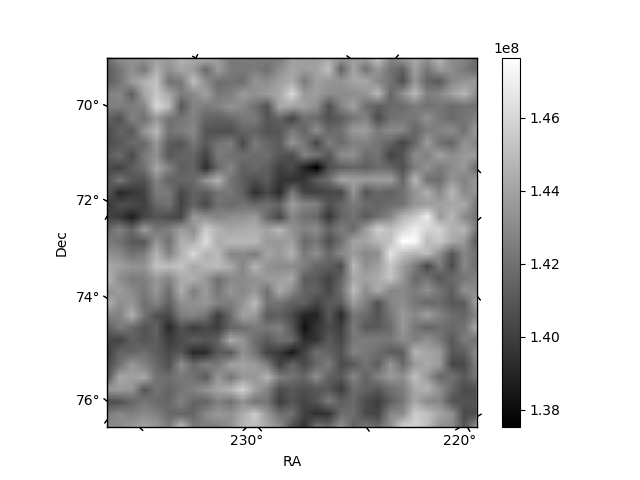
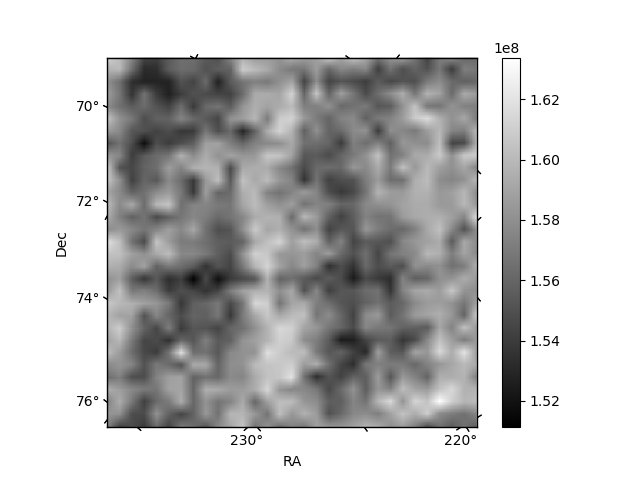
Histogram calculated using DETX and DETY for each event in the final _common_clean file
| Quadrant A | 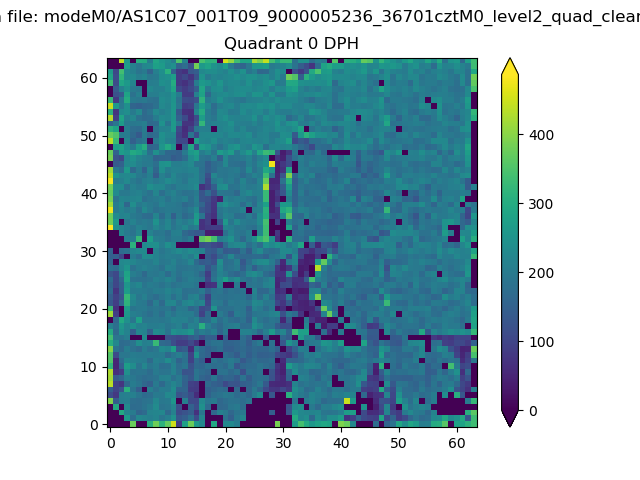 |
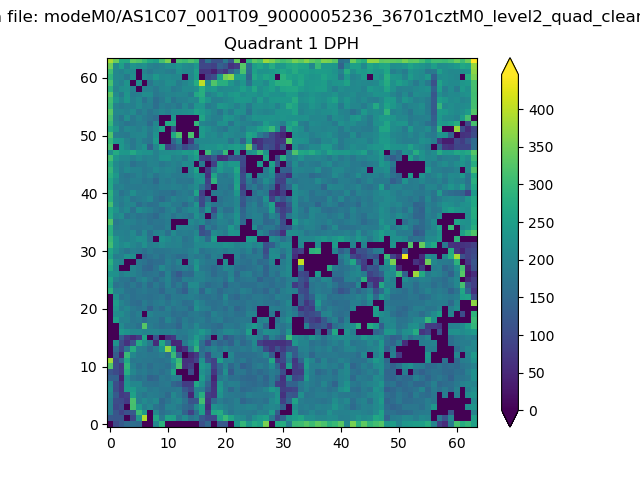 |
Quadrant B |
|---|---|---|---|
| Quadrant D | 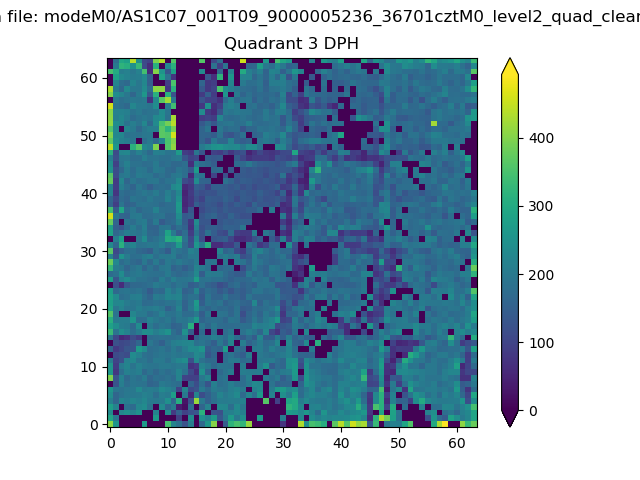 |
 |
Quadrant C |
| Plot type | Count rate plots | Images |
|---|---|---|
| Comparison with Poisson distribution Blue bars denote a histogram of data divided into 1 sec bins. Red curve is a Poisson curve with rate = median count rate of data. |
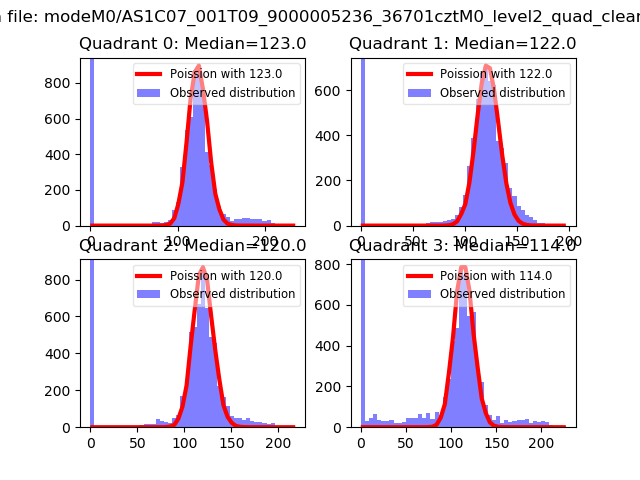 |
 |
| Quadrant-wise count rates Data is divided into 100 sec bins |
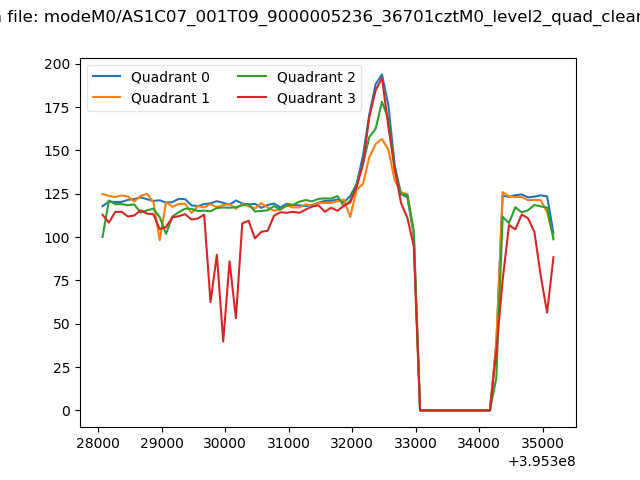 |
|
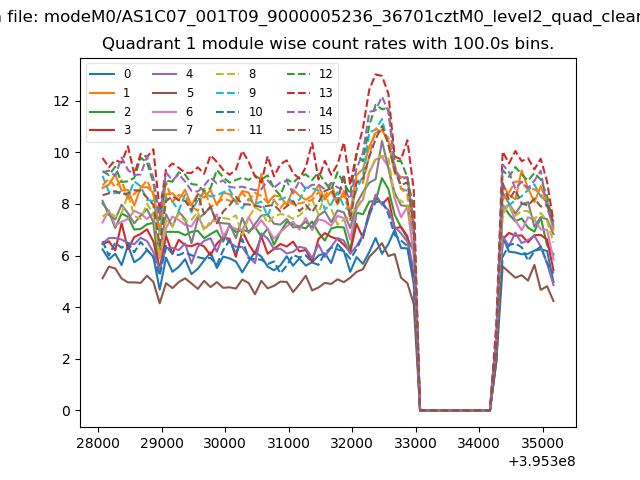
| Module-wise count rates for Quadrant A Data is divided into 100 sec bins |
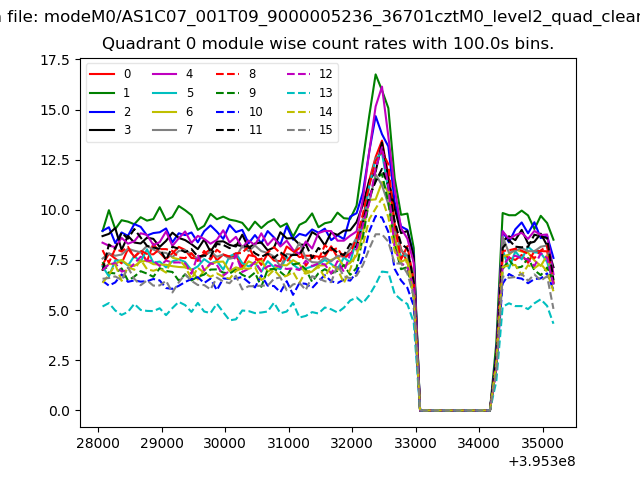 |
 |
| Module-wise count rates for Quadrant B Data is divided into 100 sec bins |
 |
 |
| Module-wise count rates for Quadrant C Data is divided into 100 sec bins |
 |
 |
| Module-wise count rates for Quadrant D Data is divided into 100 sec bins |
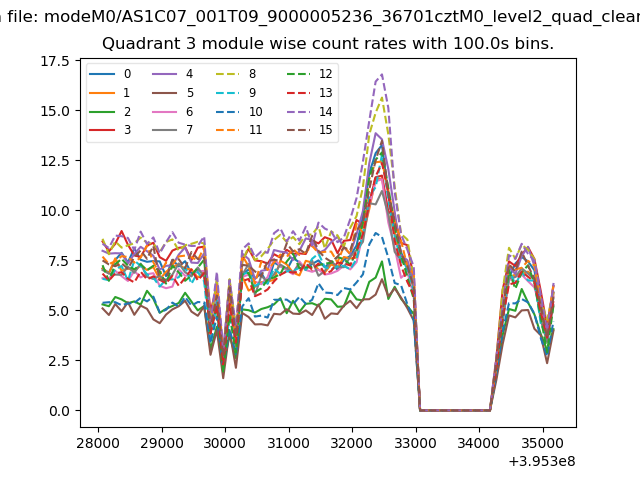 |
 |
| Parameter | Plot |
|---|---|
| CZT HV Monitor | 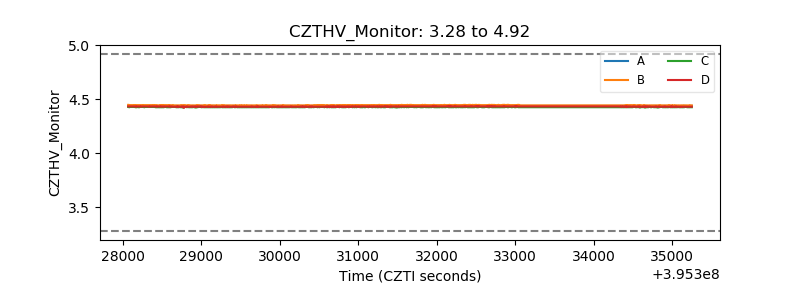 |
| D_VDD | 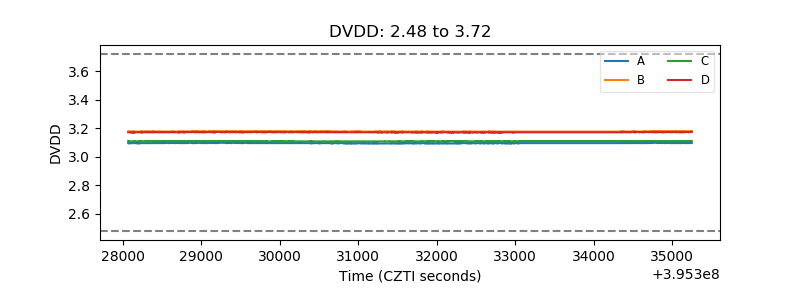 |
| Temperature 1 | 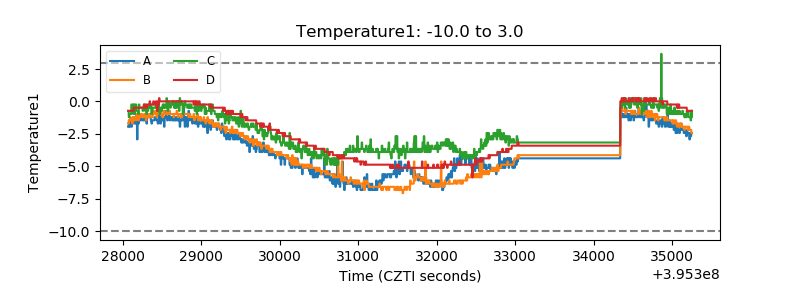 |
| Veto HV Monitor | 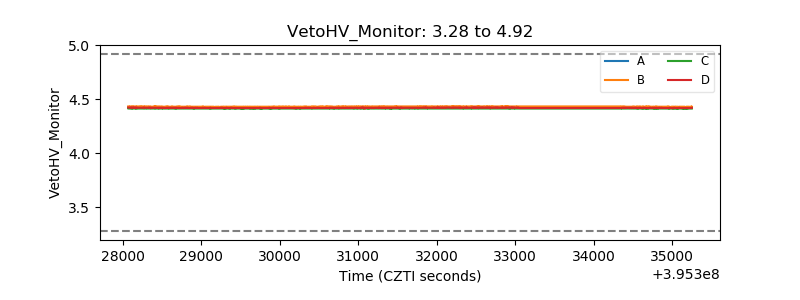 |
| Veto LLD | 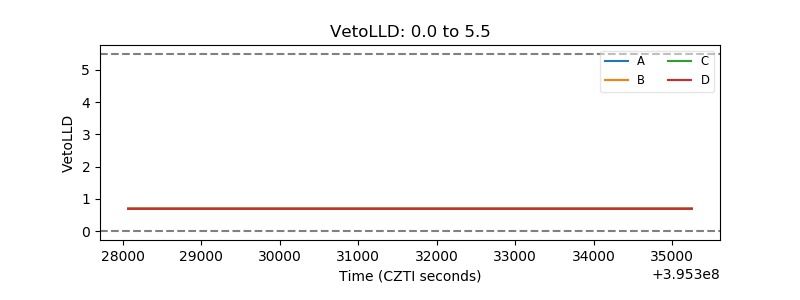 |
| Alpha Counter | 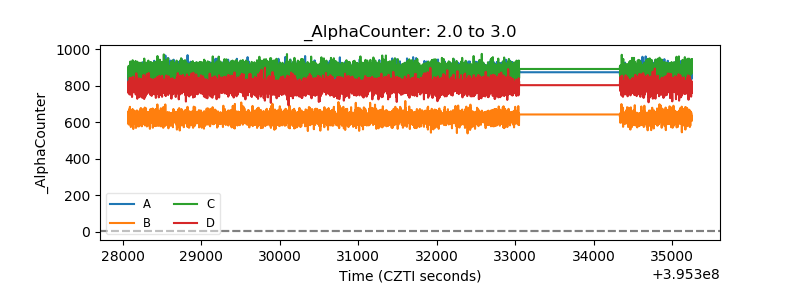 |
| _CPM_Rate | 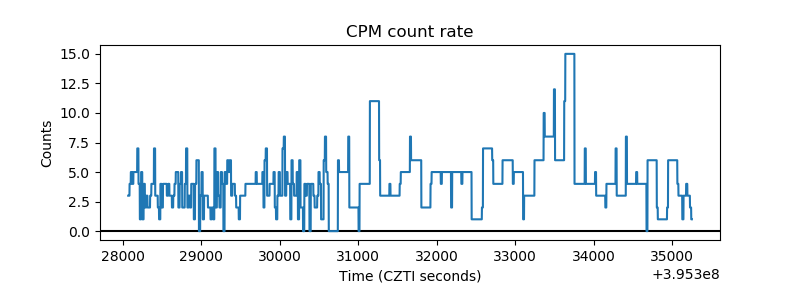 |
| CZT Counter | 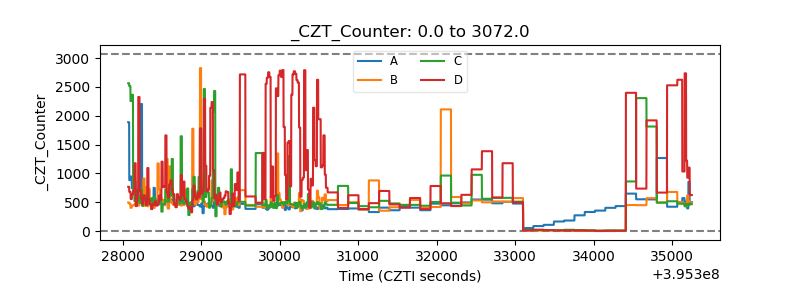 |
| +2.5 Volts monitor |  |
| +5 Volts monitor | 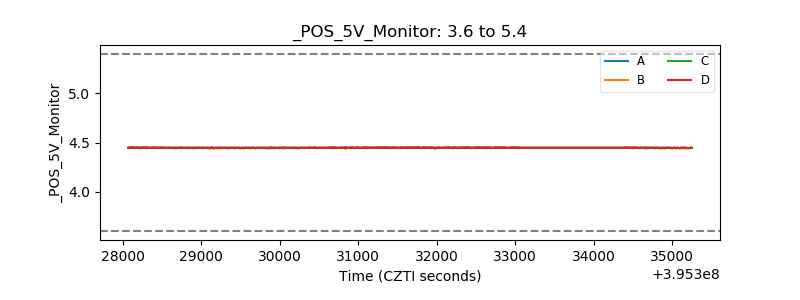 |
| _ROLL_ROT | 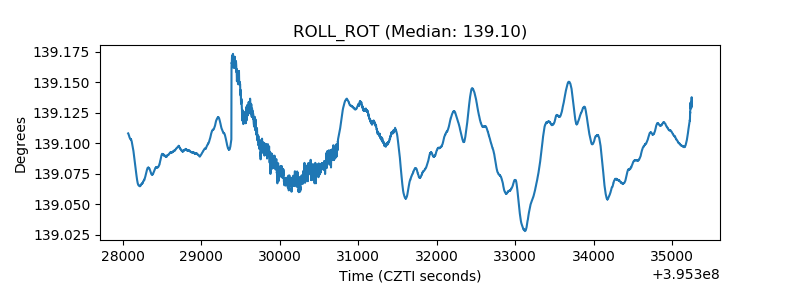 |
| _Roll_DEC | 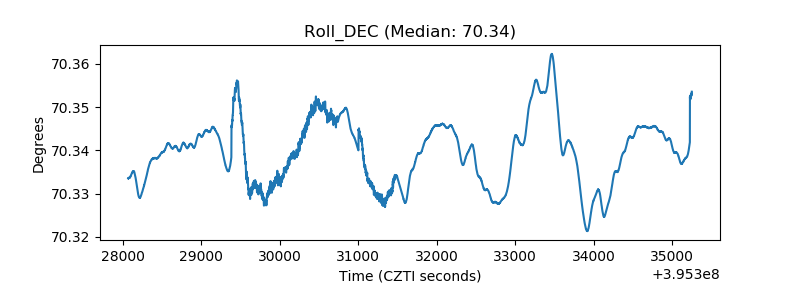 |
| _Roll_RA | 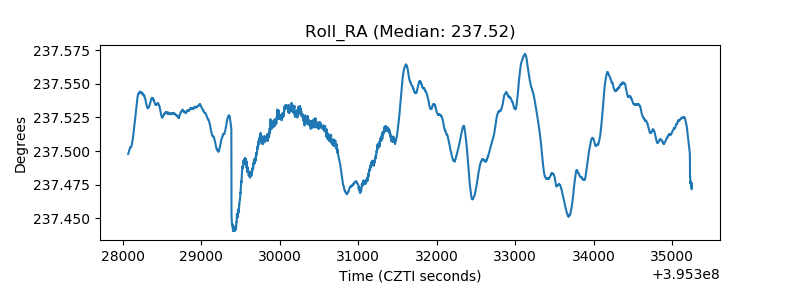 |
| Veto Counter | 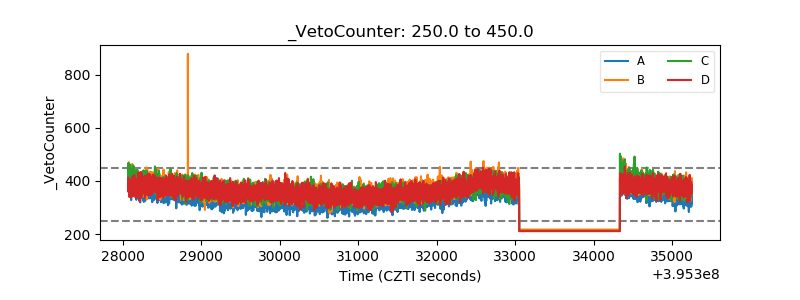 |