| Param | Original file | Final file |
|---|---|---|
| Filename | modeM0/AS1C07_001T09_9000005236_36703cztM0_level2.evt | modeM0/AS1C07_001T09_9000005236_36703cztM0_level2_quad_clean.evt |
| Size (bytes) | 893,027,520 | 190,454,400 |
| Size | 851.7 MB | 181.6 MB |
| Events in quadrant A | 5,290,751 | 1,291,274 |
| Events in quadrant B | 6,262,930 | 1,273,621 |
| Events in quadrant C | 6,520,644 | 1,266,733 |
| Events in quadrant D | 8,244,708 | 1,192,655 |
| Mode SS | |||
|---|---|---|---|
| Quadrant | BADHDUFLAG | Total packets | Discarded packets |
| A | 0 | 220 | 0 |
| B | 0 | 220 | 0 |
| C | 0 | 220 | 0 |
| D | 0 | 220 | 0 |
| Mode M9 | |||
|---|---|---|---|
| Quadrant | BADHDUFLAG | Total packets | Discarded packets |
| A | 0 | 33 | 0 |
| B | 0 | 33 | 0 |
| C | 0 | 33 | 0 |
| D | 0 | 34 | 0 |
| Mode M0 | |||
|---|---|---|---|
| Quadrant | BADHDUFLAG | Total packets | Discarded packets |
| A | 0 | 22931 | 4 |
| B | 0 | 25816 | 3 |
| C | 0 | 26210 | 3 |
| D | 0 | 31818 | 3 |
| Quadrant | Total seconds | Saturated seconds | Saturation percentage |
|---|---|---|---|
| A | 10742 | 68 | 0.633029% |
| B | 10742 | 258 | 2.401787% |
| C | 10742 | 343 | 3.193074% |
| D | 10742 | 811 | 7.549805% |
Noise dominated data is calculated using 1-second bins in cleaned event files. If a bin has >2000 counts, and if more than 50% of those come from <1% of pixels, then it is considered to be noise-dominated and hence unusable.
| Quadrant | # 1 sec bins | Bins with >0 counts | Bins with >2000 counts | High rate bins dominated by noise | Noise dominated (total time) | Noise dominated (detector-on time) | Marked lightcurve |
|---|---|---|---|---|---|---|---|
| A | 13517 | 10744 | 35 | 35 | 0.26% | 0.33% | 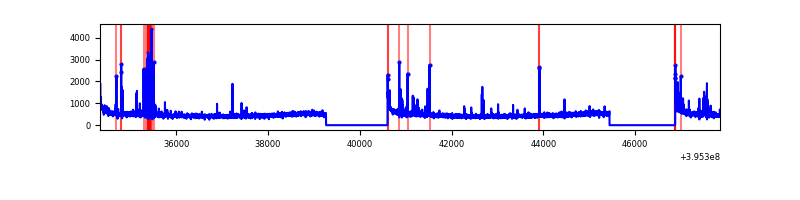 |
| B | 13517 | 10744 | 165 | 165 | 1.22% | 1.54% | 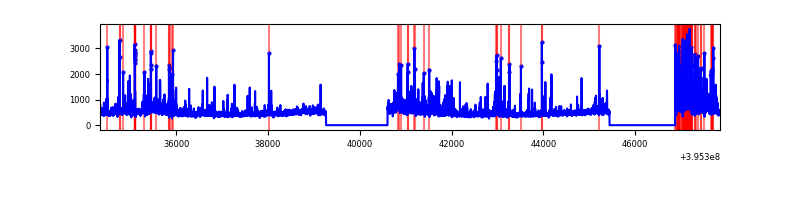 |
| C | 13517 | 10744 | 265 | 265 | 1.96% | 2.47% | 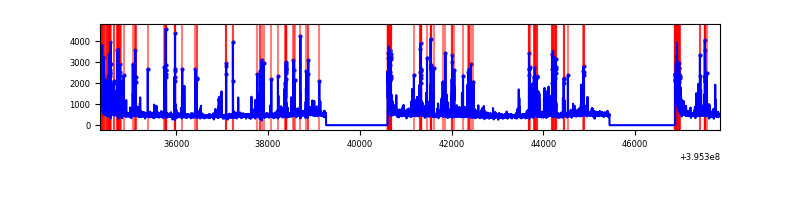 |
| D | 13517 | 10744 | 674 | 674 | 4.99% | 6.27% | 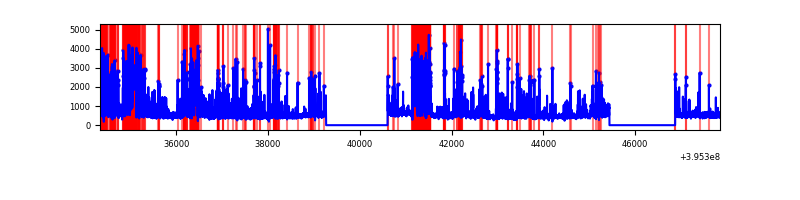 |
Top three noisy pixels from each quadrant. If the there are fewer than three noisy pixels in the level2.evt file, extra rows are filled as -1
| Pixel properties | Quadrant properties | ||||||
|---|---|---|---|---|---|---|---|
| Quadrant | DetID | PixID | Counts | Sigma | Mean | Median | Sigma |
| A | 10 | 83 | 411020 | 1740.25 | 1179 | 1156 | 235.5 |
| A | 13 | 248 | 144819 | 609.98 | 1179 | 1156 | 235.5 |
| A | 9 | 143 | 93708 | 392.97 | 1179 | 1156 | 235.5 |
| B | 5 | 255 | 715890 | 3242.36 | 1163 | 1129 | 220.4 |
| B | 0 | 221 | 272222 | 1229.76 | 1163 | 1129 | 220.4 |
| B | 0 | 229 | 153251 | 690.07 | 1163 | 1129 | 220.4 |
| C | 14 | 254 | 890392 | 3395.67 | 1138 | 1145 | 261.9 |
| C | 0 | 10 | 640105 | 2439.92 | 1138 | 1145 | 261.9 |
| C | 15 | 214 | 475343 | 1810.77 | 1138 | 1145 | 261.9 |
| D | 12 | 233 | 1677919 | 6154.46 | 1122 | 1092 | 272.5 |
| D | 13 | 171 | 486113 | 1780.17 | 1122 | 1092 | 272.5 |
| D | 2 | 249 | 302370 | 1105.78 | 1122 | 1092 | 272.5 |
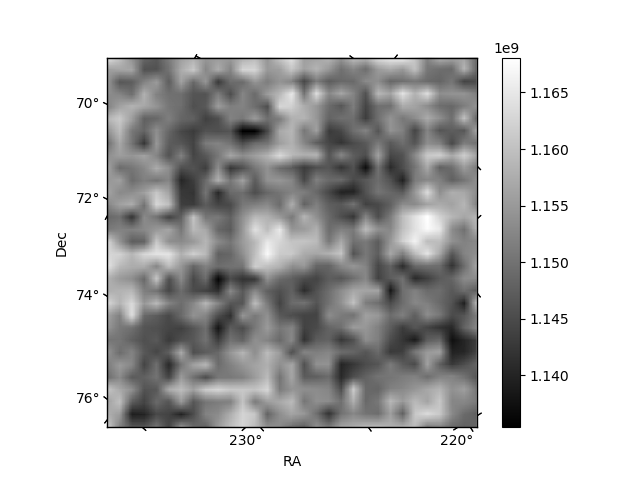
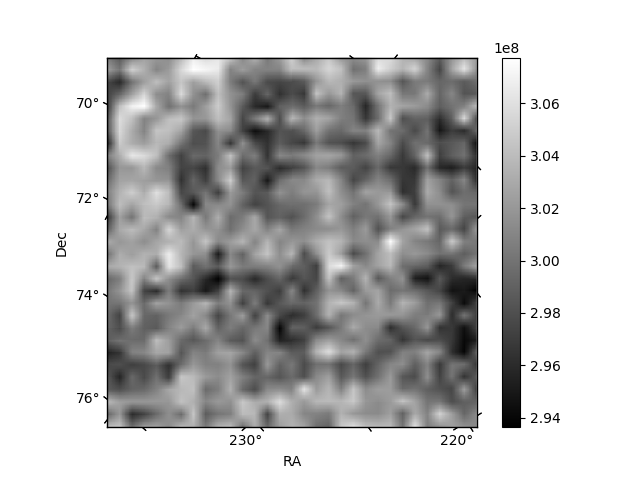
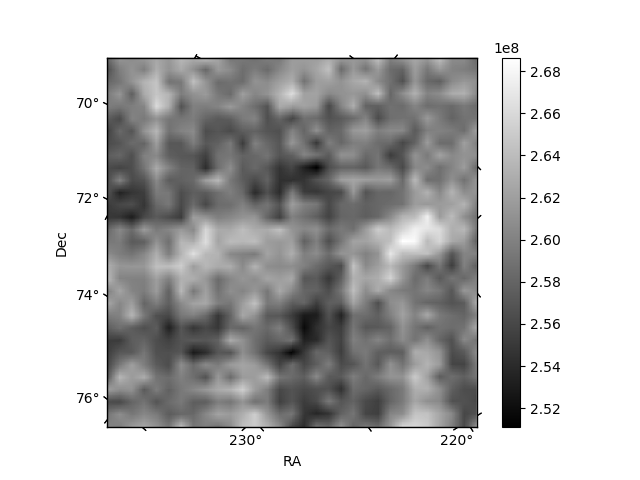
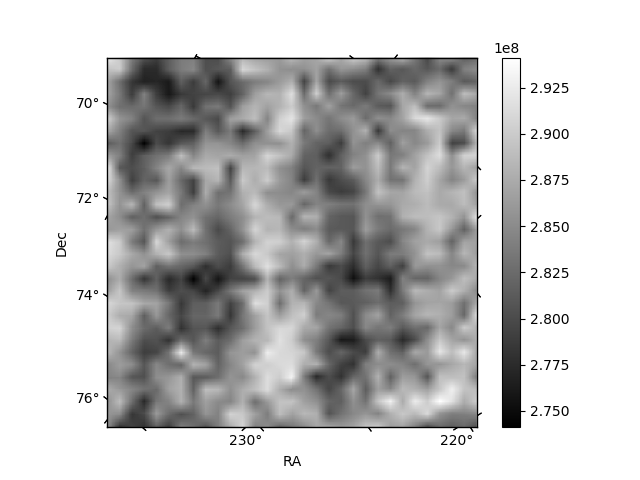
Histogram calculated using DETX and DETY for each event in the final _common_clean file
| Quadrant A | 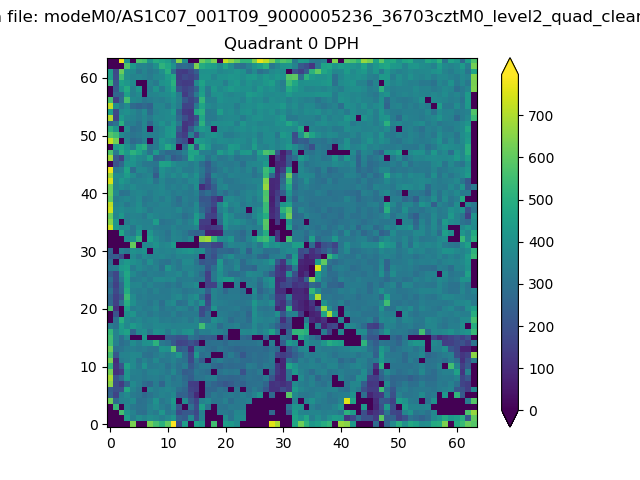 |
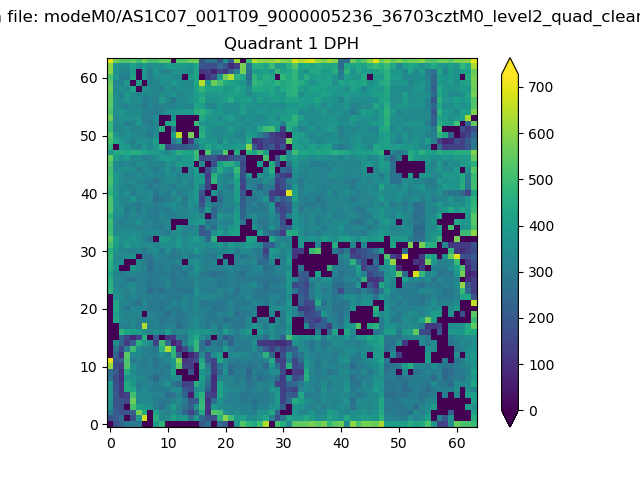 |
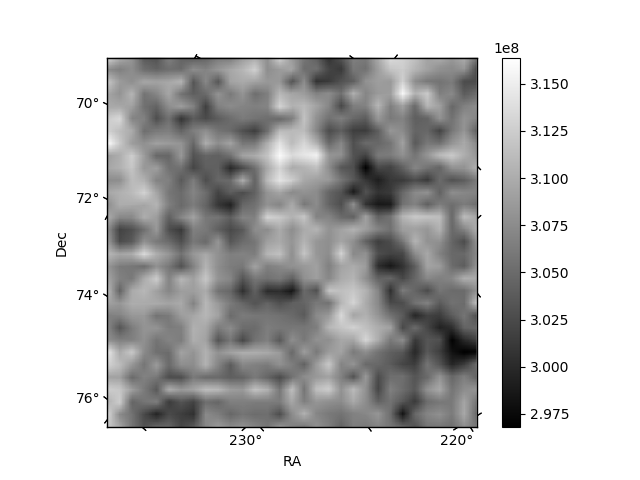
Quadrant B |
|---|---|---|---|
| Quadrant D | 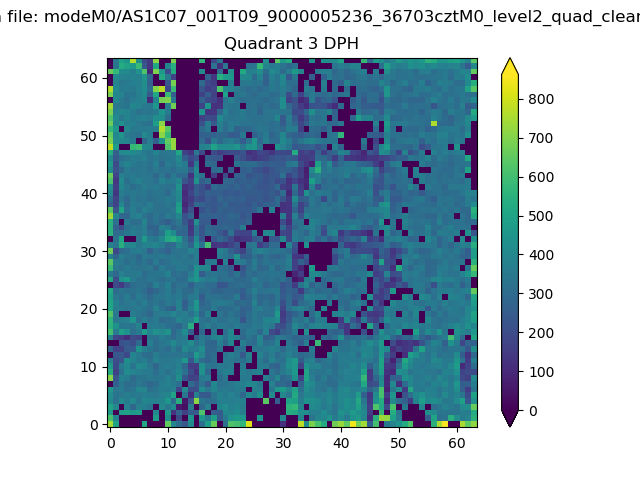 |
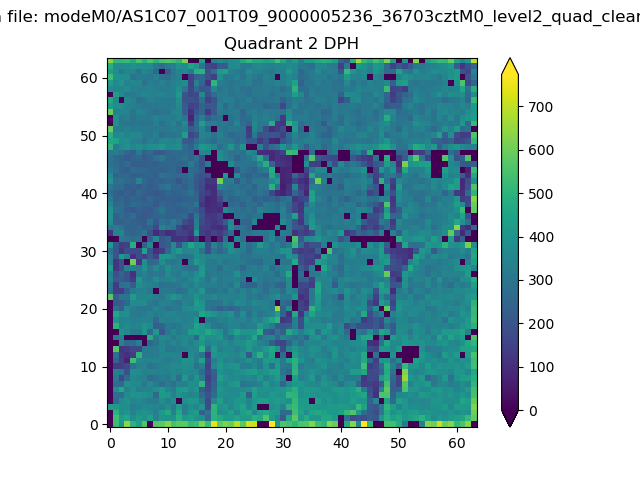 |
Quadrant C |
| Plot type | Count rate plots | Images |
|---|---|---|
| Comparison with Poisson distribution Blue bars denote a histogram of data divided into 1 sec bins. Red curve is a Poisson curve with rate = median count rate of data. |
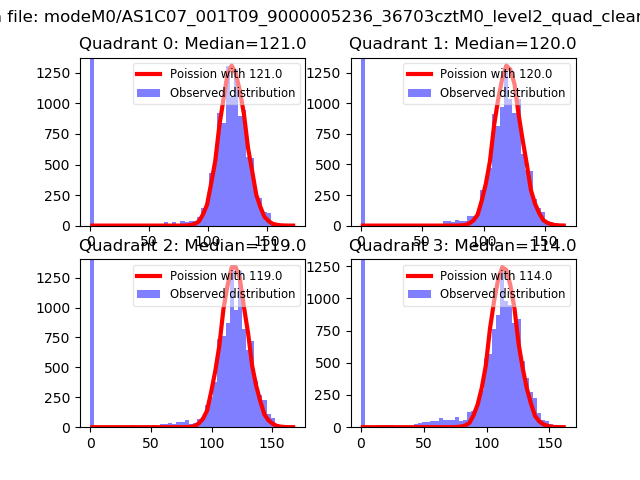 |
 |
| Quadrant-wise count rates Data is divided into 100 sec bins |
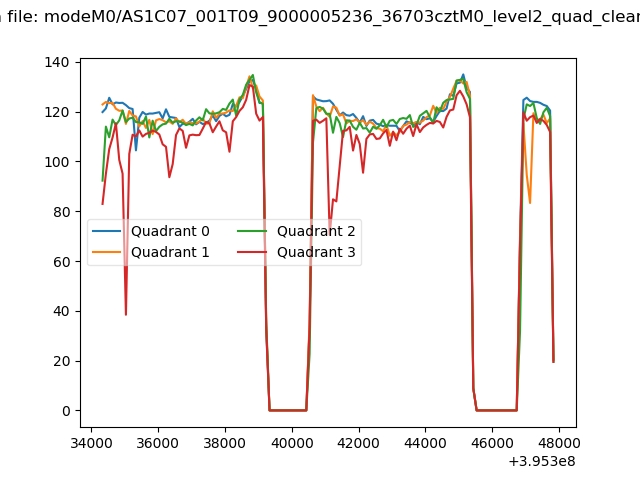 |
|
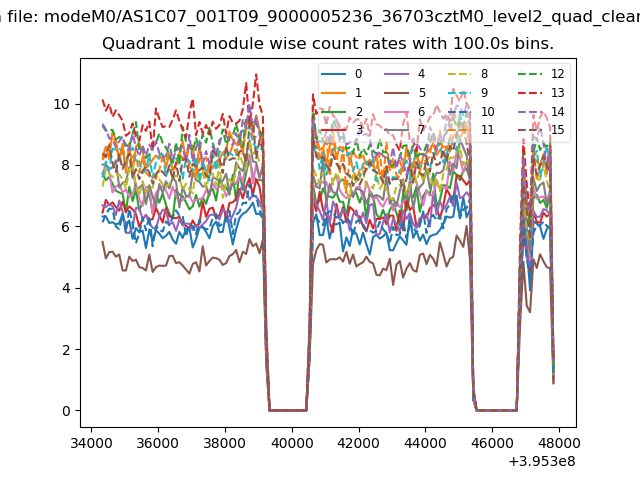
| Module-wise count rates for Quadrant A Data is divided into 100 sec bins |
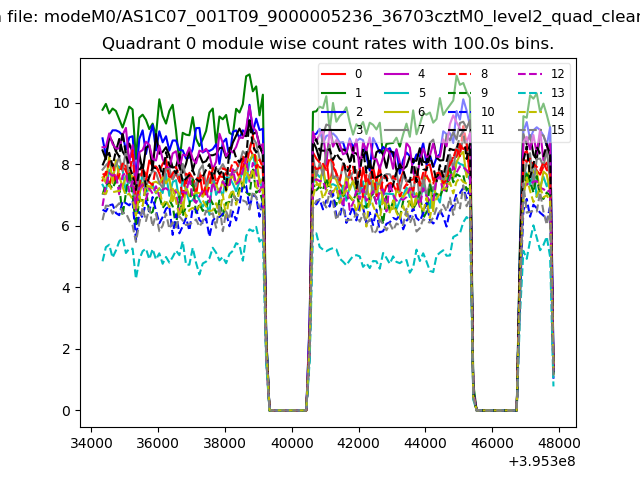 |
 |
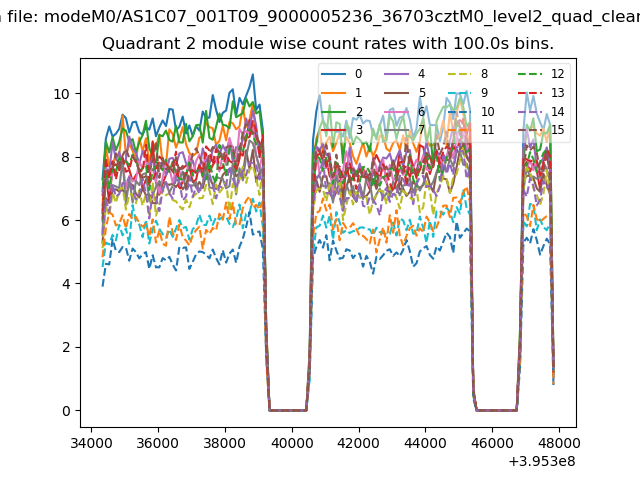
| Module-wise count rates for Quadrant B Data is divided into 100 sec bins |
 |
 |
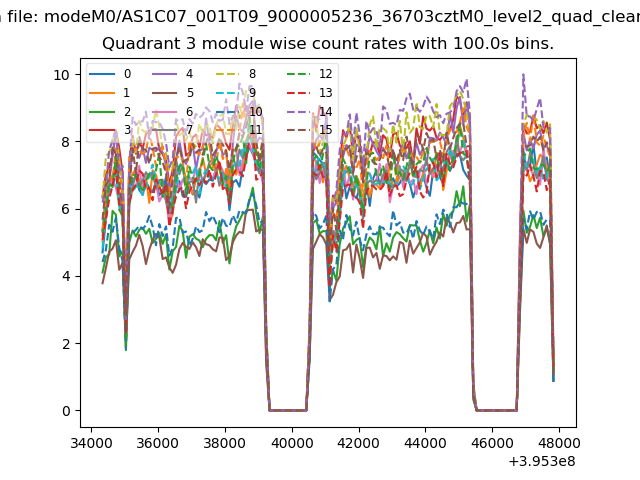
| Module-wise count rates for Quadrant C Data is divided into 100 sec bins |
 |
 |
| Module-wise count rates for Quadrant D Data is divided into 100 sec bins |
 |
 |
| Parameter | Plot |
|---|---|
| CZT HV Monitor |  |
| D_VDD |  |
| Temperature 1 | 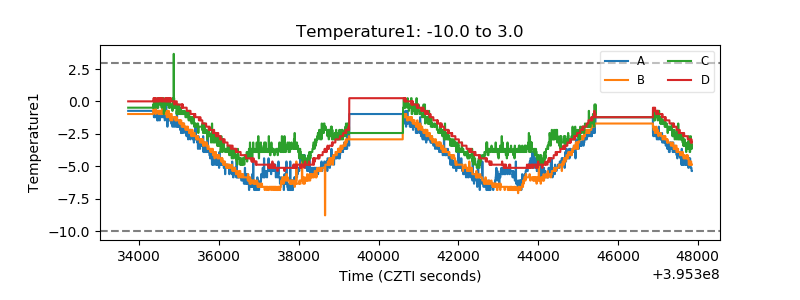 |
| Veto HV Monitor | 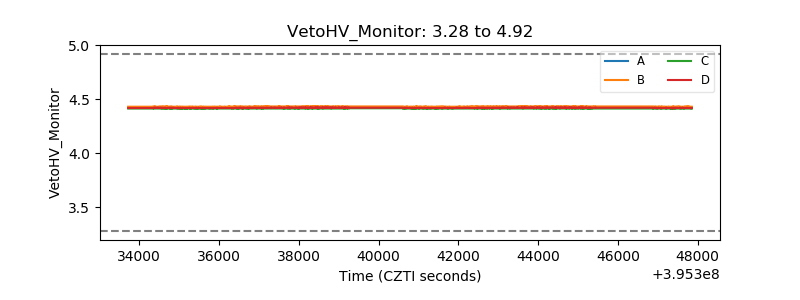 |
| Veto LLD |  |
| Alpha Counter | 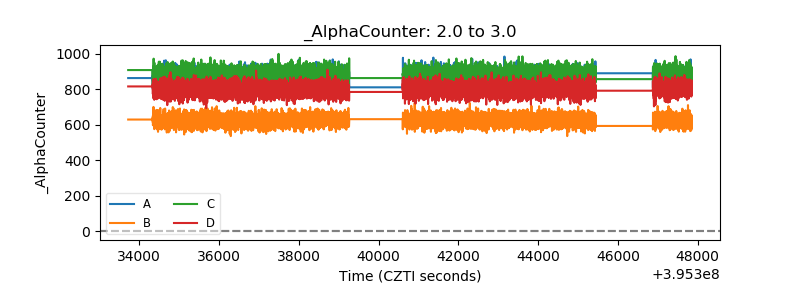 |
| _CPM_Rate | 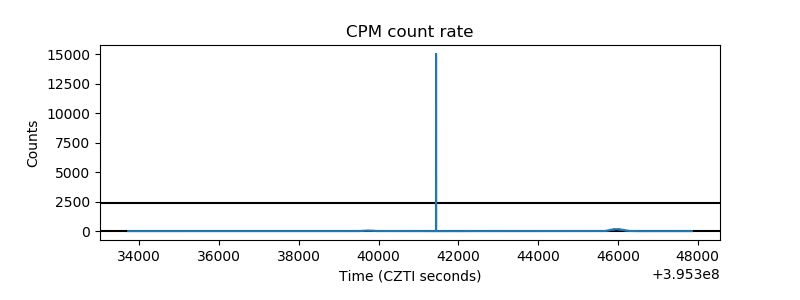 |
| CZT Counter | 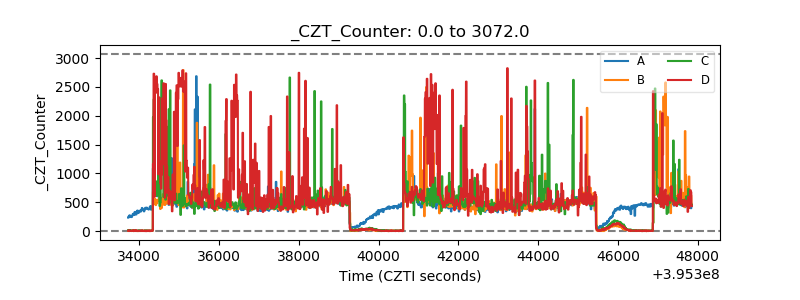 |
| +2.5 Volts monitor | 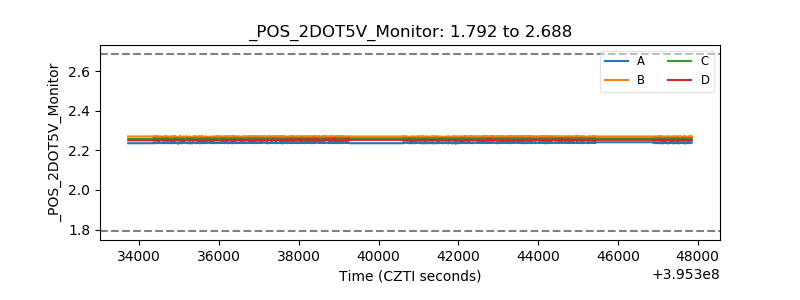 |
| +5 Volts monitor | 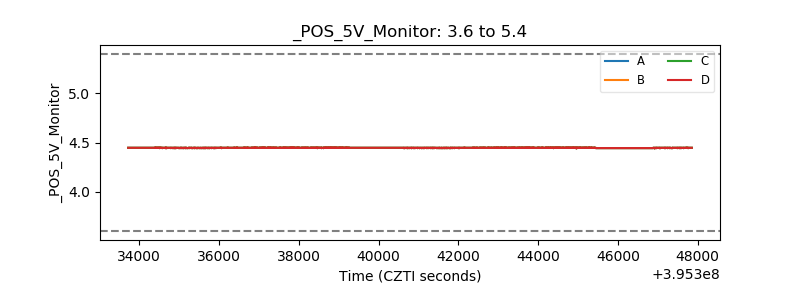 |
| _ROLL_ROT | 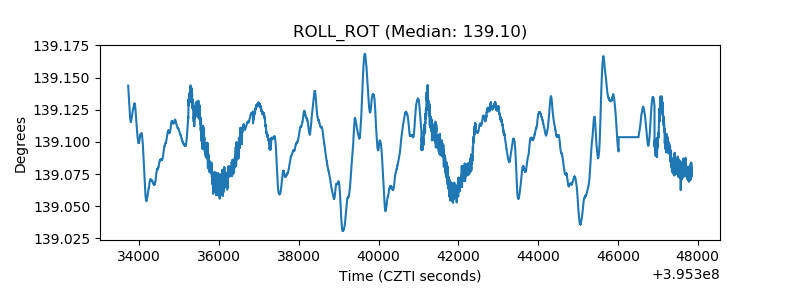 |
| _Roll_DEC | 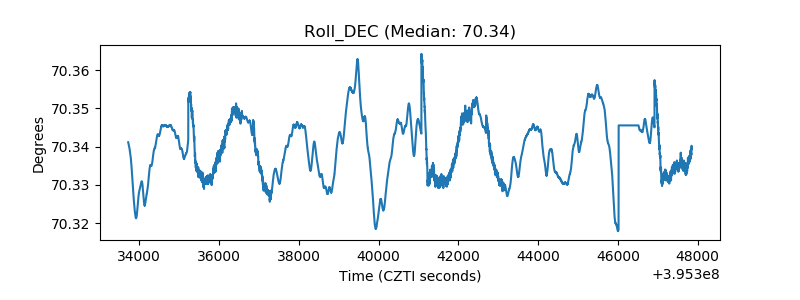 |
| _Roll_RA | 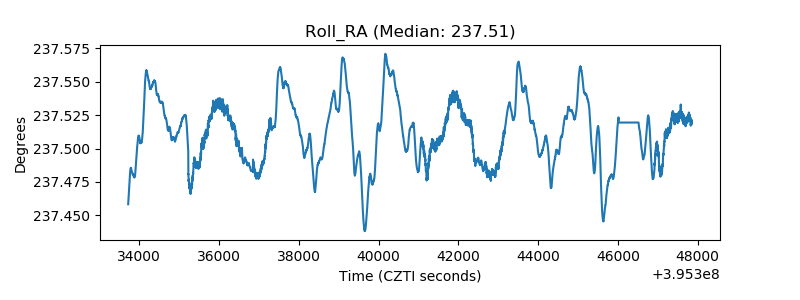 |
| Veto Counter | 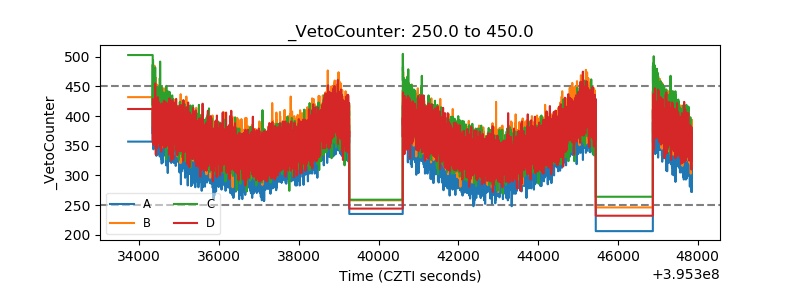 |