| Param | Original file | Final file |
|---|---|---|
| Filename | modeM0/AS1C07_001T09_9000005236_36705cztM0_level2.evt | modeM0/AS1C07_001T09_9000005236_36705cztM0_level2_quad_clean.evt |
| Size (bytes) | 438,534,720 | 99,368,640 |
| Size | 418.2 MB | 94.8 MB |
| Events in quadrant A | 2,681,491 | 668,271 |
| Events in quadrant B | 2,747,360 | 673,252 |
| Events in quadrant C | 4,265,480 | 643,601 |
| Events in quadrant D | 3,212,080 | 638,416 |
| Mode SS | |||
|---|---|---|---|
| Quadrant | BADHDUFLAG | Total packets | Discarded packets |
| A | 0 | 114 | 0 |
| B | 0 | 114 | 0 |
| C | 0 | 114 | 0 |
| D | 0 | 114 | 0 |
| Mode M9 | |||
|---|---|---|---|
| Quadrant | BADHDUFLAG | Total packets | Discarded packets |
| A | 0 | 23 | 0 |
| B | 0 | 23 | 0 |
| C | 0 | 23 | 0 |
| D | 0 | 24 | 0 |
| Mode M0 | |||
|---|---|---|---|
| Quadrant | BADHDUFLAG | Total packets | Discarded packets |
| A | 0 | 11770 | 3 |
| B | 0 | 12022 | 2 |
| C | 0 | 16326 | 2 |
| D | 0 | 13516 | 2 |
| Quadrant | Total seconds | Saturated seconds | Saturation percentage |
|---|---|---|---|
| A | 5505 | 25 | 0.454133% |
| B | 5505 | 20 | 0.363306% |
| C | 5505 | 398 | 7.229791% |
| D | 5505 | 157 | 2.851953% |
Noise dominated data is calculated using 1-second bins in cleaned event files. If a bin has >2000 counts, and if more than 50% of those come from <1% of pixels, then it is considered to be noise-dominated and hence unusable.
| Quadrant | # 1 sec bins | Bins with >0 counts | Bins with >2000 counts | High rate bins dominated by noise | Noise dominated (total time) | Noise dominated (detector-on time) | Marked lightcurve |
|---|---|---|---|---|---|---|---|
| A | 7178 | 5506 | 21 | 21 | 0.29% | 0.38% | 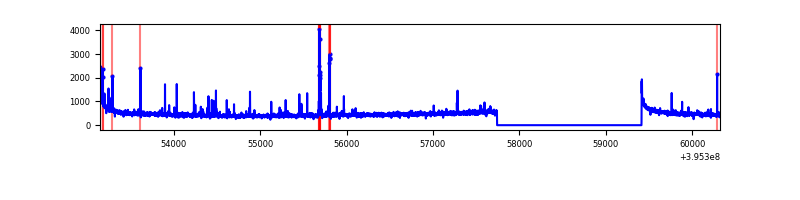 |
| B | 7178 | 5506 | 13 | 13 | 0.18% | 0.24% | 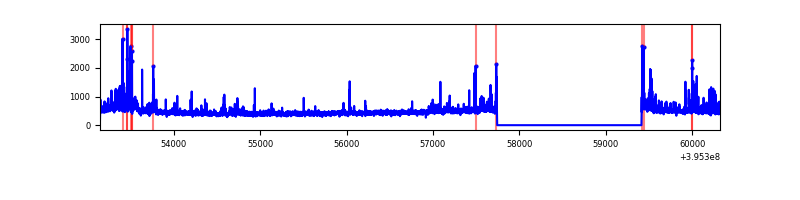 |
| C | 7178 | 5506 | 350 | 350 | 4.88% | 6.36% | 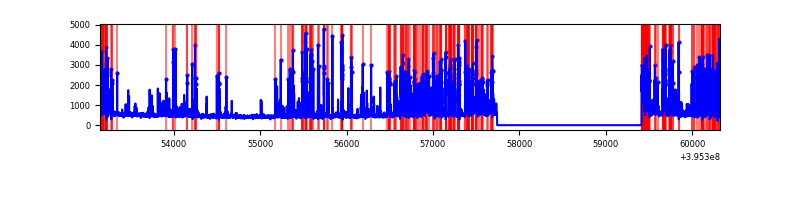 |
| D | 7178 | 5506 | 132 | 132 | 1.84% | 2.40% | 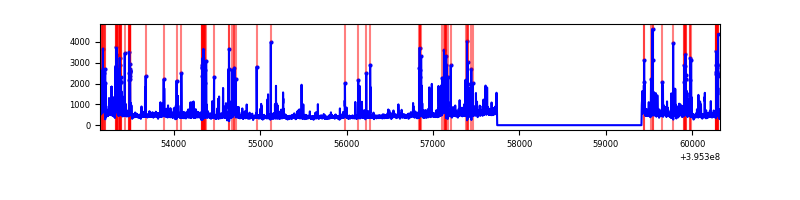 |
Top three noisy pixels from each quadrant. If the there are fewer than three noisy pixels in the level2.evt file, extra rows are filled as -1
| Pixel properties | Quadrant properties | ||||||
|---|---|---|---|---|---|---|---|
| Quadrant | DetID | PixID | Counts | Sigma | Mean | Median | Sigma |
| A | 10 | 83 | 219643 | 1803.17 | 600 | 588 | 121.5 |
| A | 9 | 143 | 113509 | 929.52 | 600 | 588 | 121.5 |
| A | 13 | 6 | 12507 | 98.11 | 600 | 588 | 121.5 |
| B | 0 | 221 | 134539 | 1179.22 | 601 | 584 | 113.6 |
| B | 5 | 255 | 74039 | 646.63 | 601 | 584 | 113.6 |
| B | 0 | 229 | 41167 | 357.26 | 601 | 584 | 113.6 |
| C | 0 | 10 | 1385037 | 10423.08 | 572 | 576 | 132.8 |
| C | 14 | 254 | 346652 | 2605.47 | 572 | 576 | 132.8 |
| C | 15 | 214 | 243706 | 1830.43 | 572 | 576 | 132.8 |
| D | 12 | 233 | 225054 | 1583.72 | 581 | 566 | 141.7 |
| D | 13 | 249 | 202913 | 1427.52 | 581 | 566 | 141.7 |
| D | 13 | 171 | 128386 | 901.75 | 581 | 566 | 141.7 |
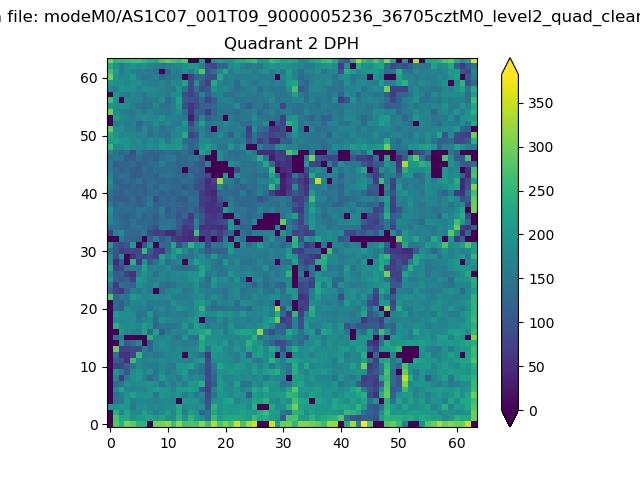
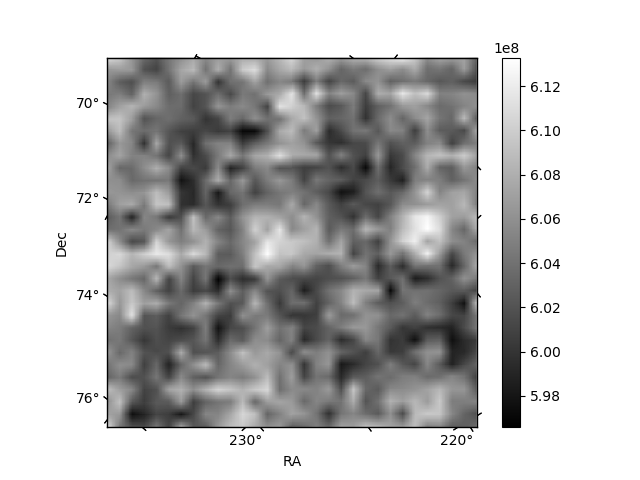
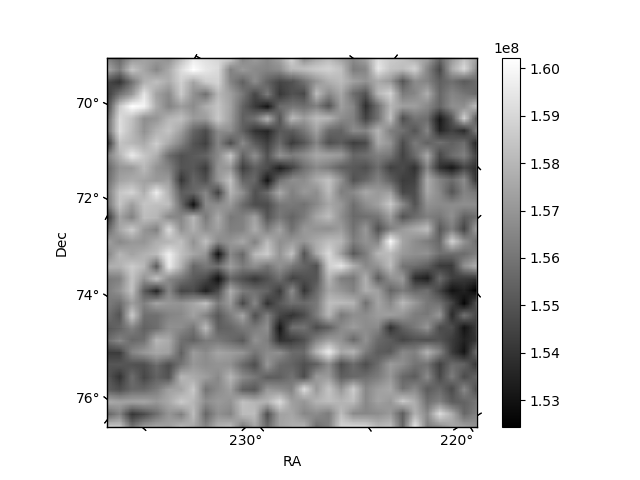
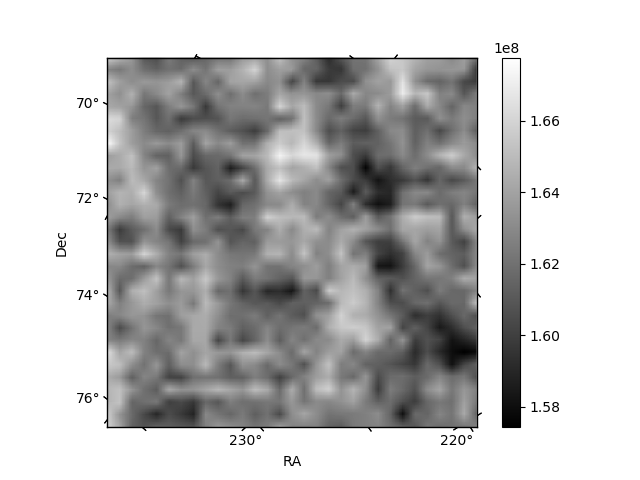
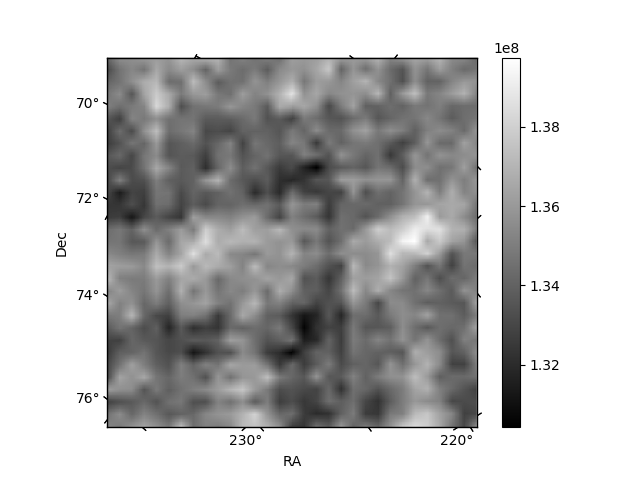
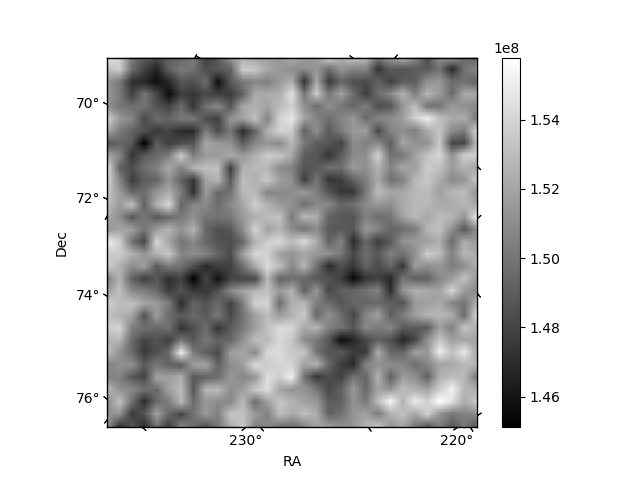
Histogram calculated using DETX and DETY for each event in the final _common_clean file
| Quadrant A | 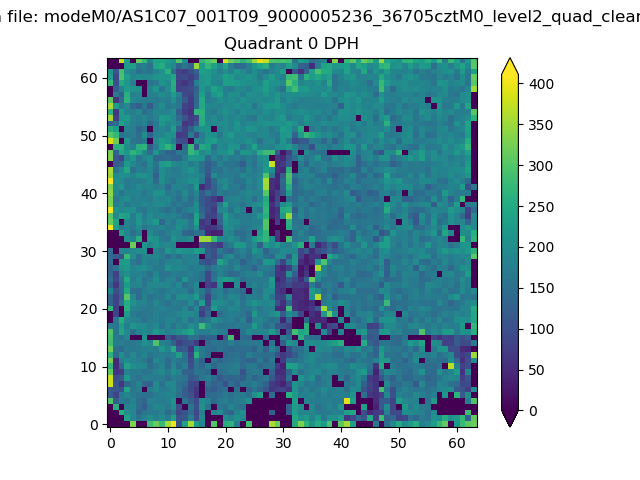 |
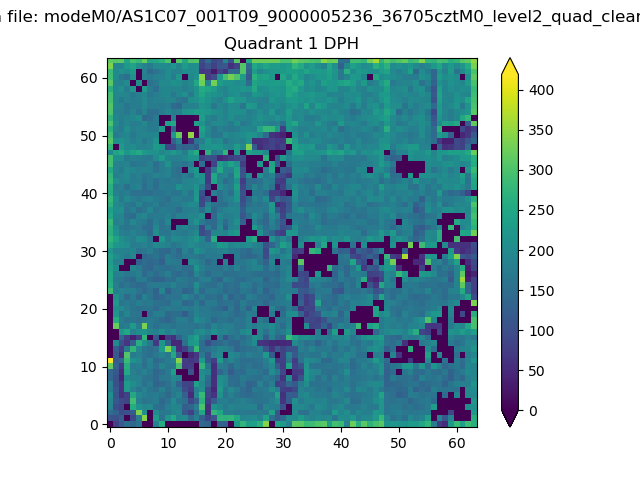 |
Quadrant B |
|---|---|---|---|
| Quadrant D | 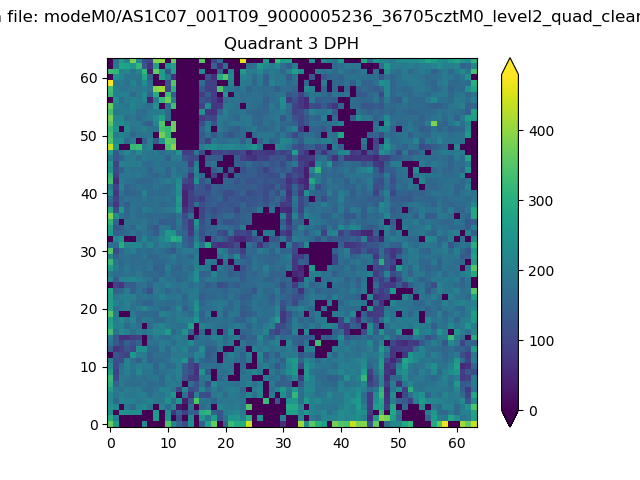 |
 |
Quadrant C |
| Plot type | Count rate plots | Images |
|---|---|---|
| Comparison with Poisson distribution Blue bars denote a histogram of data divided into 1 sec bins. Red curve is a Poisson curve with rate = median count rate of data. |
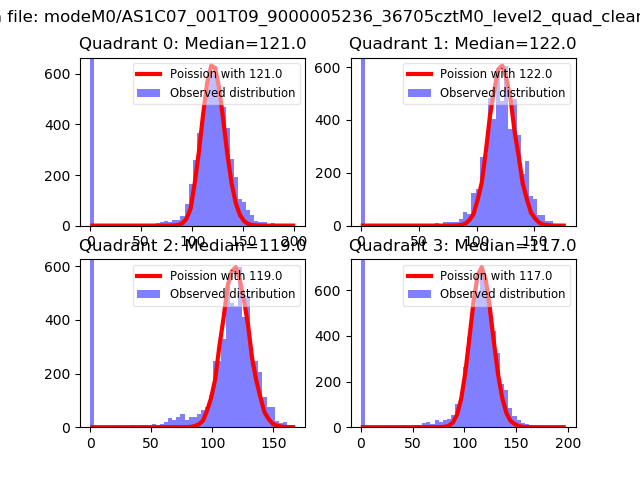 |
 |
| Quadrant-wise count rates Data is divided into 100 sec bins |
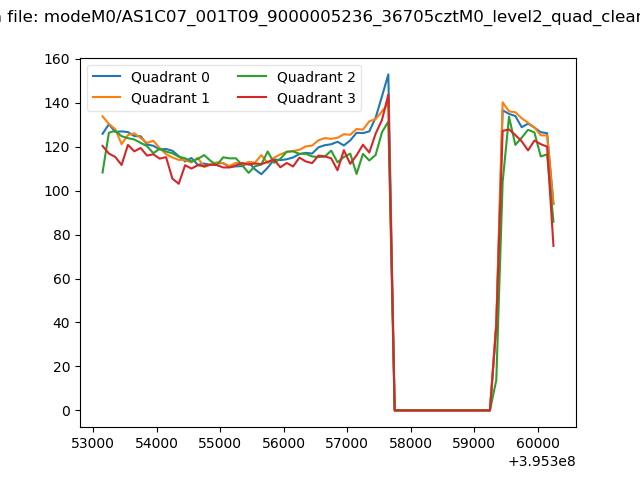 |
|
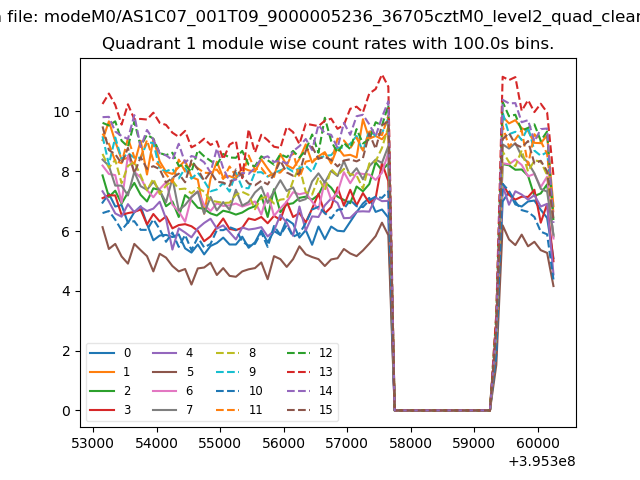
| Module-wise count rates for Quadrant A Data is divided into 100 sec bins |
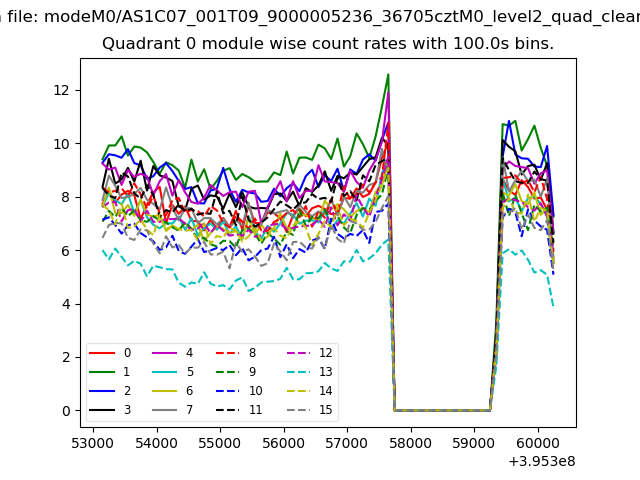 |
 |
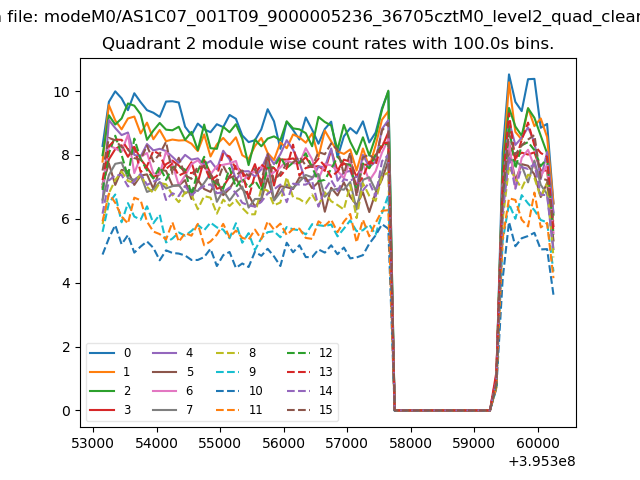
| Module-wise count rates for Quadrant B Data is divided into 100 sec bins |
 |
 |
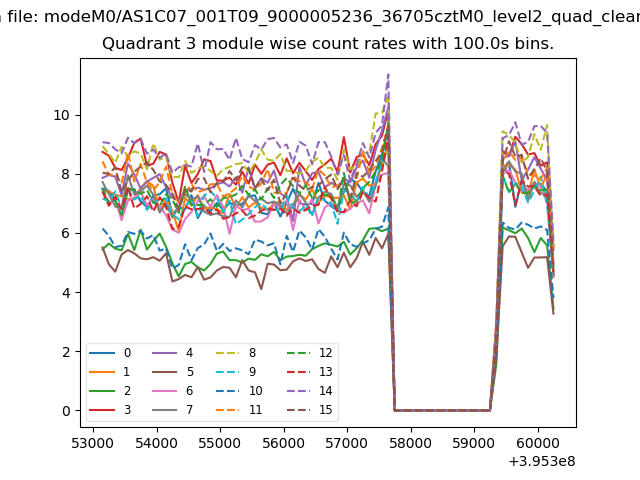
| Module-wise count rates for Quadrant C Data is divided into 100 sec bins |
 |
 |
| Module-wise count rates for Quadrant D Data is divided into 100 sec bins |
 |
 |
| Parameter | Plot |
|---|---|
| CZT HV Monitor | 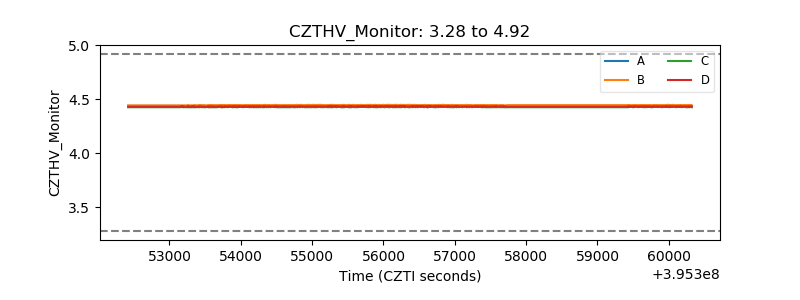 |
| D_VDD | 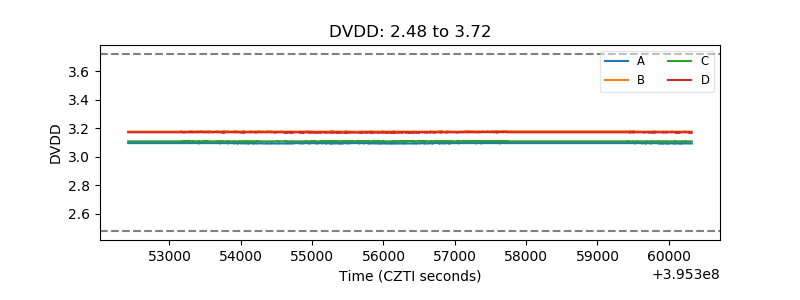 |
| Temperature 1 | 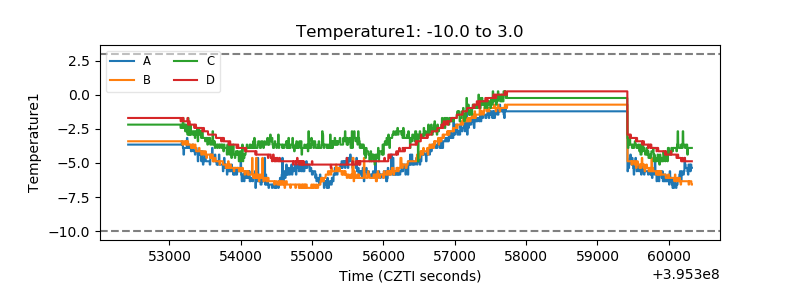 |
| Veto HV Monitor | 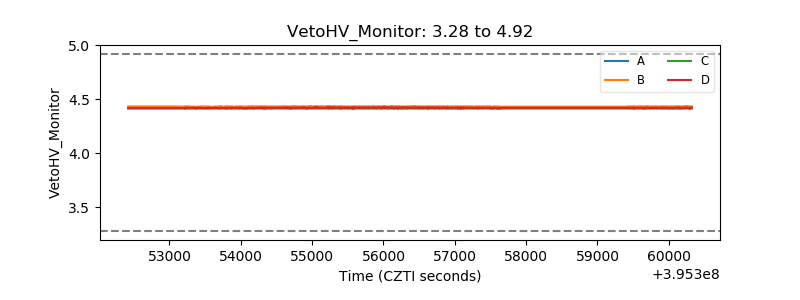 |
| Veto LLD | 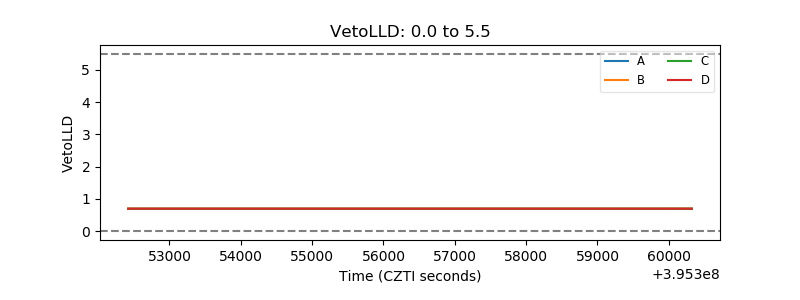 |
| Alpha Counter | 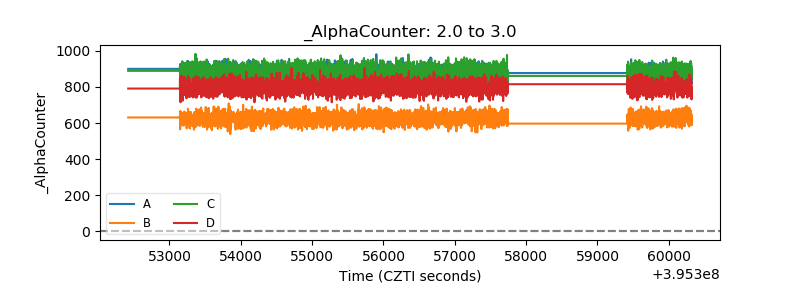 |
| _CPM_Rate | 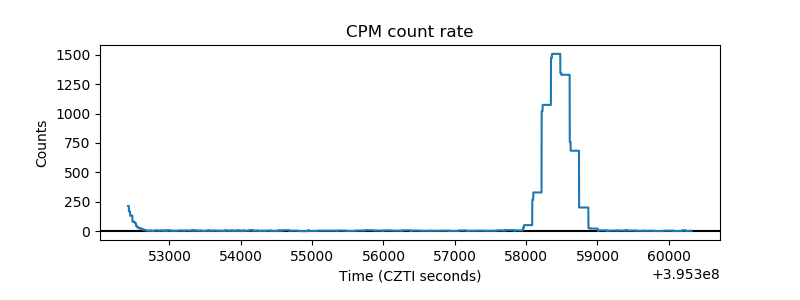 |
| CZT Counter | 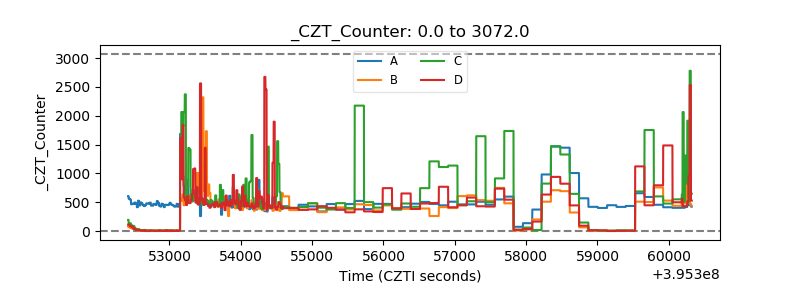 |
| +2.5 Volts monitor |  |
| +5 Volts monitor |  |
| _ROLL_ROT | 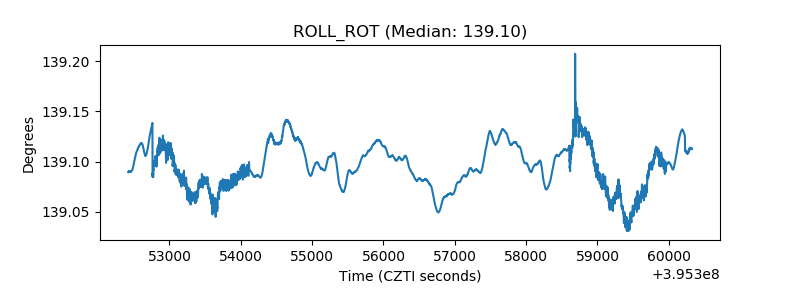 |
| _Roll_DEC | 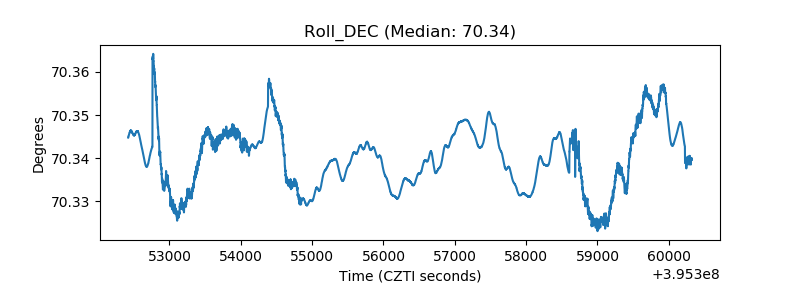 |
| _Roll_RA | 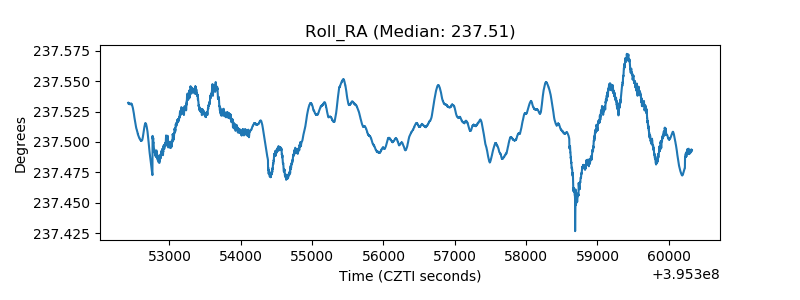 |
| Veto Counter | 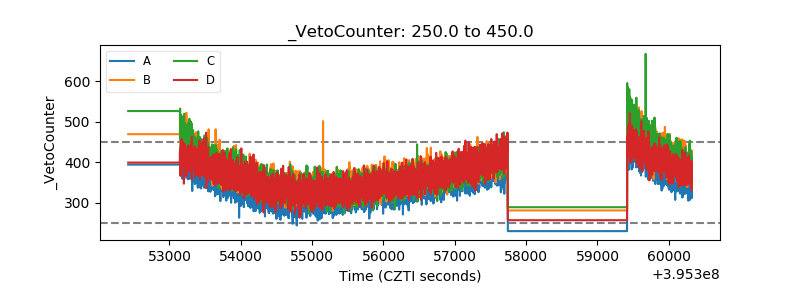 |