| Param | Original file | Final file |
|---|---|---|
| Filename | modeM0/AS1C07_001T09_9000005236_36707cztM0_level2.evt | modeM0/AS1C07_001T09_9000005236_36707cztM0_level2_quad_clean.evt |
| Size (bytes) | 439,724,160 | 97,292,160 |
| Size | 419.4 MB | 92.8 MB |
| Events in quadrant A | 2,523,640 | 656,879 |
| Events in quadrant B | 2,772,085 | 663,265 |
| Events in quadrant C | 3,864,517 | 640,726 |
| Events in quadrant D | 3,797,618 | 615,183 |
| Mode SS | |||
|---|---|---|---|
| Quadrant | BADHDUFLAG | Total packets | Discarded packets |
| A | 0 | 108 | 0 |
| B | 0 | 108 | 0 |
| C | 0 | 108 | 0 |
| D | 0 | 108 | 0 |
| Mode M9 | |||
|---|---|---|---|
| Quadrant | BADHDUFLAG | Total packets | Discarded packets |
| A | 0 | 28 | 0 |
| B | 0 | 28 | 0 |
| C | 0 | 28 | 0 |
| D | 0 | 29 | 0 |
| Mode M0 | |||
|---|---|---|---|
| Quadrant | BADHDUFLAG | Total packets | Discarded packets |
| A | 0 | 11069 | 3 |
| B | 0 | 11784 | 2 |
| C | 0 | 14880 | 2 |
| D | 0 | 14961 | 2 |
| Quadrant | Total seconds | Saturated seconds | Saturation percentage |
|---|---|---|---|
| A | 5287 | 5 | 0.094572% |
| B | 5287 | 38 | 0.718744% |
| C | 5287 | 325 | 6.147153% |
| D | 5287 | 316 | 5.976925% |
Noise dominated data is calculated using 1-second bins in cleaned event files. If a bin has >2000 counts, and if more than 50% of those come from <1% of pixels, then it is considered to be noise-dominated and hence unusable.
| Quadrant | # 1 sec bins | Bins with >0 counts | Bins with >2000 counts | High rate bins dominated by noise | Noise dominated (total time) | Noise dominated (detector-on time) | Marked lightcurve |
|---|---|---|---|---|---|---|---|
| A | 7081 | 5288 | 2 | 2 | 0.03% | 0.04% | 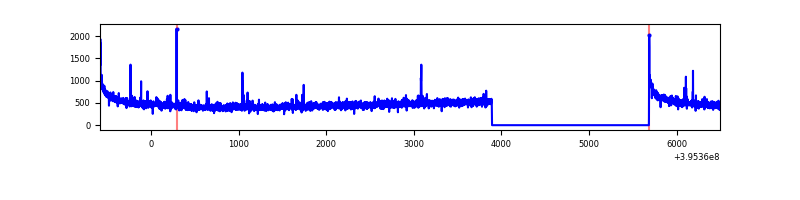 |
| B | 7081 | 5288 | 23 | 23 | 0.32% | 0.43% | 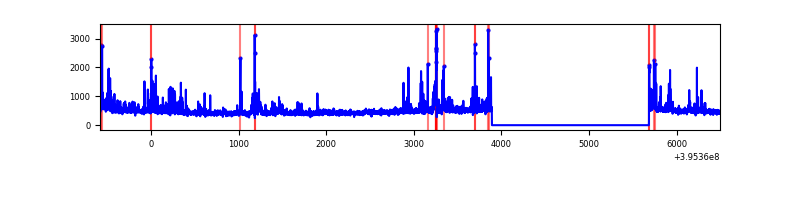 |
| C | 7081 | 5288 | 278 | 278 | 3.93% | 5.26% | 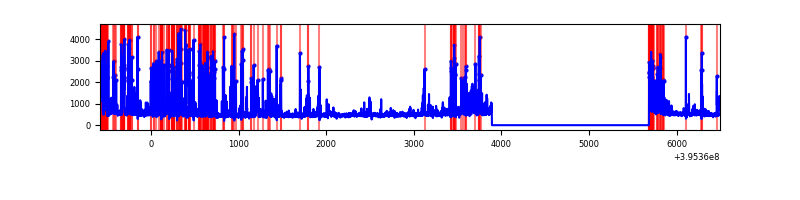 |
| D | 7081 | 5288 | 294 | 294 | 4.15% | 5.56% | 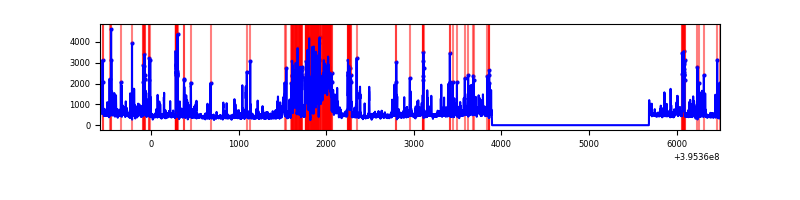 |
Top three noisy pixels from each quadrant. If the there are fewer than three noisy pixels in the level2.evt file, extra rows are filled as -1
| Pixel properties | Quadrant properties | ||||||
|---|---|---|---|---|---|---|---|
| Quadrant | DetID | PixID | Counts | Sigma | Mean | Median | Sigma |
| A | 10 | 83 | 210600 | 1790.19 | 583 | 570 | 117.3 |
| A | 7 | 3 | 16032 | 131.79 | 583 | 570 | 117.3 |
| A | 9 | 143 | 15643 | 128.47 | 583 | 570 | 117.3 |
| B | 0 | 221 | 149591 | 1342.98 | 583 | 569 | 111.0 |
| B | 5 | 255 | 117270 | 1051.7 | 583 | 569 | 111.0 |
| B | 5 | 172 | 56552 | 504.51 | 583 | 569 | 111.0 |
| C | 0 | 10 | 1040345 | 7977.14 | 560 | 564 | 130.3 |
| C | 14 | 254 | 343517 | 2631.12 | 560 | 564 | 130.3 |
| C | 15 | 214 | 235536 | 1802.69 | 560 | 564 | 130.3 |
| D | 13 | 249 | 1100725 | 8177.66 | 555 | 541 | 134.5 |
| D | 13 | 171 | 142776 | 1057.23 | 555 | 541 | 134.5 |
| D | 2 | 250 | 115547 | 854.84 | 555 | 541 | 134.5 |
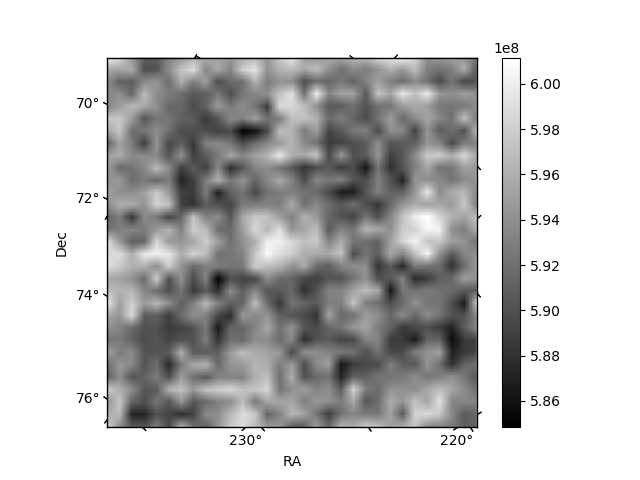
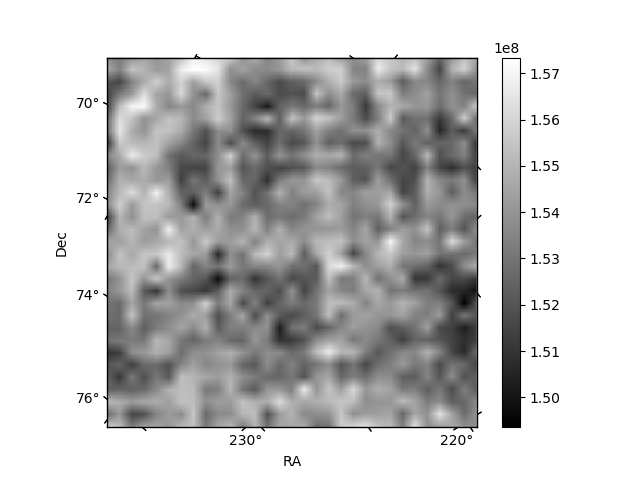
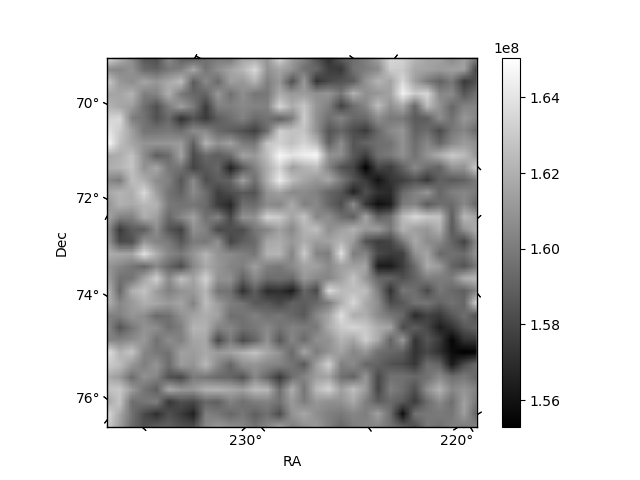
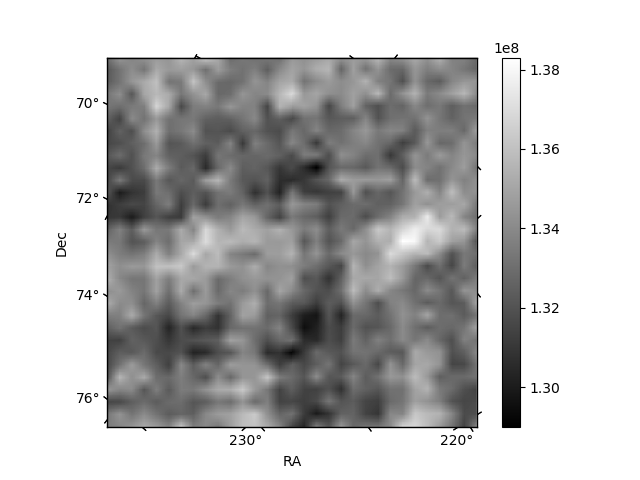
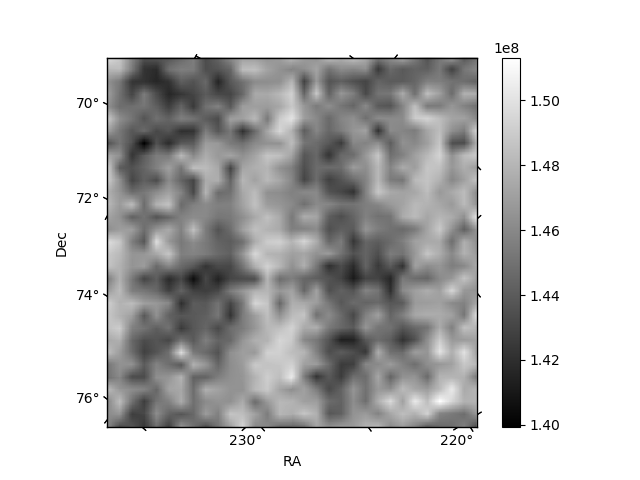
Histogram calculated using DETX and DETY for each event in the final _common_clean file
| Quadrant A | 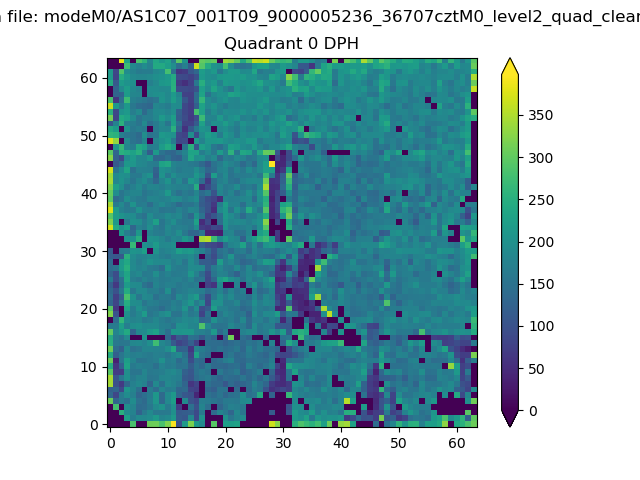 |
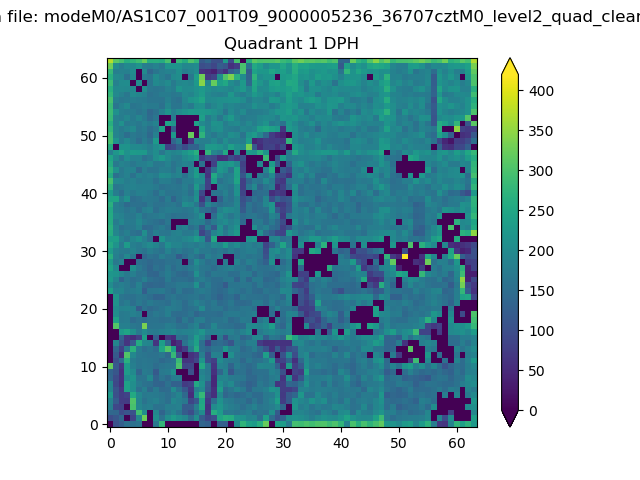 |
Quadrant B |
|---|---|---|---|
| Quadrant D | 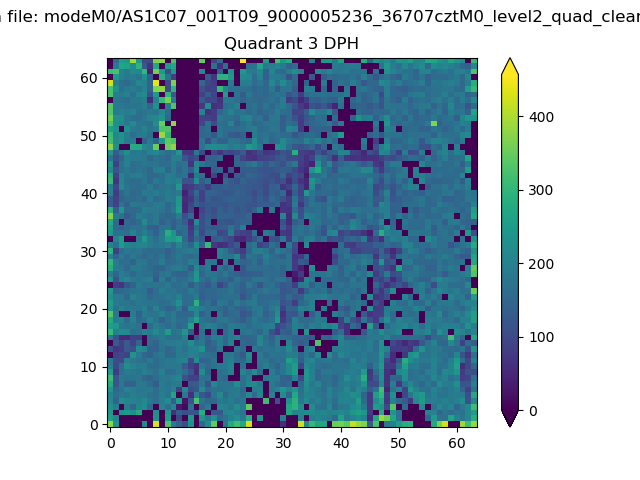 |
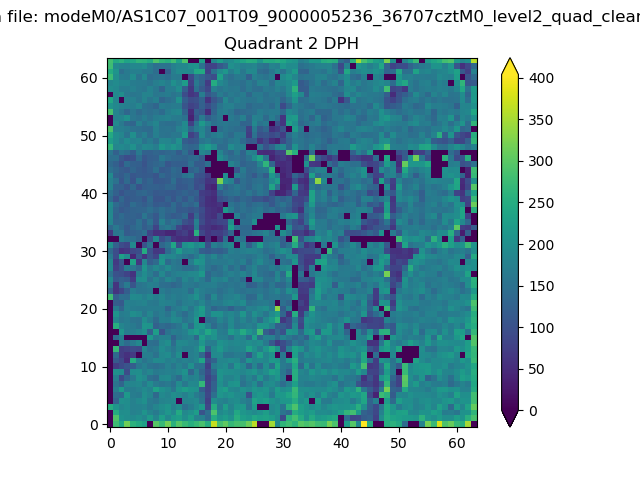 |
Quadrant C |
| Plot type | Count rate plots | Images |
|---|---|---|
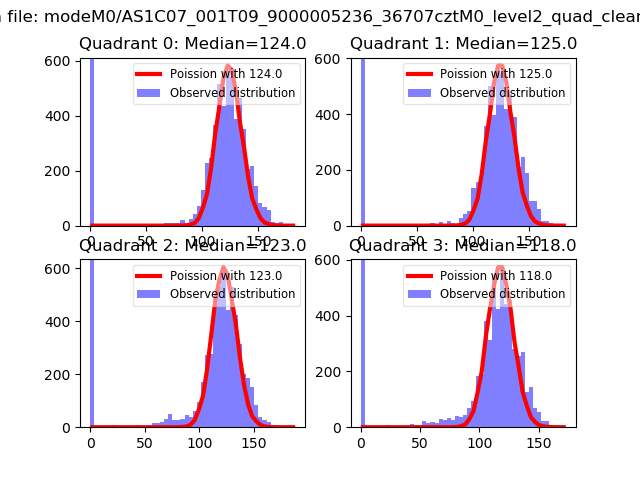
| Comparison with Poisson distribution Blue bars denote a histogram of data divided into 1 sec bins. Red curve is a Poisson curve with rate = median count rate of data. |
 |
 |
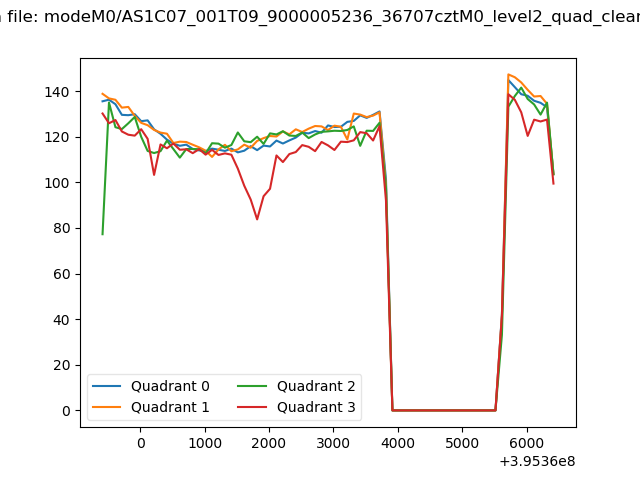
| Quadrant-wise count rates Data is divided into 100 sec bins |
 |
|
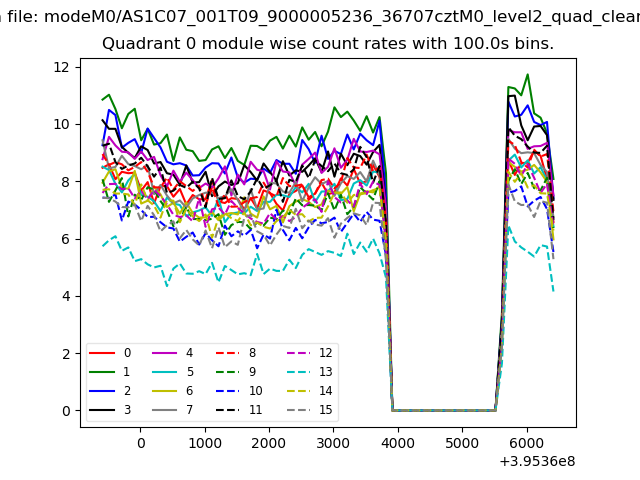
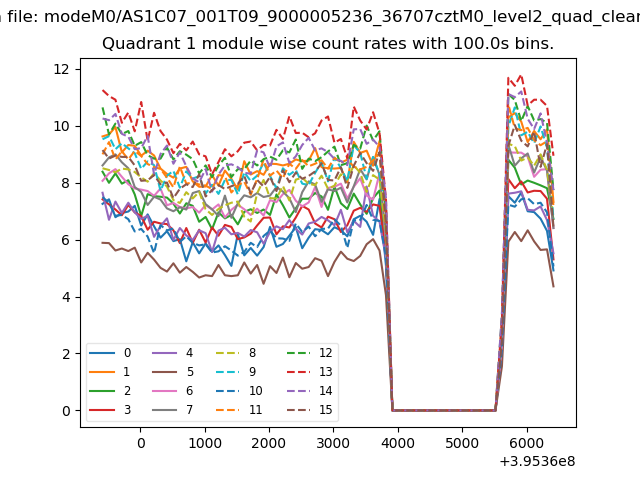
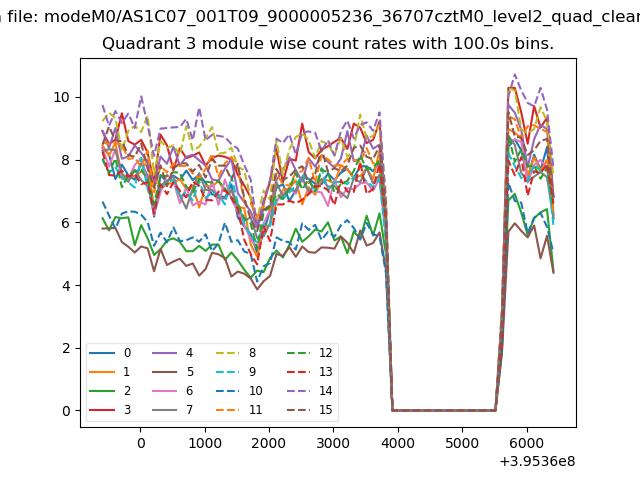
| Module-wise count rates for Quadrant A Data is divided into 100 sec bins |
 |
 |
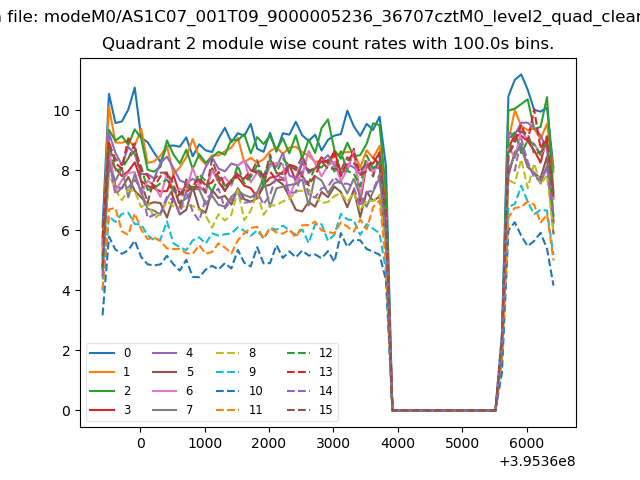
| Module-wise count rates for Quadrant B Data is divided into 100 sec bins |
 |
 |
| Module-wise count rates for Quadrant C Data is divided into 100 sec bins |
 |
 |
| Module-wise count rates for Quadrant D Data is divided into 100 sec bins |
 |
 |
| Parameter | Plot |
|---|---|
| CZT HV Monitor | 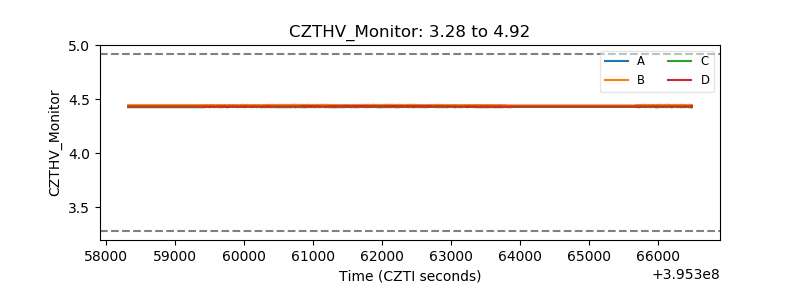 |
| D_VDD | 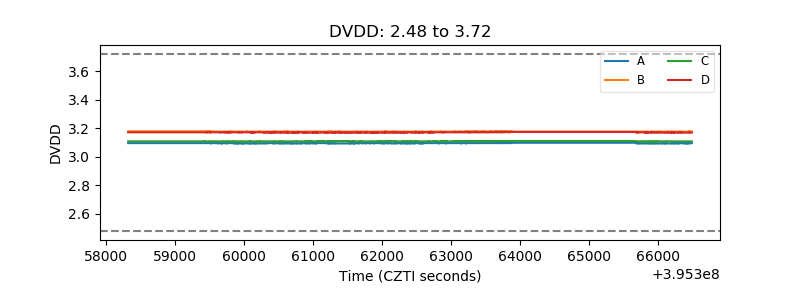 |
| Temperature 1 | 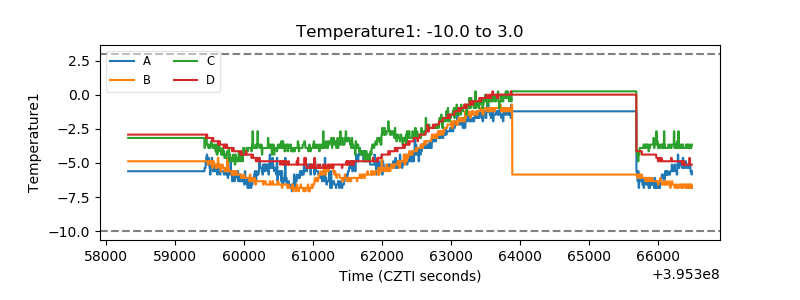 |
| Veto HV Monitor | 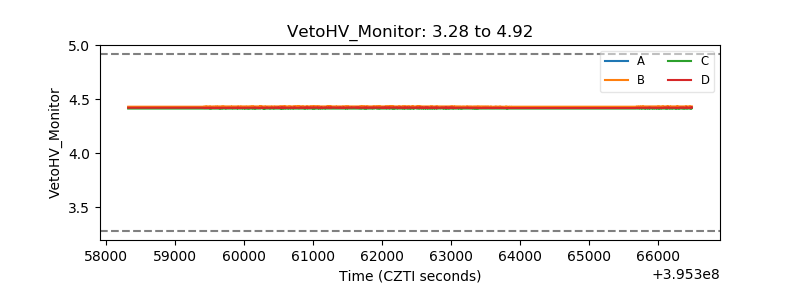 |
| Veto LLD |  |
| Alpha Counter | 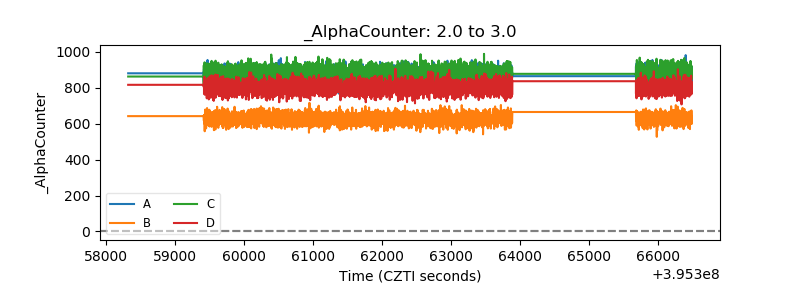 |
| _CPM_Rate | 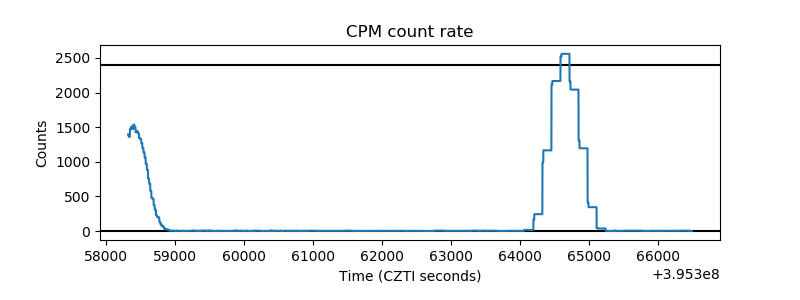 |
| CZT Counter | 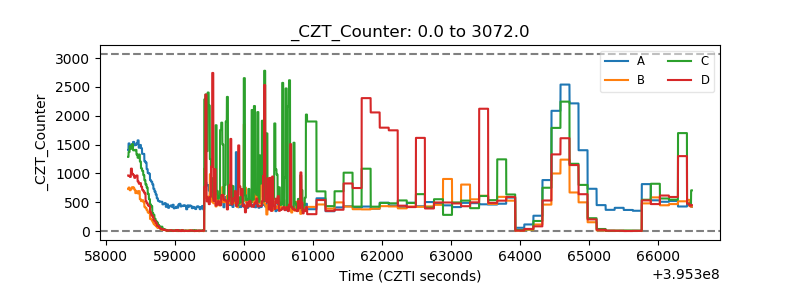 |
| +2.5 Volts monitor |  |
| +5 Volts monitor | 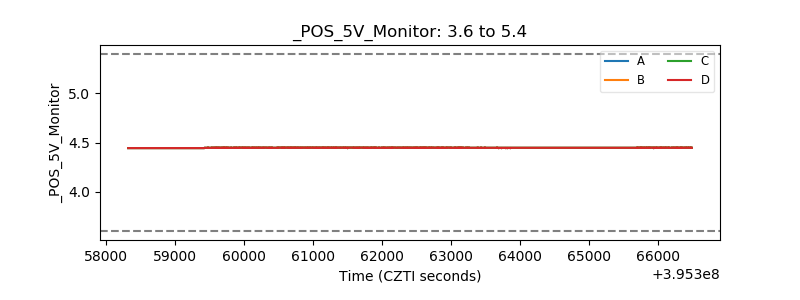 |
| _ROLL_ROT | 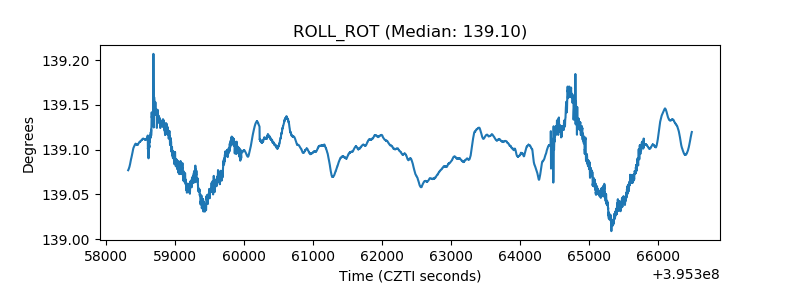 |
| _Roll_DEC | 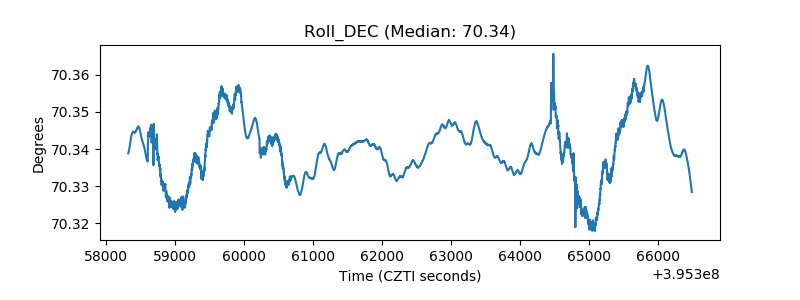 |
| _Roll_RA | 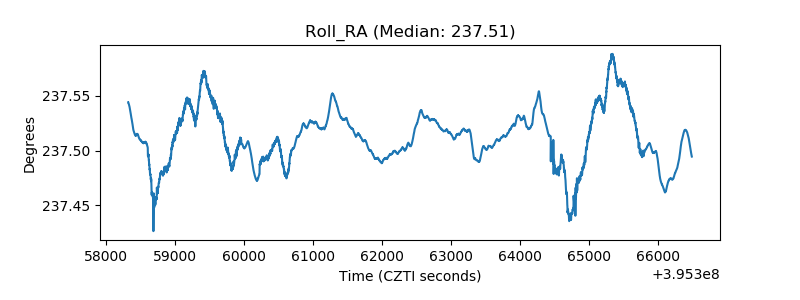 |
| Veto Counter | 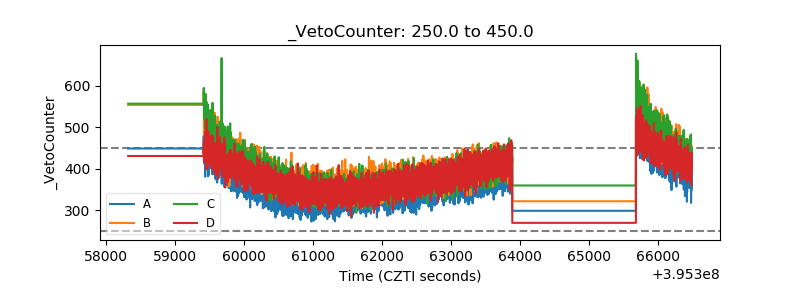 |