| Param | Original file | Final file |
|---|---|---|
| Filename | modeM0/AS1C07_001T09_9000005236_36708cztM0_level2.evt | modeM0/AS1C07_001T09_9000005236_36708cztM0_level2_quad_clean.evt |
| Size (bytes) | 412,531,200 | 103,944,960 |
| Size | 393.4 MB | 99.1 MB |
| Events in quadrant A | 2,630,473 | 701,725 |
| Events in quadrant B | 2,685,340 | 718,135 |
| Events in quadrant C | 3,389,493 | 693,629 |
| Events in quadrant D | 3,419,508 | 654,908 |
| Mode SS | |||
|---|---|---|---|
| Quadrant | BADHDUFLAG | Total packets | Discarded packets |
| A | 0 | 110 | 0 |
| B | 0 | 110 | 0 |
| C | 0 | 110 | 0 |
| D | 0 | 110 | 0 |
| Mode M9 | |||
|---|---|---|---|
| Quadrant | BADHDUFLAG | Total packets | Discarded packets |
| A | 0 | 33 | 0 |
| B | 0 | 33 | 0 |
| C | 0 | 33 | 0 |
| D | 0 | 34 | 0 |
| Mode M0 | |||
|---|---|---|---|
| Quadrant | BADHDUFLAG | Total packets | Discarded packets |
| A | 0 | 11390 | 3 |
| B | 0 | 11502 | 2 |
| C | 0 | 13495 | 2 |
| D | 0 | 13913 | 2 |
| Quadrant | Total seconds | Saturated seconds | Saturation percentage |
|---|---|---|---|
| A | 5424 | 17 | 0.313422% |
| B | 5424 | 15 | 0.276549% |
| C | 5424 | 177 | 3.263274% |
| D | 5424 | 169 | 3.115782% |
Noise dominated data is calculated using 1-second bins in cleaned event files. If a bin has >2000 counts, and if more than 50% of those come from <1% of pixels, then it is considered to be noise-dominated and hence unusable.
| Quadrant | # 1 sec bins | Bins with >0 counts | Bins with >2000 counts | High rate bins dominated by noise | Noise dominated (total time) | Noise dominated (detector-on time) | Marked lightcurve |
|---|---|---|---|---|---|---|---|
| A | 7367 | 5425 | 5 | 5 | 0.07% | 0.09% | 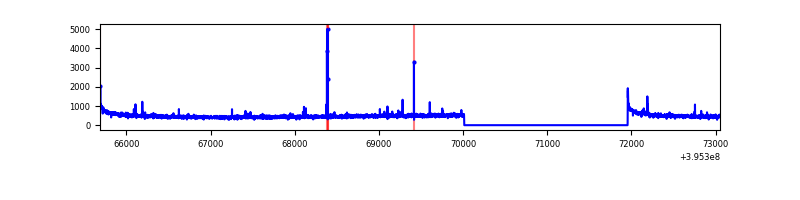 |
| B | 7367 | 5425 | 6 | 6 | 0.08% | 0.11% | 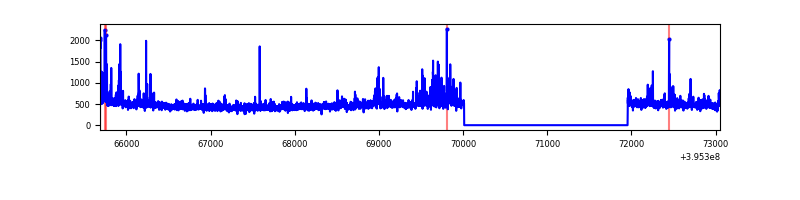 |
| C | 7367 | 5425 | 145 | 145 | 1.97% | 2.67% | 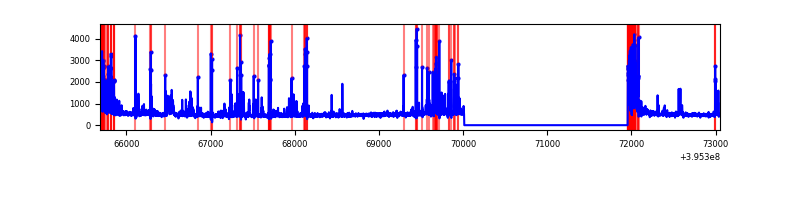 |
| D | 7367 | 5425 | 153 | 153 | 2.08% | 2.82% | 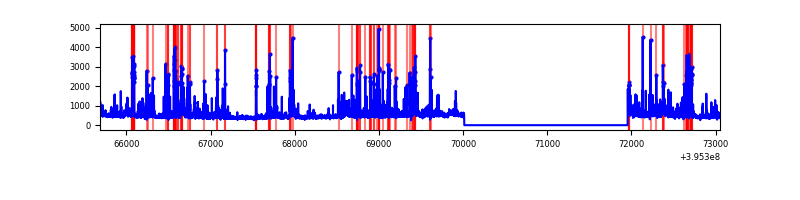 |
Top three noisy pixels from each quadrant. If the there are fewer than three noisy pixels in the level2.evt file, extra rows are filled as -1
| Pixel properties | Quadrant properties | ||||||
|---|---|---|---|---|---|---|---|
| Quadrant | DetID | PixID | Counts | Sigma | Mean | Median | Sigma |
| A | 10 | 83 | 209923 | 1720.13 | 609 | 597 | 121.7 |
| A | 9 | 143 | 37303 | 301.63 | 609 | 597 | 121.7 |
| A | 7 | 3 | 12672 | 99.23 | 609 | 597 | 121.7 |
| B | 0 | 221 | 88058 | 753.66 | 613 | 596 | 116.0 |
| B | 5 | 255 | 65652 | 560.59 | 613 | 596 | 116.0 |
| B | 5 | 172 | 25069 | 210.88 | 613 | 596 | 116.0 |
| C | 14 | 254 | 417693 | 3077.85 | 588 | 591 | 135.5 |
| C | 0 | 10 | 403170 | 2970.68 | 588 | 591 | 135.5 |
| C | 15 | 214 | 243131 | 1789.73 | 588 | 591 | 135.5 |
| D | 13 | 249 | 327427 | 2286.95 | 583 | 565 | 142.9 |
| D | 13 | 171 | 316403 | 2209.82 | 583 | 565 | 142.9 |
| D | 12 | 233 | 185729 | 1295.53 | 583 | 565 | 142.9 |
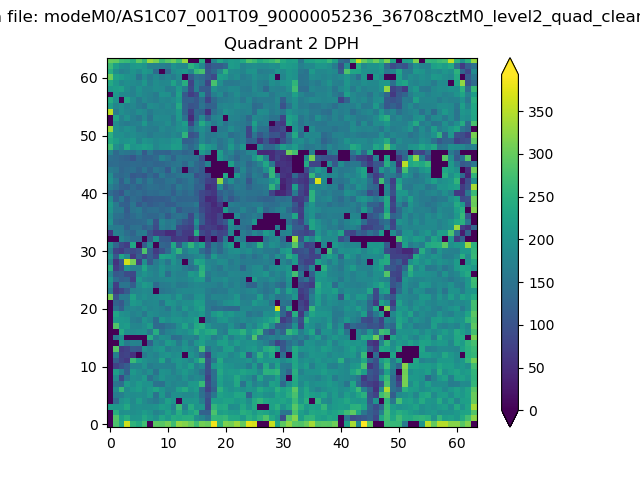
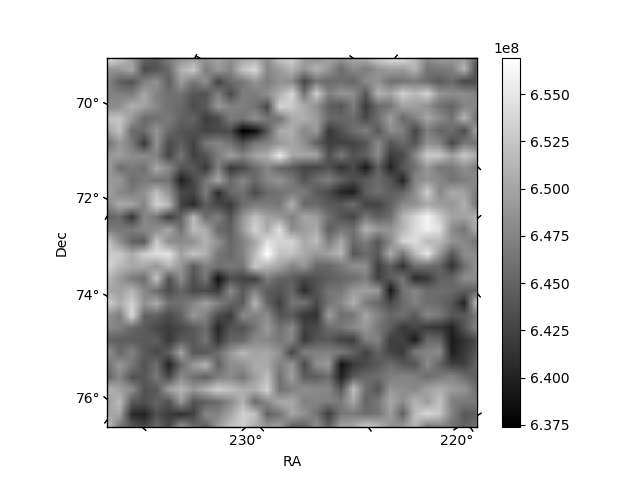
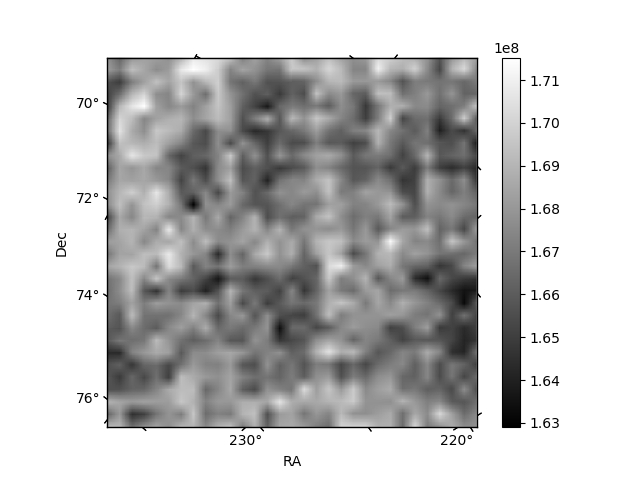
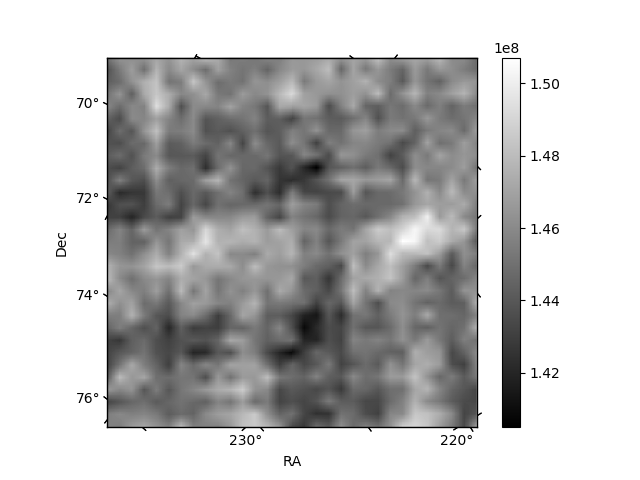
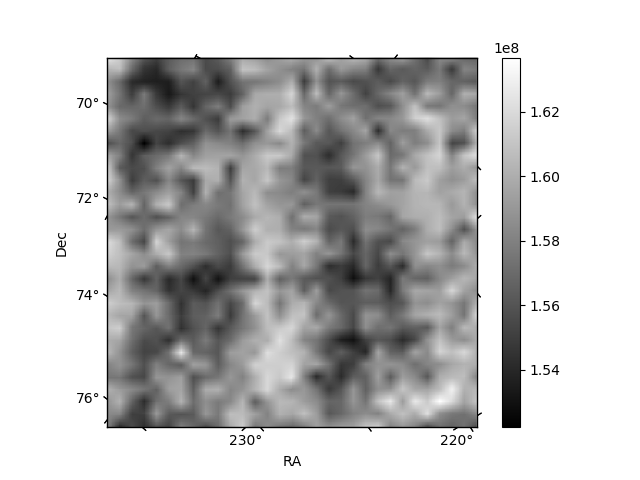
Histogram calculated using DETX and DETY for each event in the final _common_clean file
| Quadrant A | 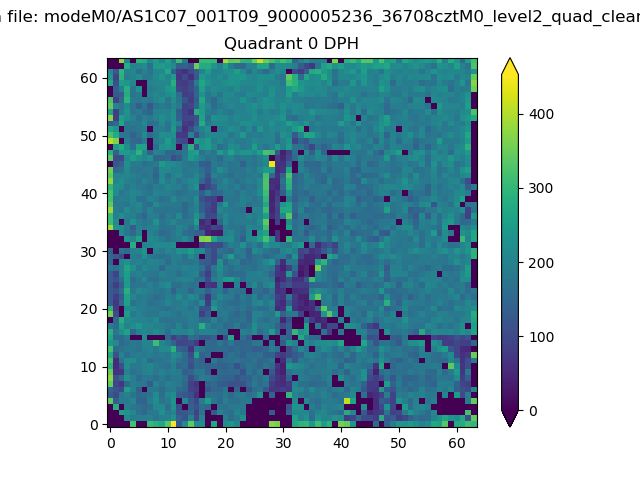 |
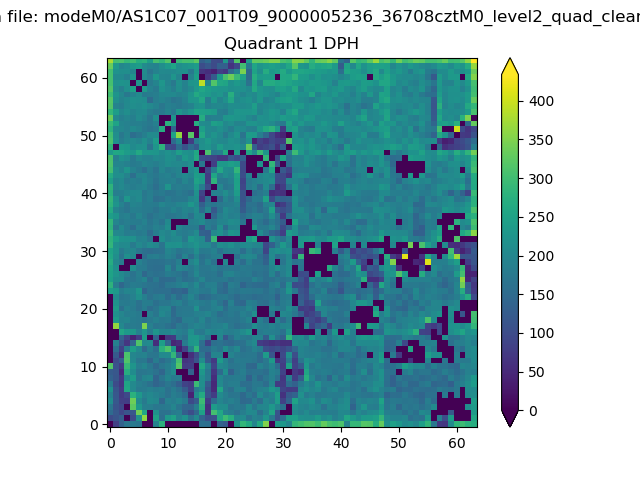 |
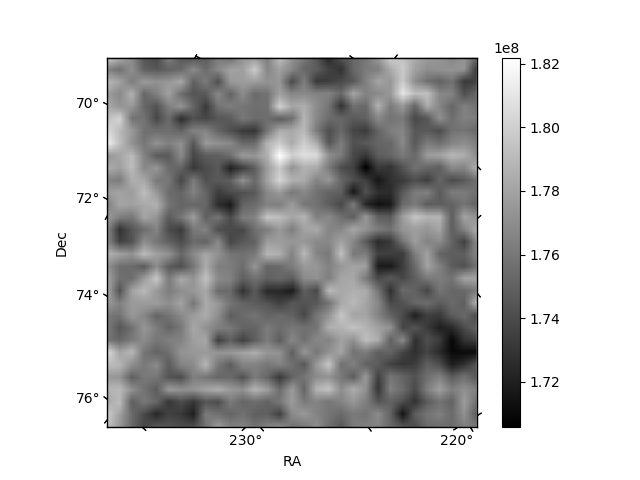
Quadrant B |
|---|---|---|---|
| Quadrant D | 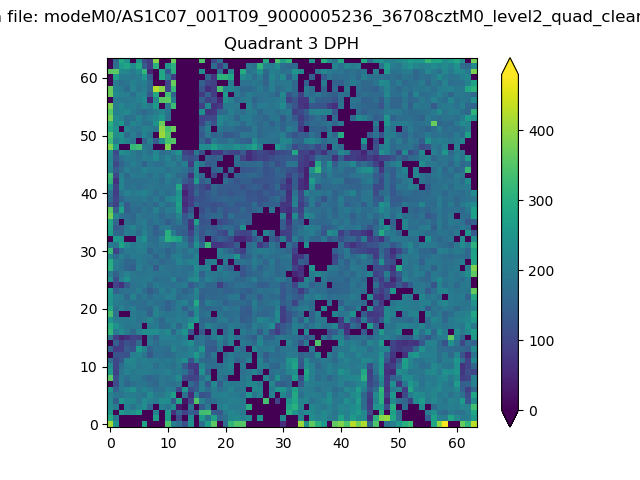 |
 |
Quadrant C |
| Plot type | Count rate plots | Images |
|---|---|---|
| Comparison with Poisson distribution Blue bars denote a histogram of data divided into 1 sec bins. Red curve is a Poisson curve with rate = median count rate of data. |
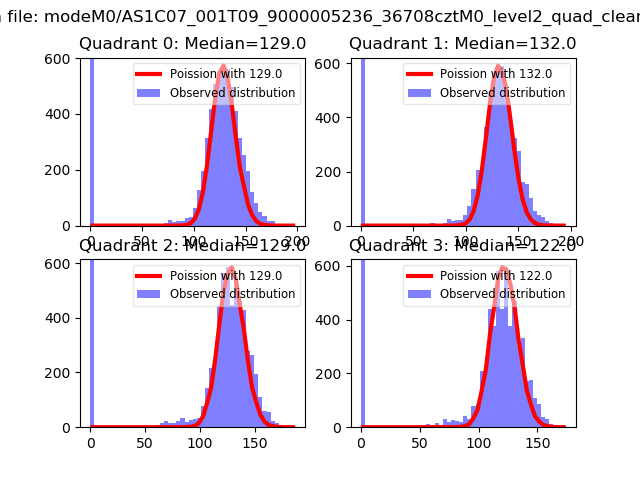 |
 |
| Quadrant-wise count rates Data is divided into 100 sec bins |
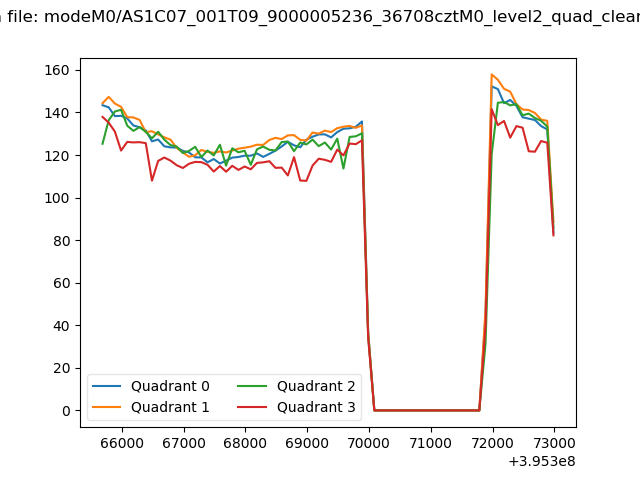 |
|
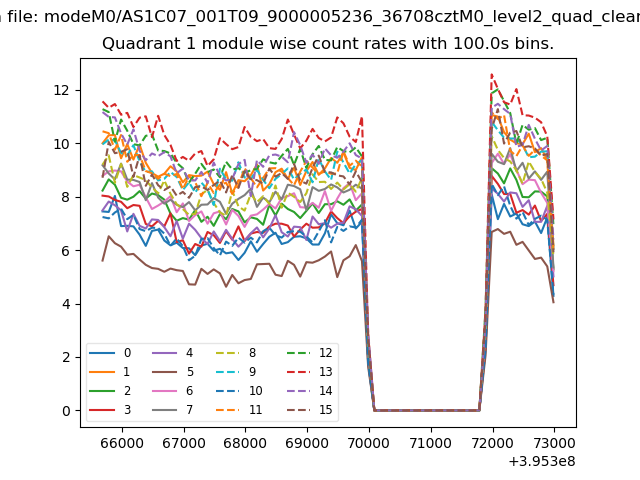
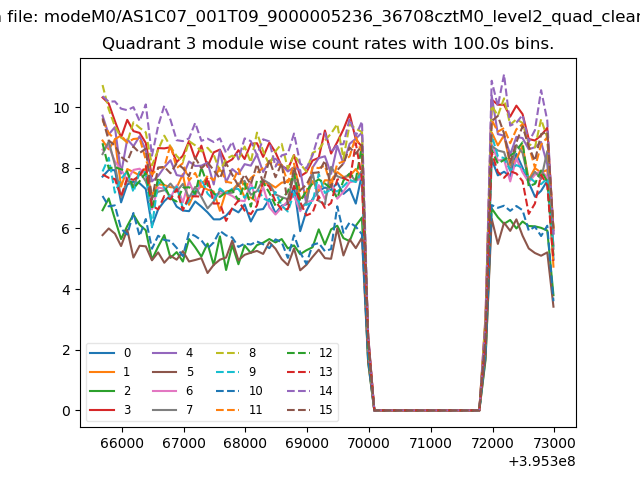
| Module-wise count rates for Quadrant A Data is divided into 100 sec bins |
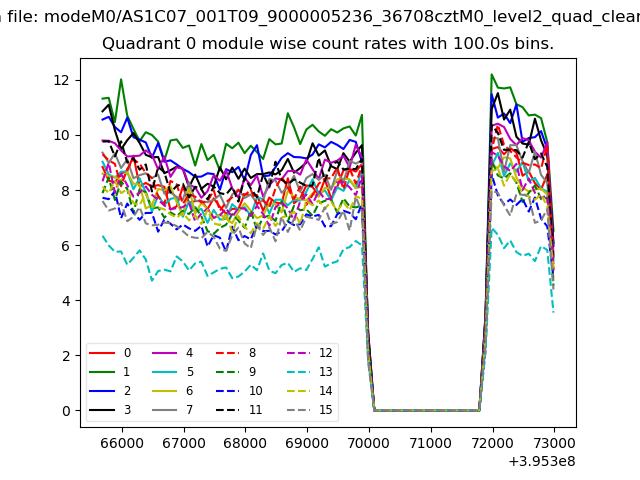 |
 |
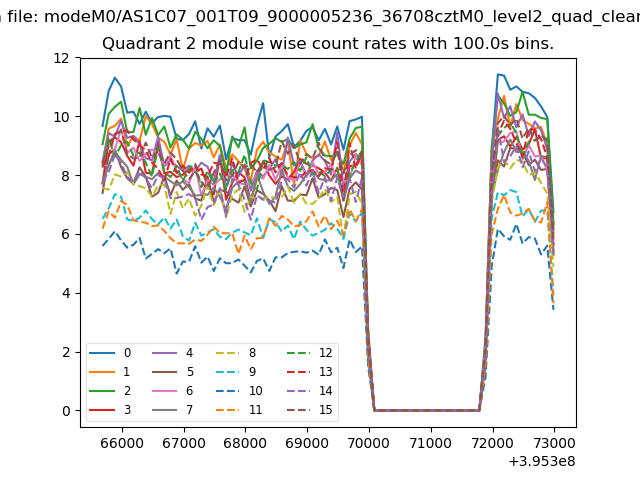
| Module-wise count rates for Quadrant B Data is divided into 100 sec bins |
 |
 |
| Module-wise count rates for Quadrant C Data is divided into 100 sec bins |
 |
 |
| Module-wise count rates for Quadrant D Data is divided into 100 sec bins |
 |
 |
| Parameter | Plot |
|---|---|
| CZT HV Monitor | 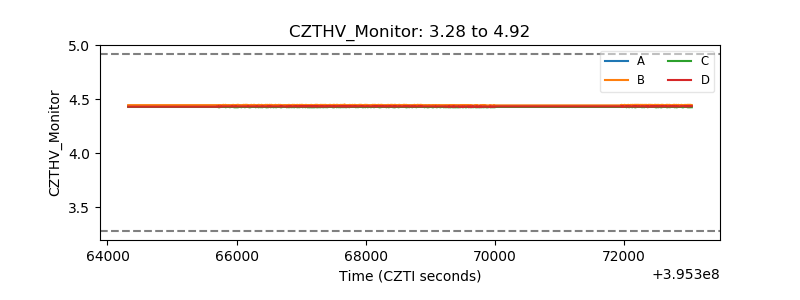 |
| D_VDD | 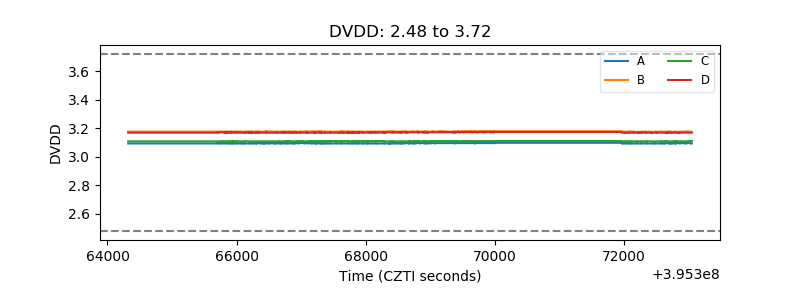 |
| Temperature 1 | 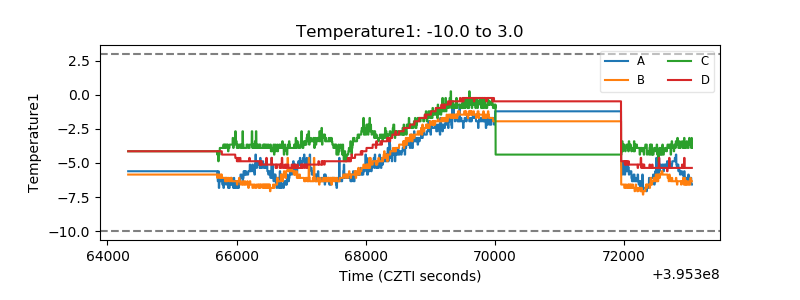 |
| Veto HV Monitor | 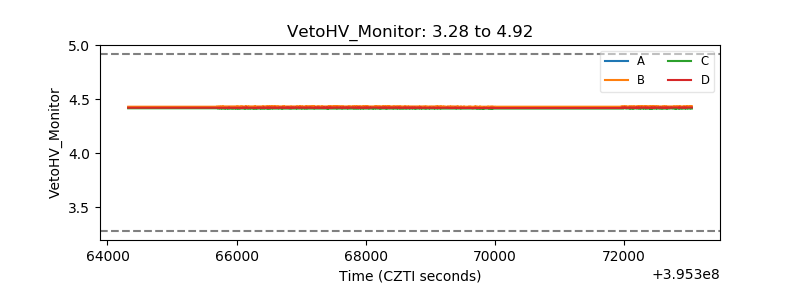 |
| Veto LLD | 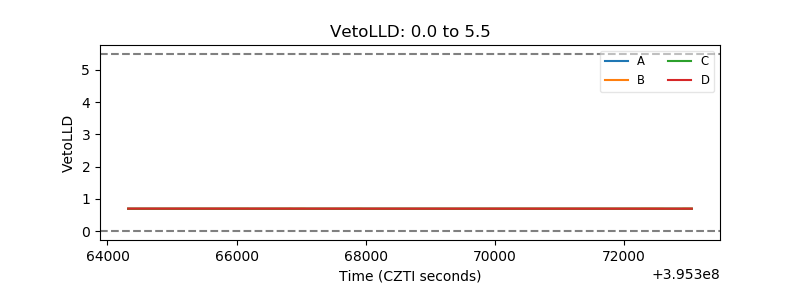 |
| Alpha Counter | 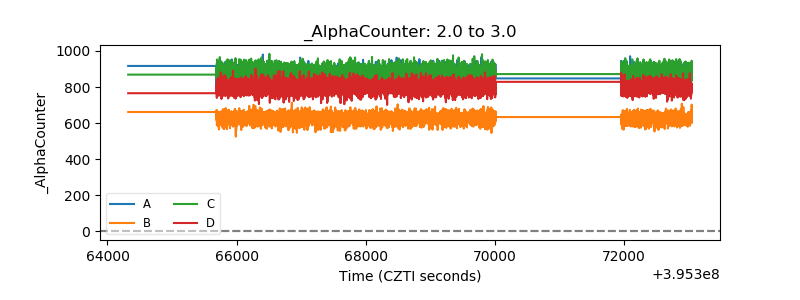 |
| _CPM_Rate | 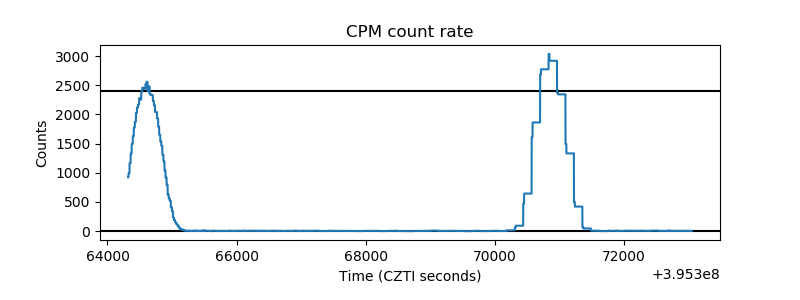 |
| CZT Counter | 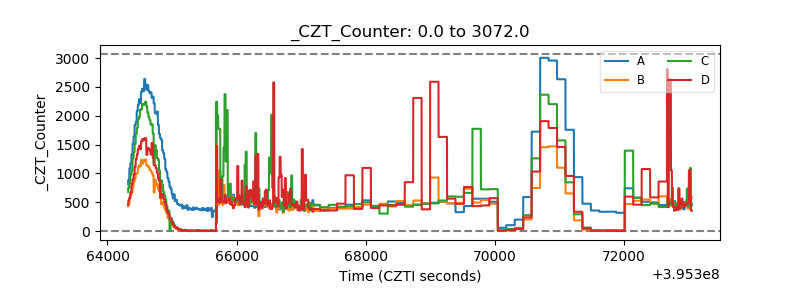 |
| +2.5 Volts monitor | 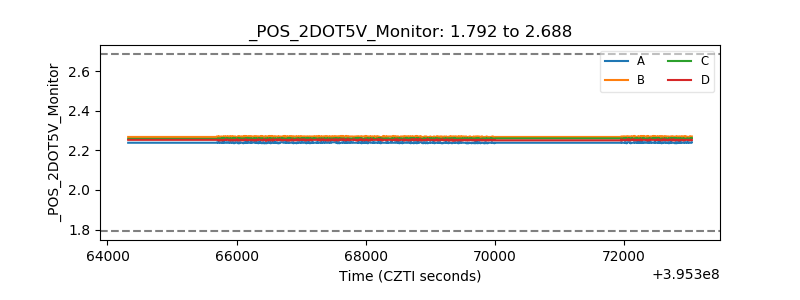 |
| +5 Volts monitor | 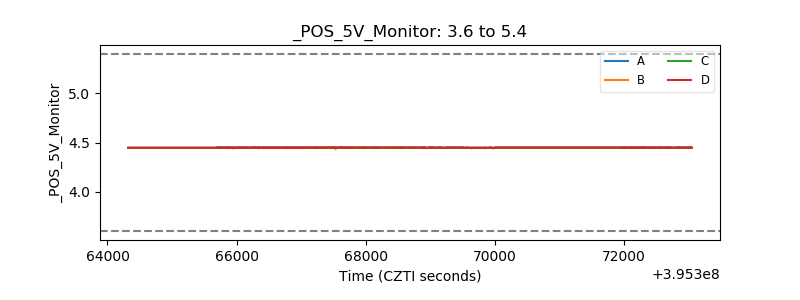 |
| _ROLL_ROT | 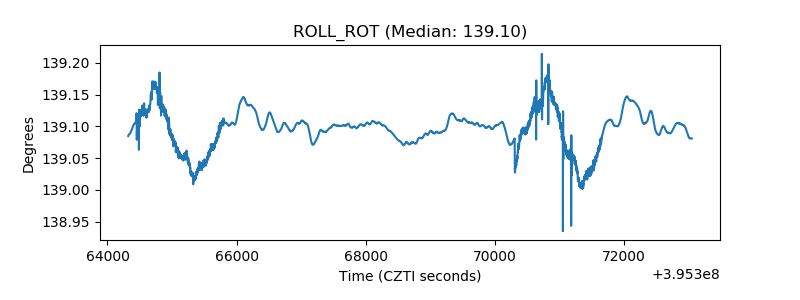 |
| _Roll_DEC | 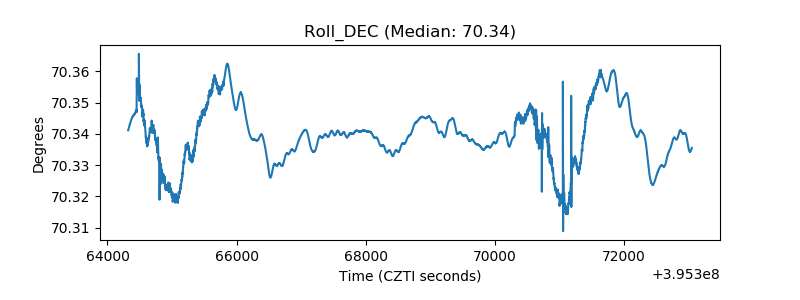 |
| _Roll_RA | 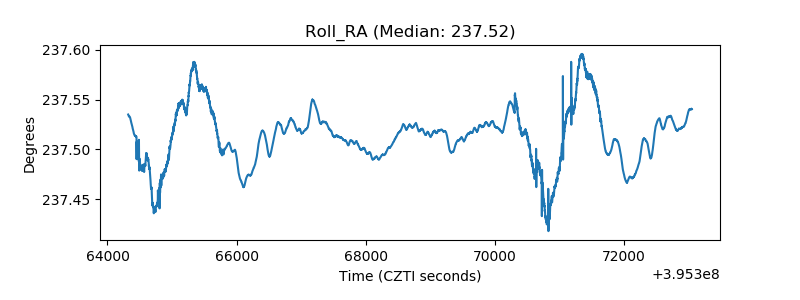 |
| Veto Counter | 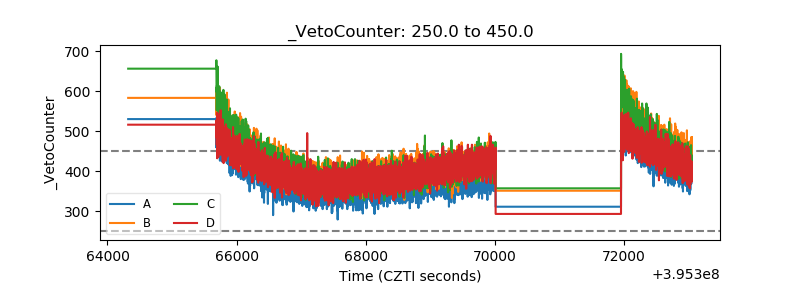 |