| Param | Original file | Final file |
|---|---|---|
| Filename | modeM0/AS1C07_001T09_9000005236_36710cztM0_level2.evt | modeM0/AS1C07_001T09_9000005236_36710cztM0_level2_quad_clean.evt |
| Size (bytes) | 408,435,840 | 100,474,560 |
| Size | 389.5 MB | 95.8 MB |
| Events in quadrant A | 2,641,975 | 687,563 |
| Events in quadrant B | 3,288,870 | 691,014 |
| Events in quadrant C | 3,183,973 | 665,695 |
| Events in quadrant D | 2,912,057 | 645,263 |
| Mode SS | |||
|---|---|---|---|
| Quadrant | BADHDUFLAG | Total packets | Discarded packets |
| A | 0 | 102 | 0 |
| B | 0 | 102 | 0 |
| C | 0 | 102 | 0 |
| D | 0 | 102 | 0 |
| Mode M9 | |||
|---|---|---|---|
| Quadrant | BADHDUFLAG | Total packets | Discarded packets |
| A | 0 | 31 | 0 |
| B | 0 | 31 | 0 |
| C | 0 | 31 | 0 |
| D | 0 | 32 | 0 |
| Mode M0 | |||
|---|---|---|---|
| Quadrant | BADHDUFLAG | Total packets | Discarded packets |
| A | 0 | 10910 | 3 |
| B | 0 | 13066 | 2 |
| C | 0 | 12489 | 2 |
| D | 0 | 12071 | 2 |
| Quadrant | Total seconds | Saturated seconds | Saturation percentage |
|---|---|---|---|
| A | 5044 | 41 | 0.812847% |
| B | 5044 | 172 | 3.409992% |
| C | 5044 | 189 | 3.747026% |
| D | 5044 | 73 | 1.447264% |
Noise dominated data is calculated using 1-second bins in cleaned event files. If a bin has >2000 counts, and if more than 50% of those come from <1% of pixels, then it is considered to be noise-dominated and hence unusable.
| Quadrant | # 1 sec bins | Bins with >0 counts | Bins with >2000 counts | High rate bins dominated by noise | Noise dominated (total time) | Noise dominated (detector-on time) | Marked lightcurve |
|---|---|---|---|---|---|---|---|
| A | 7166 | 5045 | 23 | 23 | 0.32% | 0.46% | 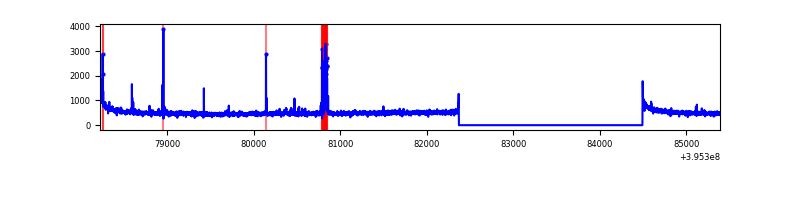 |
| B | 7166 | 5045 | 117 | 117 | 1.63% | 2.32% | 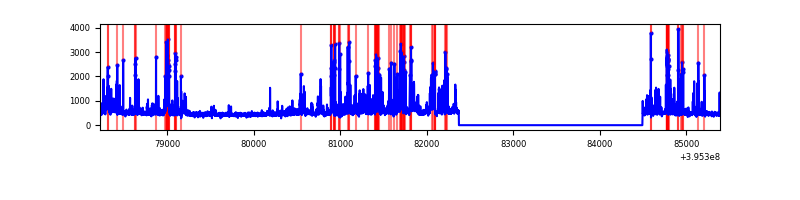 |
| C | 7166 | 5045 | 162 | 162 | 2.26% | 3.21% | 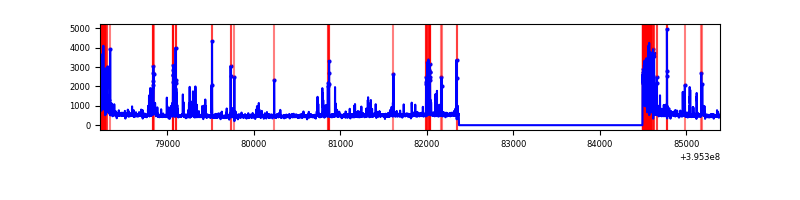 |
| D | 7166 | 5045 | 64 | 64 | 0.89% | 1.27% | 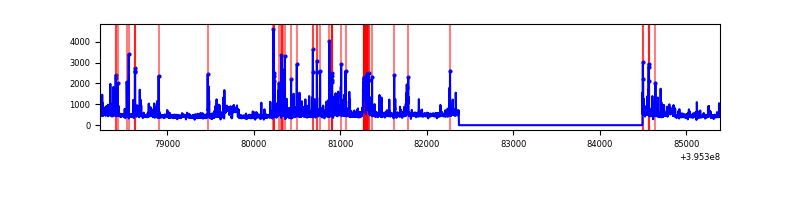 |
Top three noisy pixels from each quadrant. If the there are fewer than three noisy pixels in the level2.evt file, extra rows are filled as -1
| Pixel properties | Quadrant properties | ||||||
|---|---|---|---|---|---|---|---|
| Quadrant | DetID | PixID | Counts | Sigma | Mean | Median | Sigma |
| A | 10 | 83 | 210954 | 1788.34 | 592 | 582 | 117.6 |
| A | 9 | 143 | 88531 | 747.64 | 592 | 582 | 117.6 |
| A | 7 | 3 | 30420 | 253.65 | 592 | 582 | 117.6 |
| B | 5 | 255 | 444797 | 4033.95 | 584 | 568 | 110.1 |
| B | 4 | 171 | 428940 | 3889.95 | 584 | 568 | 110.1 |
| B | 5 | 172 | 32549 | 290.41 | 584 | 568 | 110.1 |
| C | 0 | 10 | 410684 | 3193.67 | 557 | 562 | 128.4 |
| C | 14 | 254 | 369556 | 2873.4 | 557 | 562 | 128.4 |
| C | 15 | 214 | 228528 | 1775.2 | 557 | 562 | 128.4 |
| D | 13 | 249 | 310070 | 2258.59 | 565 | 550 | 137.0 |
| D | 13 | 171 | 85949 | 623.16 | 565 | 550 | 137.0 |
| D | 2 | 153 | 84100 | 609.67 | 565 | 550 | 137.0 |
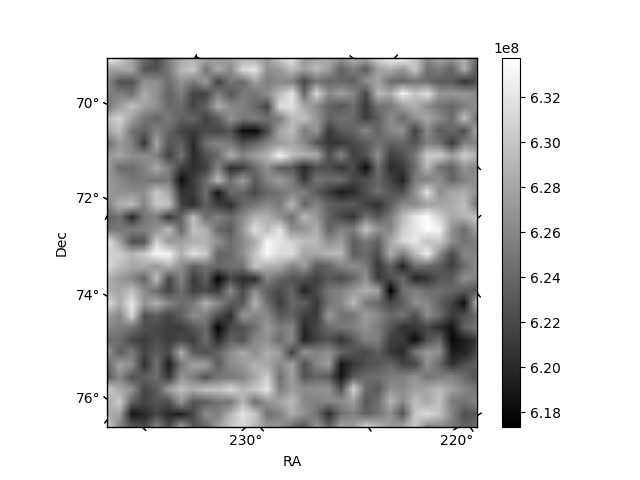
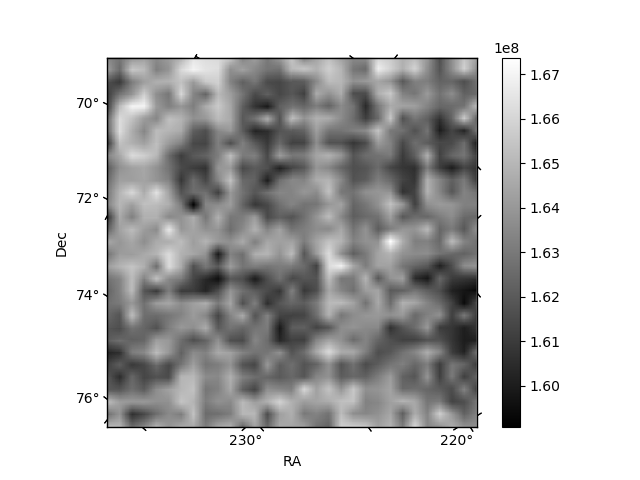
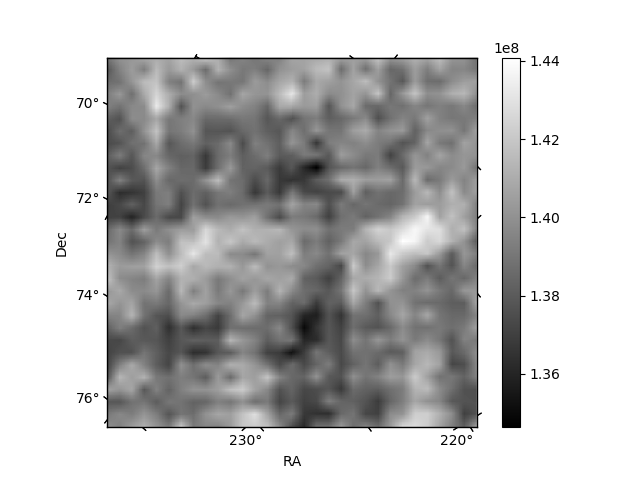
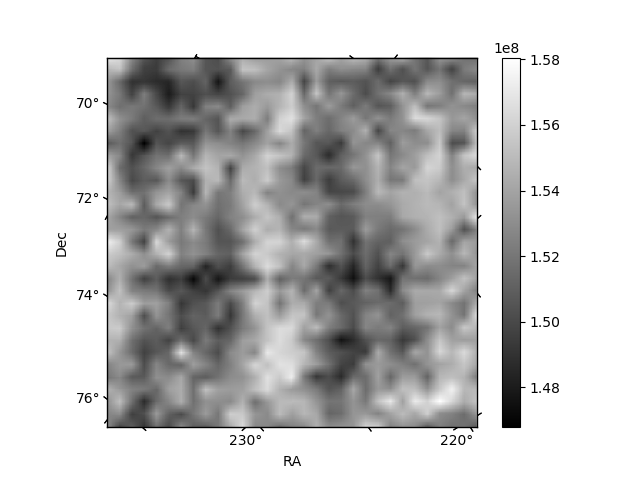
Histogram calculated using DETX and DETY for each event in the final _common_clean file
| Quadrant A | 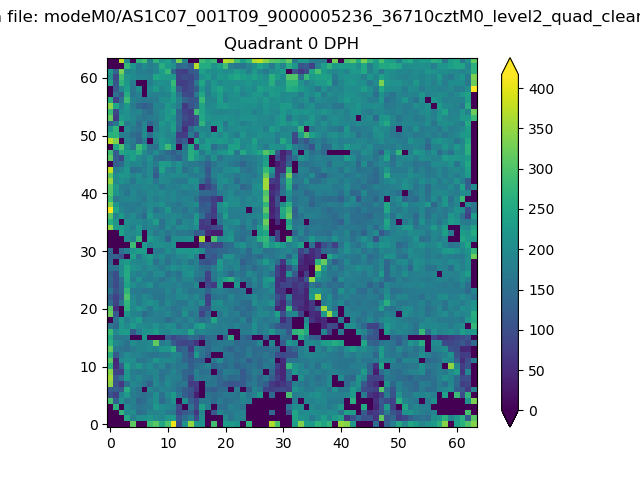 |
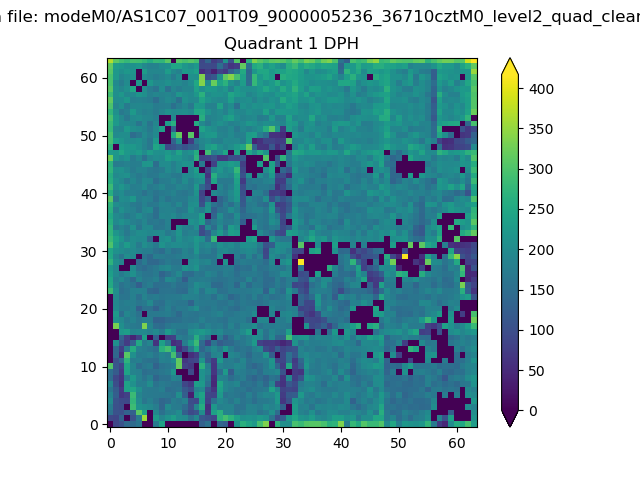 |
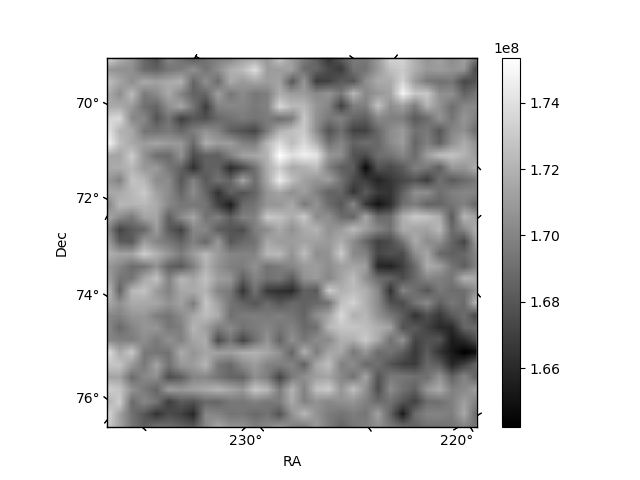
Quadrant B |
|---|---|---|---|
| Quadrant D | 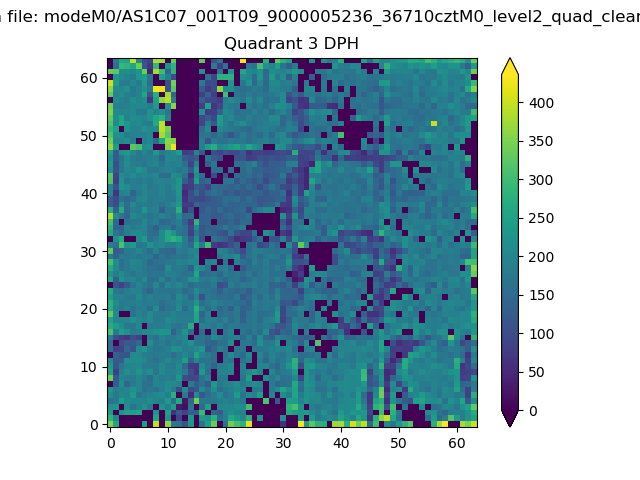 |
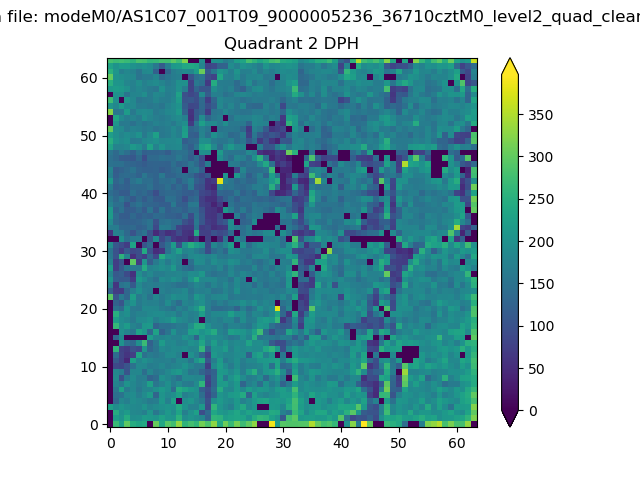 |
Quadrant C |
| Plot type | Count rate plots | Images |
|---|---|---|
| Comparison with Poisson distribution Blue bars denote a histogram of data divided into 1 sec bins. Red curve is a Poisson curve with rate = median count rate of data. |
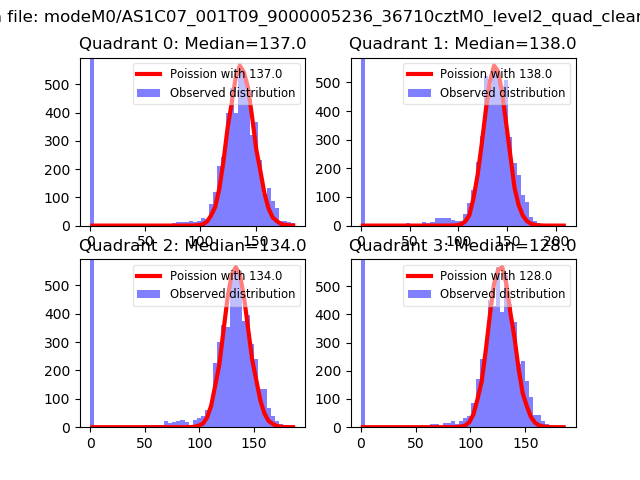 |
 |
| Quadrant-wise count rates Data is divided into 100 sec bins |
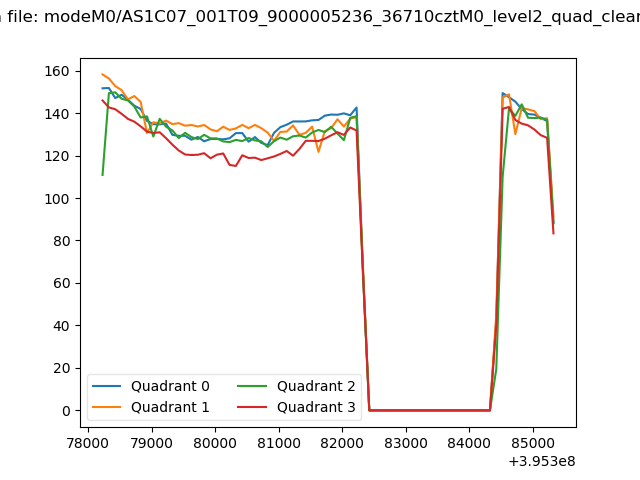 |
|
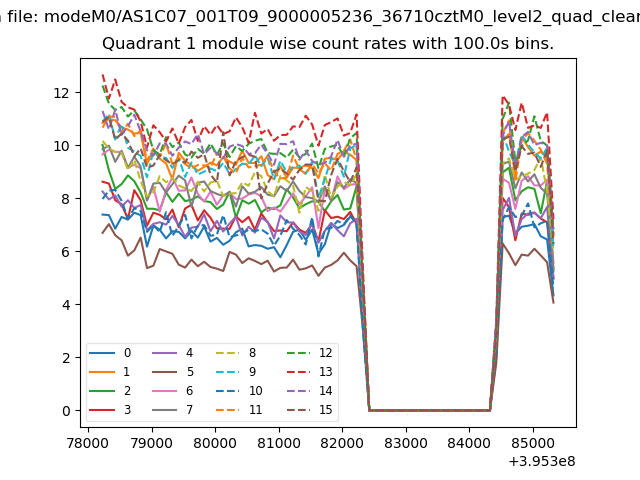
| Module-wise count rates for Quadrant A Data is divided into 100 sec bins |
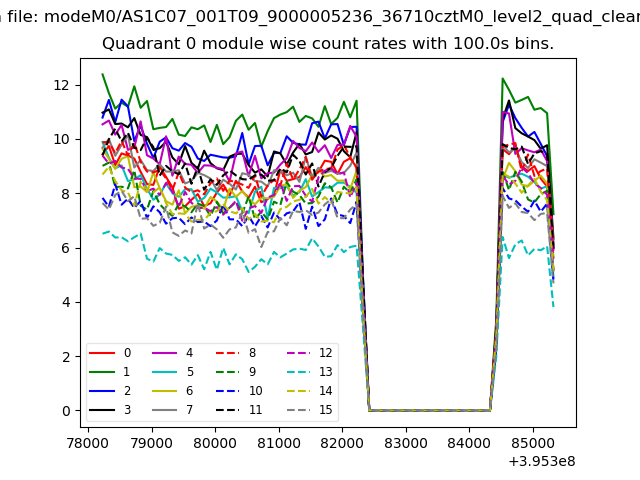 |
 |
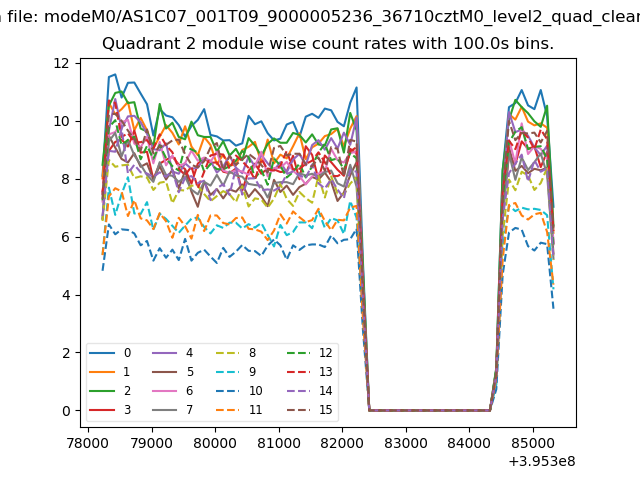
| Module-wise count rates for Quadrant B Data is divided into 100 sec bins |
 |
 |
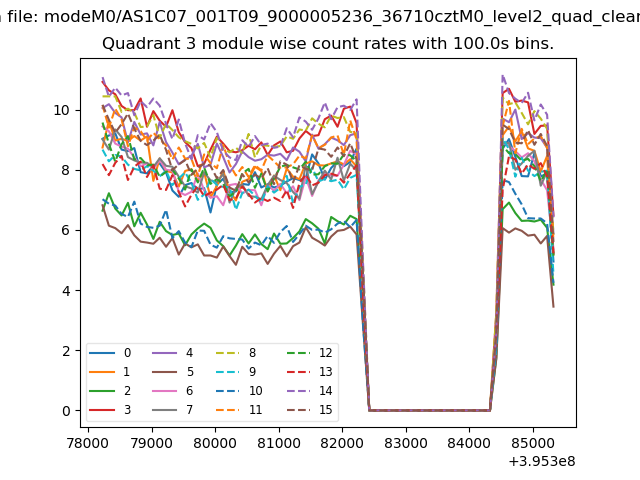
| Module-wise count rates for Quadrant C Data is divided into 100 sec bins |
 |
 |
| Module-wise count rates for Quadrant D Data is divided into 100 sec bins |
 |
 |
| Parameter | Plot |
|---|---|
| CZT HV Monitor | 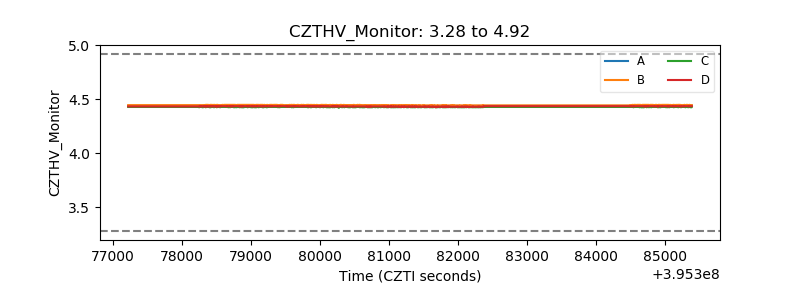 |
| D_VDD | 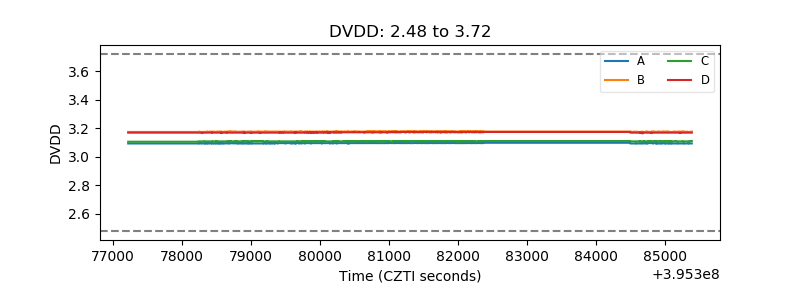 |
| Temperature 1 |  |
| Veto HV Monitor | 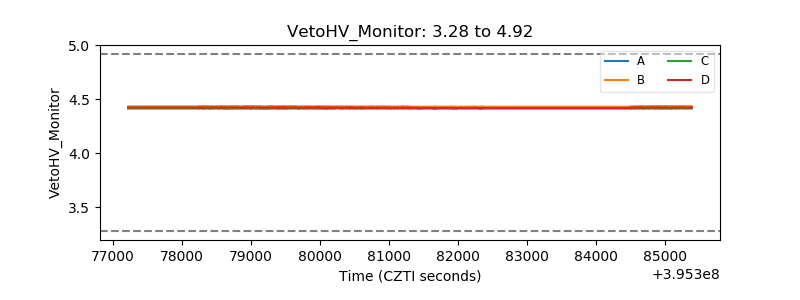 |
| Veto LLD | 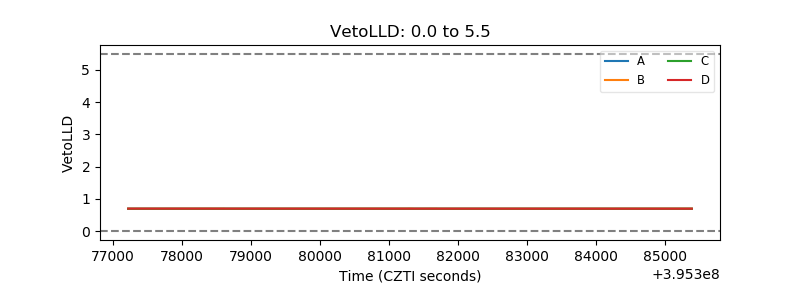 |
| Alpha Counter | 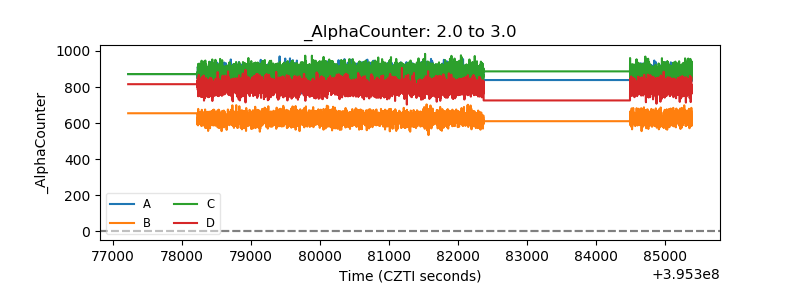 |
| _CPM_Rate | 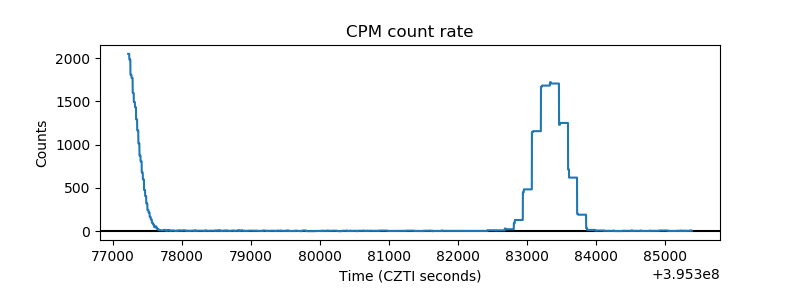 |
| CZT Counter | 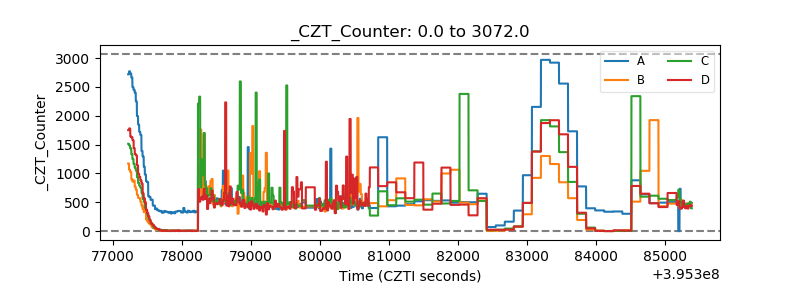 |
| +2.5 Volts monitor |  |
| +5 Volts monitor |  |
| _ROLL_ROT | 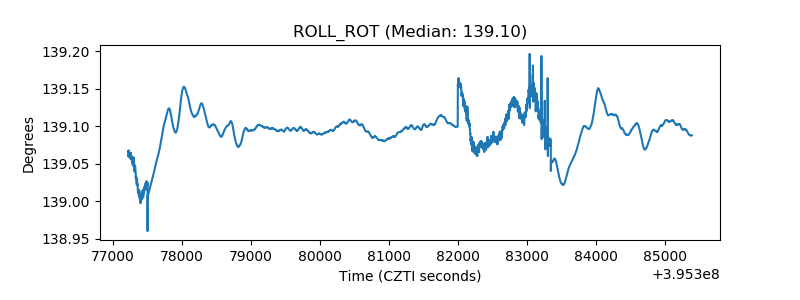 |
| _Roll_DEC |  |
| _Roll_RA | 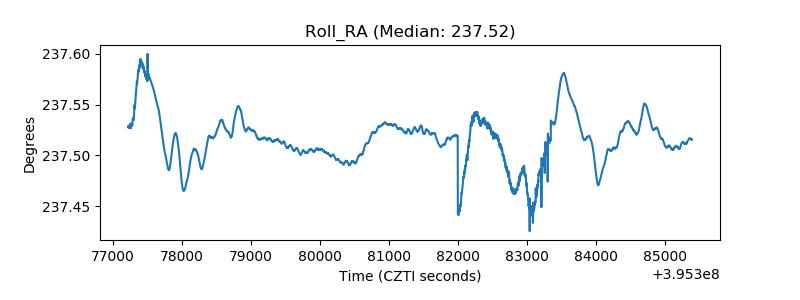 |
| Veto Counter | 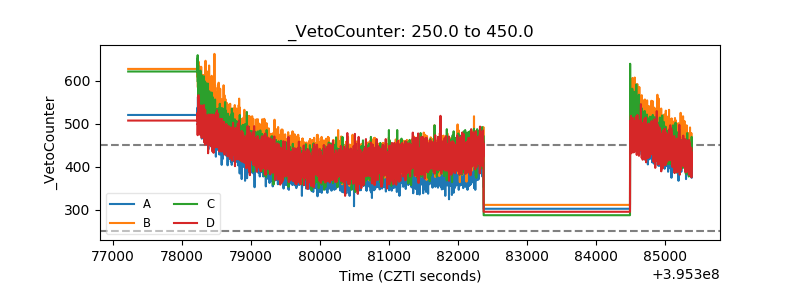 |