| Param | Original file | Final file |
|---|---|---|
| Filename | modeM0/AS1C07_001T09_9000005236_36711cztM0_level2.evt | modeM0/AS1C07_001T09_9000005236_36711cztM0_level2_quad_clean.evt |
| Size (bytes) | 376,692,480 | 95,411,520 |
| Size | 359.2 MB | 91.0 MB |
| Events in quadrant A | 2,444,205 | 654,371 |
| Events in quadrant B | 2,732,266 | 659,371 |
| Events in quadrant C | 3,194,043 | 624,565 |
| Events in quadrant D | 2,705,635 | 608,920 |
| Mode SS | |||
|---|---|---|---|
| Quadrant | BADHDUFLAG | Total packets | Discarded packets |
| A | 0 | 100 | 0 |
| B | 0 | 100 | 0 |
| C | 0 | 100 | 0 |
| D | 0 | 100 | 0 |
| Mode M9 | |||
|---|---|---|---|
| Quadrant | BADHDUFLAG | Total packets | Discarded packets |
| A | 0 | 22 | 0 |
| B | 0 | 22 | 0 |
| C | 0 | 22 | 0 |
| D | 0 | 22 | 0 |
| Mode M0 | |||
|---|---|---|---|
| Quadrant | BADHDUFLAG | Total packets | Discarded packets |
| A | 0 | 10236 | 3 |
| B | 0 | 11202 | 2 |
| C | 0 | 12446 | 2 |
| D | 0 | 11389 | 2 |
| Quadrant | Total seconds | Saturated seconds | Saturation percentage |
|---|---|---|---|
| A | 4876 | 7 | 0.143560% |
| B | 4876 | 71 | 1.456112% |
| C | 4876 | 210 | 4.306809% |
| D | 4877 | 83 | 1.701866% |
Noise dominated data is calculated using 1-second bins in cleaned event files. If a bin has >2000 counts, and if more than 50% of those come from <1% of pixels, then it is considered to be noise-dominated and hence unusable.
| Quadrant | # 1 sec bins | Bins with >0 counts | Bins with >2000 counts | High rate bins dominated by noise | Noise dominated (total time) | Noise dominated (detector-on time) | Marked lightcurve |
|---|---|---|---|---|---|---|---|
| A | 7029 | 4877 | 0 | 0 | 0.00% | 0.00% | 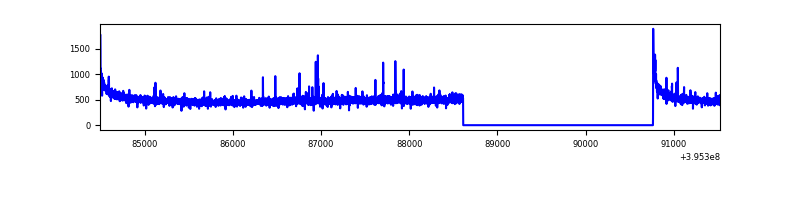 |
| B | 7029 | 4877 | 45 | 45 | 0.64% | 0.92% | 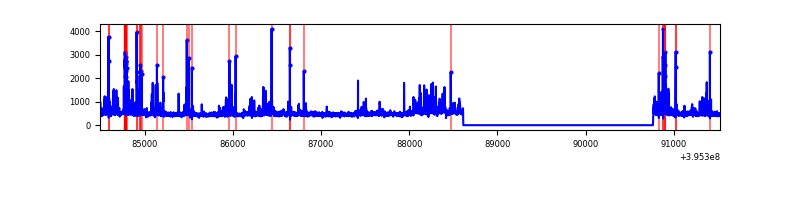 |
| C | 7029 | 4877 | 183 | 183 | 2.60% | 3.75% | 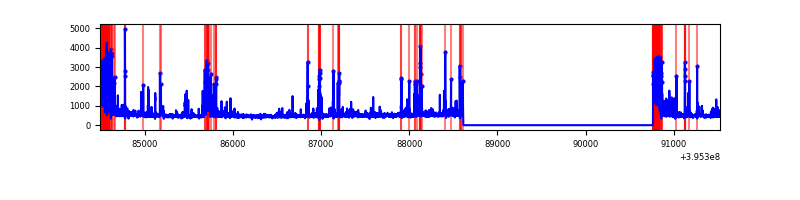 |
| D | 7030 | 4878 | 75 | 75 | 1.07% | 1.54% | 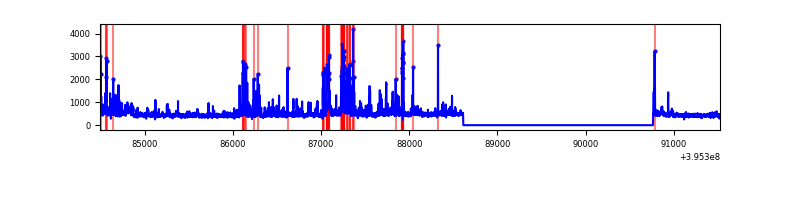 |
Top three noisy pixels from each quadrant. If the there are fewer than three noisy pixels in the level2.evt file, extra rows are filled as -1
| Pixel properties | Quadrant properties | ||||||
|---|---|---|---|---|---|---|---|
| Quadrant | DetID | PixID | Counts | Sigma | Mean | Median | Sigma |
| A | 10 | 83 | 205046 | 1784.6 | 570 | 560 | 114.6 |
| A | 9 | 143 | 15331 | 128.91 | 570 | 560 | 114.6 |
| A | 13 | 254 | 8176 | 66.47 | 570 | 560 | 114.6 |
| B | 5 | 255 | 299563 | 2836.82 | 560 | 546 | 105.4 |
| B | 0 | 221 | 126780 | 1197.6 | 560 | 546 | 105.4 |
| B | 0 | 189 | 22811 | 211.23 | 560 | 546 | 105.4 |
| C | 0 | 10 | 459825 | 3743.54 | 531 | 534 | 122.7 |
| C | 14 | 254 | 435336 | 3543.93 | 531 | 534 | 122.7 |
| C | 15 | 214 | 222819 | 1811.78 | 531 | 534 | 122.7 |
| D | 13 | 249 | 159243 | 1194.01 | 544 | 527 | 132.9 |
| D | 12 | 233 | 108365 | 811.26 | 544 | 527 | 132.9 |
| D | 13 | 171 | 83468 | 623.96 | 544 | 527 | 132.9 |
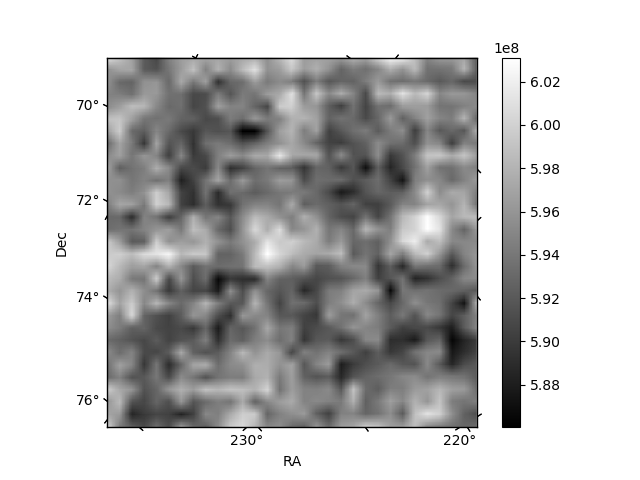
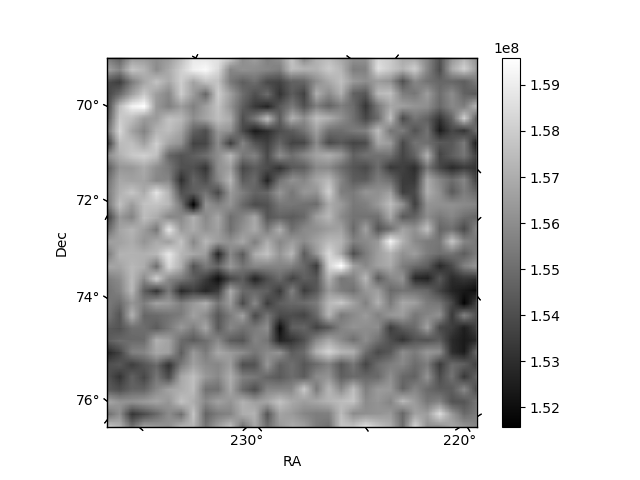
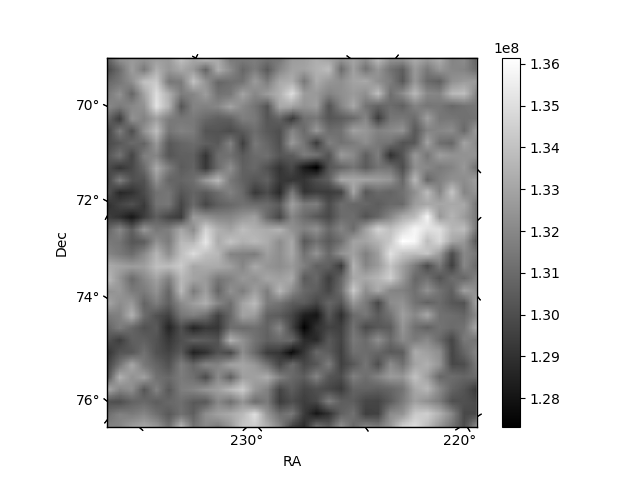
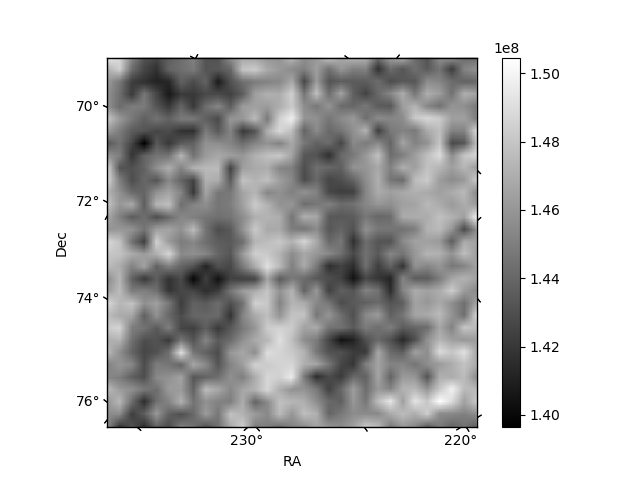
Histogram calculated using DETX and DETY for each event in the final _common_clean file
| Quadrant A | 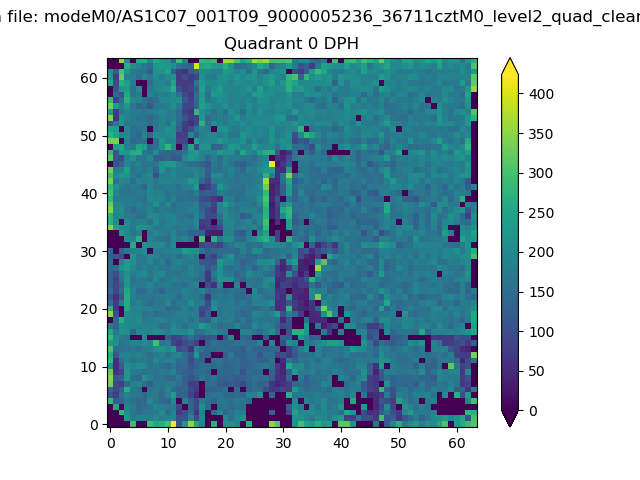 |
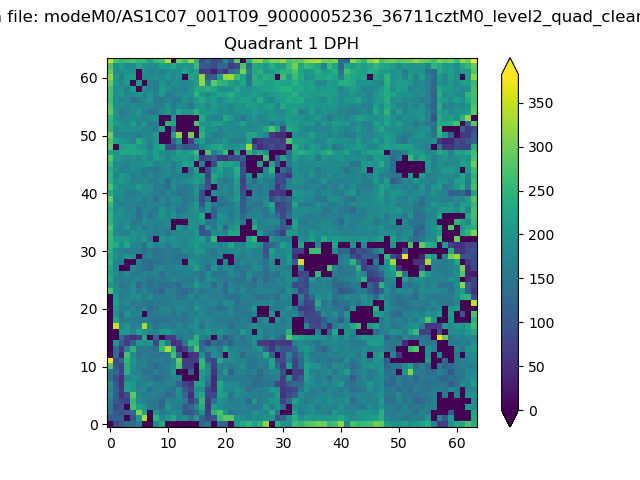 |
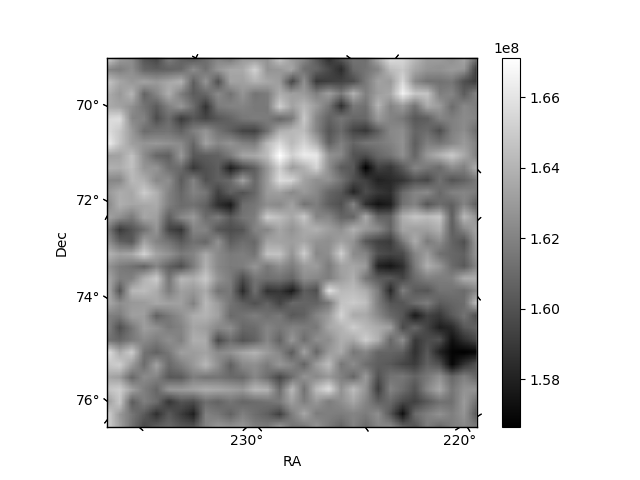
Quadrant B |
|---|---|---|---|
| Quadrant D | 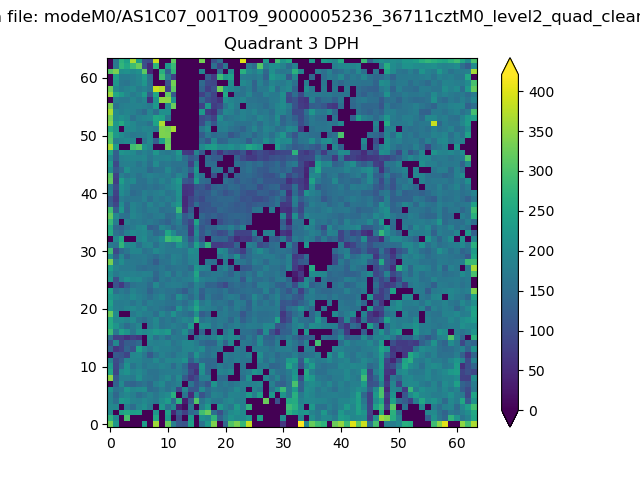 |
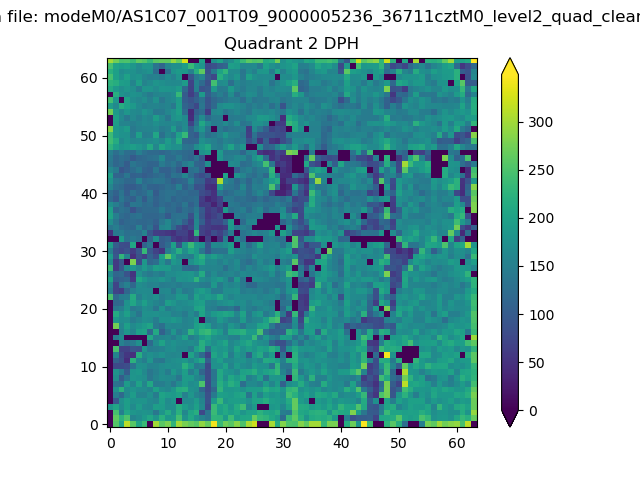 |
Quadrant C |
| Plot type | Count rate plots | Images |
|---|---|---|
| Comparison with Poisson distribution Blue bars denote a histogram of data divided into 1 sec bins. Red curve is a Poisson curve with rate = median count rate of data. |
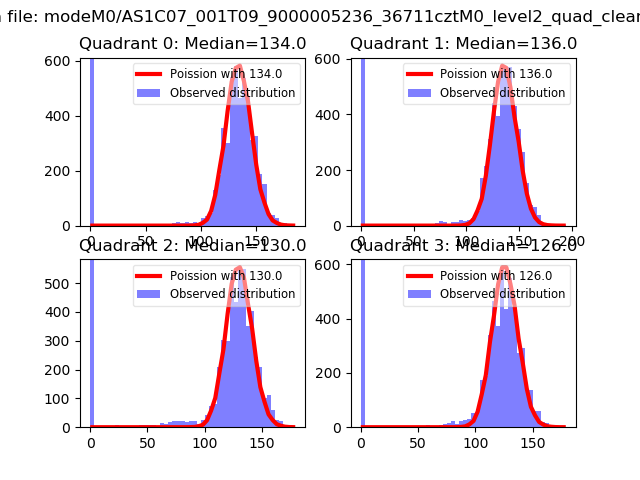 |
 |
| Quadrant-wise count rates Data is divided into 100 sec bins |
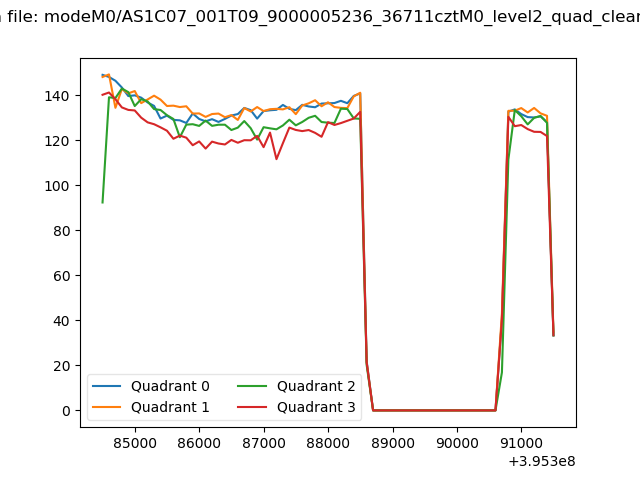 |
|
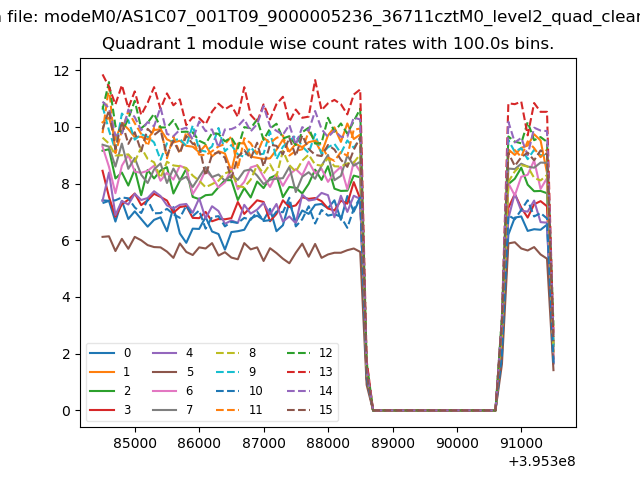
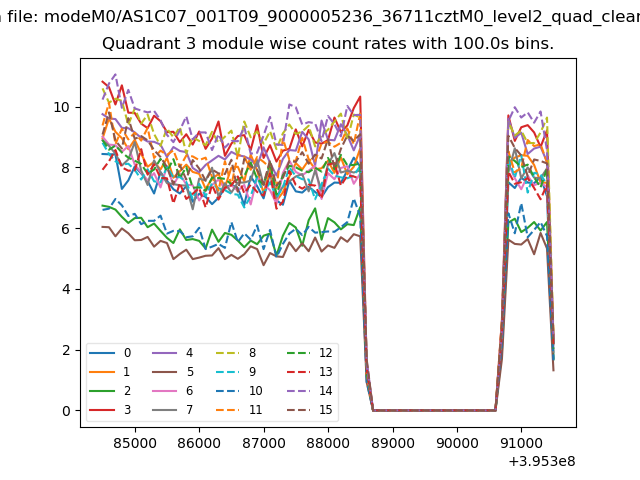
| Module-wise count rates for Quadrant A Data is divided into 100 sec bins |
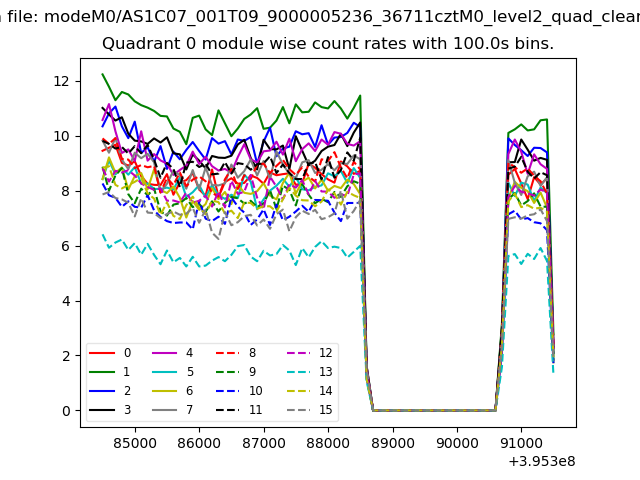 |
 |
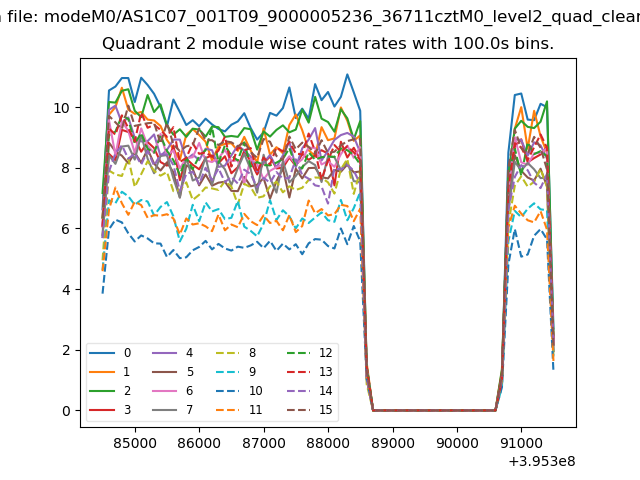
| Module-wise count rates for Quadrant B Data is divided into 100 sec bins |
 |
 |
| Module-wise count rates for Quadrant C Data is divided into 100 sec bins |
 |
 |
| Module-wise count rates for Quadrant D Data is divided into 100 sec bins |
 |
 |
| Parameter | Plot |
|---|---|
| CZT HV Monitor | 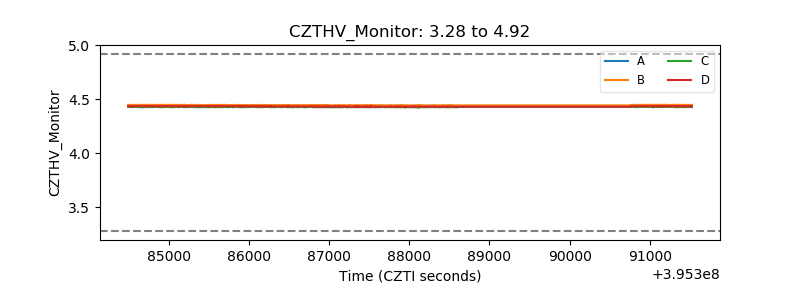 |
| D_VDD | 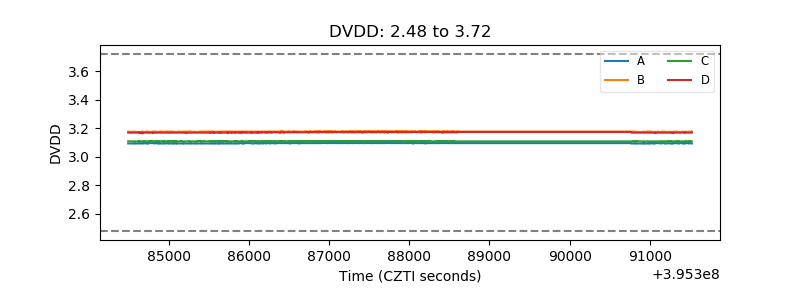 |
| Temperature 1 |  |
| Veto HV Monitor | 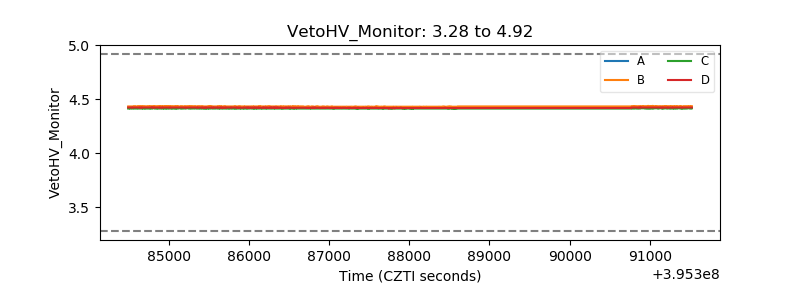 |
| Veto LLD | 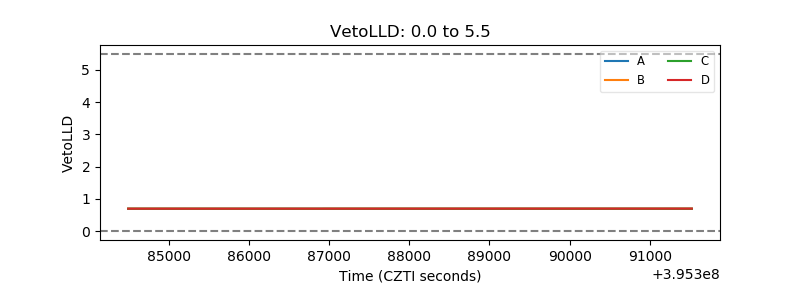 |
| Alpha Counter | 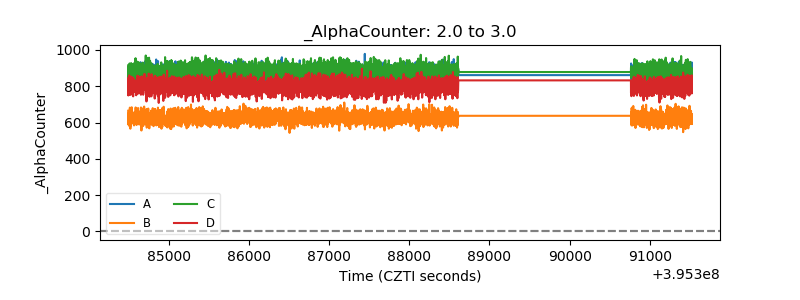 |
| _CPM_Rate | 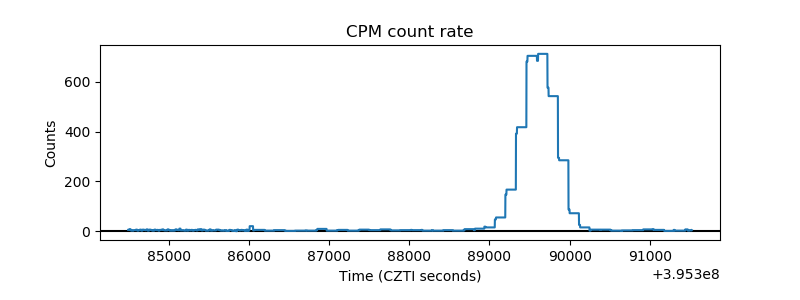 |
| CZT Counter | 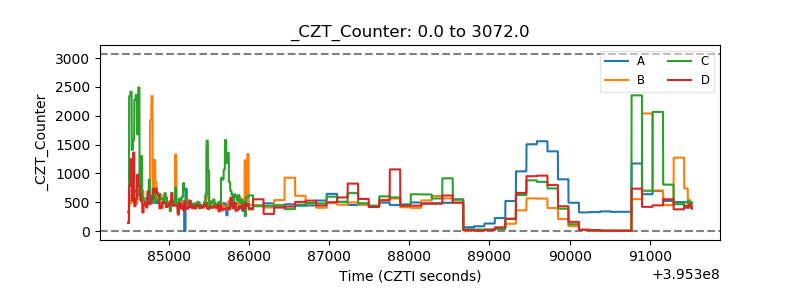 |
| +2.5 Volts monitor |  |
| +5 Volts monitor |  |
| _ROLL_ROT | 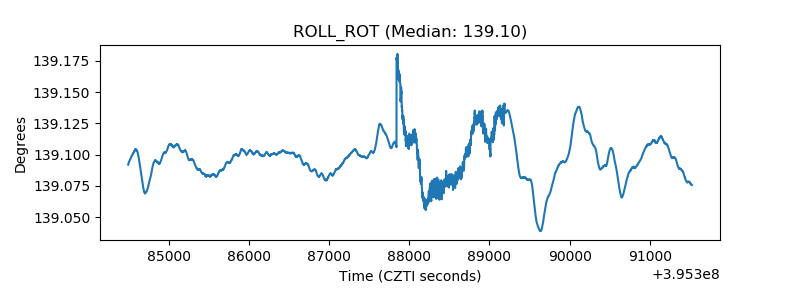 |
| _Roll_DEC | 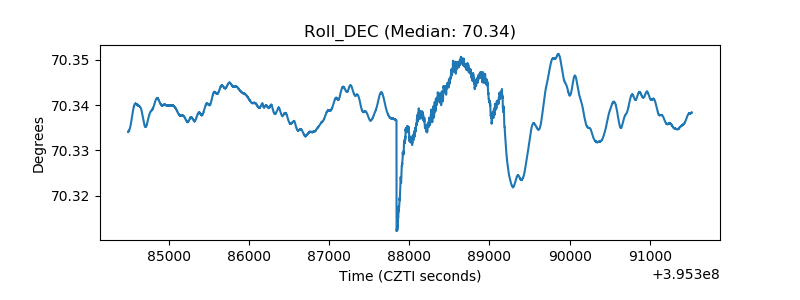 |
| _Roll_RA | 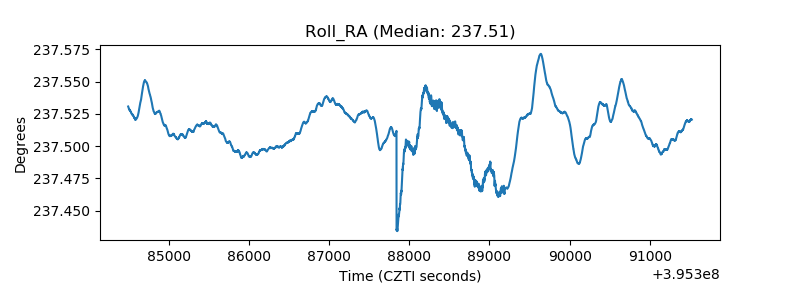 |
| Veto Counter | 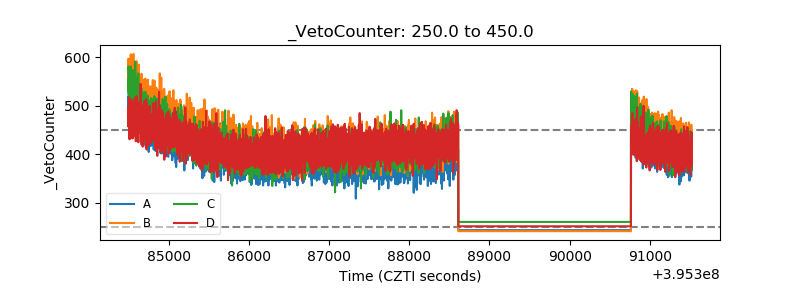 |