| Param | Original file | Final file |
|---|---|---|
| Filename | modeM0/AS1A11_101T01_9000005238cztM0_level2.fits | modeM0/AS1A11_101T01_9000005238cztM0_level2_quad_clean.evt |
| Size (bytes) | 1,920,055,680 | 2,025,342,720 |
| Size | 1.8 GB | 1.9 GB |
| Events in quadrant A | 12,103,543 | 13,037,900 |
| Events in quadrant B | 9,539,330 | 10,523,930 |
| Events in quadrant C | 11,691,270 | 12,138,542 |
| Events in quadrant D | 9,937,170 | 10,789,877 |
| Mode M0 | |||
|---|---|---|---|
| Quadrant | BADHDUFLAG | Total packets | Discarded packets |
| A | 0 | 449770 | 0 |
| B | 0 | 678724 | 0 |
| C | 0 | 522189 | 0 |
| D | 0 | 606329 | 0 |
| Mode SS | |||
|---|---|---|---|
| Quadrant | BADHDUFLAG | Total packets | Discarded packets |
| A | 0 | 4446 | 0 |
| B | 0 | 4440 | 0 |
| C | 0 | 4450 | 0 |
| D | 0 | 4443 | 0 |
| Mode M9 | |||
|---|---|---|---|
| Quadrant | BADHDUFLAG | Total packets | Discarded packets |
| A | 0 | 808 | 0 |
| B | 0 | 811 | 0 |
| C | 0 | 807 | 0 |
| D | 0 | 809 | 0 |
| Quadrant | Total seconds | Saturated seconds | Saturation percentage |
|---|---|---|---|
| A | 216846 | 396 | 0.182618% |
| B | 216549 | 43413 | 20.047657% |
| C | 216830 | 6208 | 2.863072% |
| D | 216806 | 13384 | 6.173261% |
Noise dominated data is calculated using 1-second bins in cleaned event files. If a bin has >2000 counts, and if more than 50% of those come from <1% of pixels, then it is considered to be noise-dominated and hence unusable.
| Quadrant | # 1 sec bins | Bins with >0 counts | Bins with >2000 counts | High rate bins dominated by noise | Noise dominated (total time) | Noise dominated (detector-on time) | Marked lightcurve |
|---|---|---|---|---|---|---|---|
| A | 304433 | 217274 | 0 | 0 | 0.00% | 0.00% |  |
| B | 304430 | 191240 | 0 | 0 | 0.00% | 0.00% | 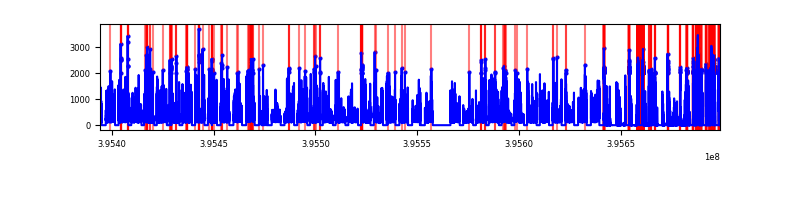 |
| C | 304433 | 217030 | 0 | 0 | 0.00% | 0.00% | 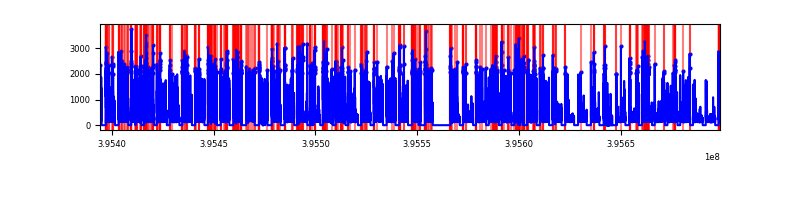 |
| D | 304433 | 217032 | 0 | 0 | 0.00% | 0.00% | 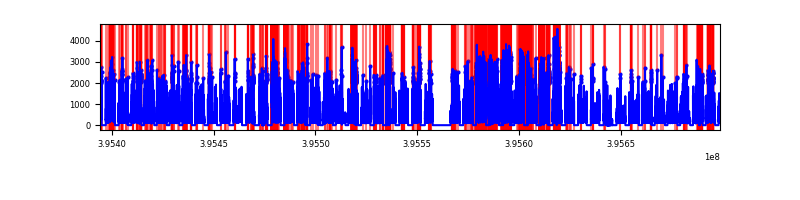 |
Top three noisy pixels from each quadrant. If the there are fewer than three noisy pixels in the level2.evt file, extra rows are filled as -1
| Pixel properties | Quadrant properties | ||||||
|---|---|---|---|---|---|---|---|
| Quadrant | DetID | PixID | Counts | Sigma | Mean | Median | Sigma |
| A | 7 | 110 | 9830 | 8.71 | 3163 | 2959 | 789.1 |
| A | 9 | 19 | 9829 | 8.71 | 3163 | 2959 | 789.1 |
| A | 0 | 29 | 9683 | 8.52 | 3163 | 2959 | 789.1 |
| B | 2 | 9 | 8156 | 11.63 | 2530 | 2414 | 493.8 |
| B | 3 | 80 | 7650 | 10.6 | 2530 | 2414 | 493.8 |
| B | 5 | 128 | 6646 | 8.57 | 2530 | 2414 | 493.8 |
| C | 1 | 81 | 9688 | 8.66 | 3088 | 2893 | 784.9 |
| C | 1 | 80 | 9369 | 8.25 | 3088 | 2893 | 784.9 |
| C | 3 | 202 | 9066 | 7.86 | 3088 | 2893 | 784.9 |
| D | 7 | 3 | 7369 | 6.33 | 2850 | 2596 | 753.9 |
| D | 10 | 113 | 7267 | 6.2 | 2850 | 2596 | 753.9 |
| D | 10 | 189 | 7202 | 6.11 | 2850 | 2596 | 753.9 |
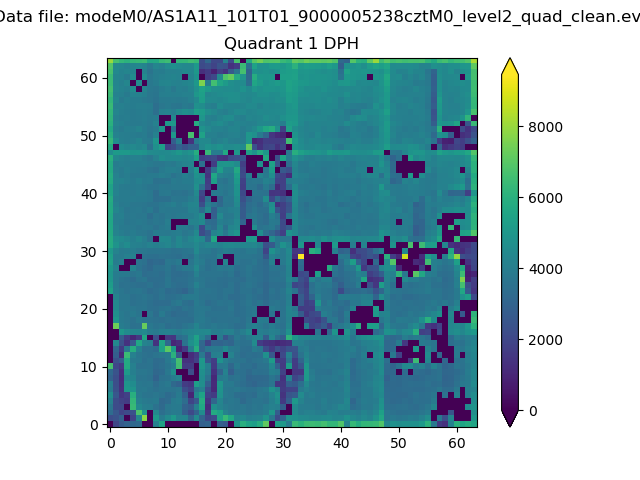
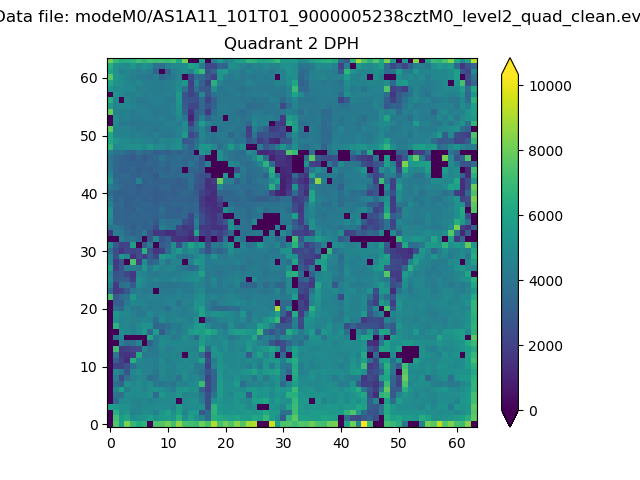
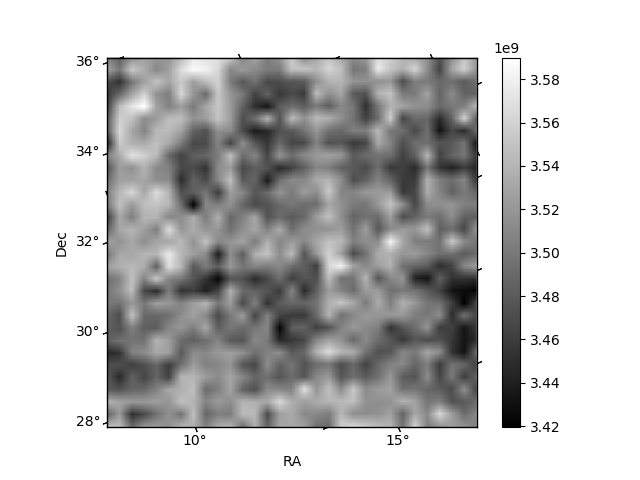
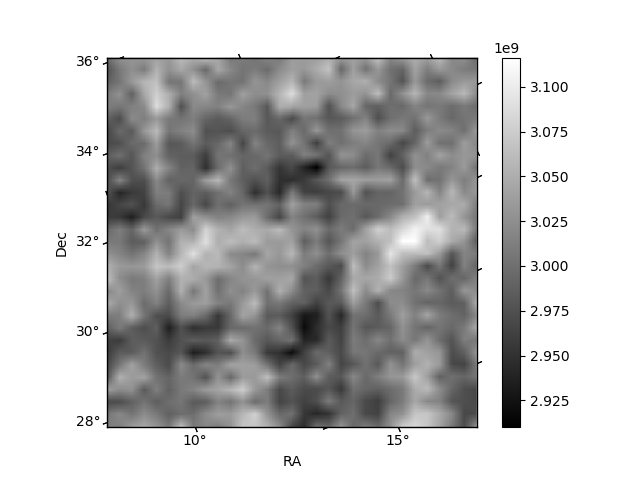
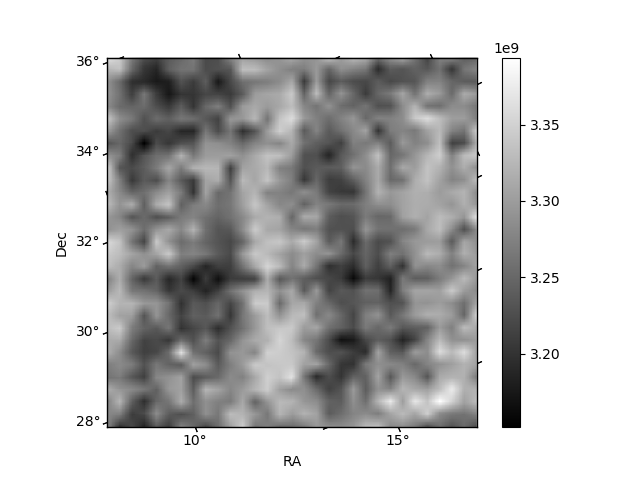
Histogram calculated using DETX and DETY for each event in the final _common_clean file
| Quadrant A | 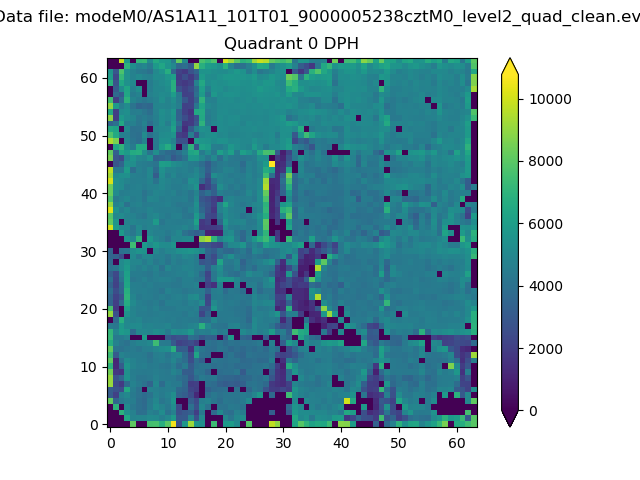 |
 |
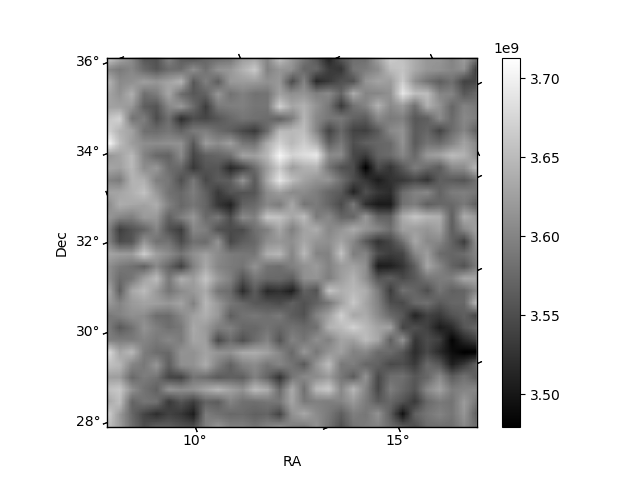
Quadrant B |
|---|---|---|---|
| Quadrant D | 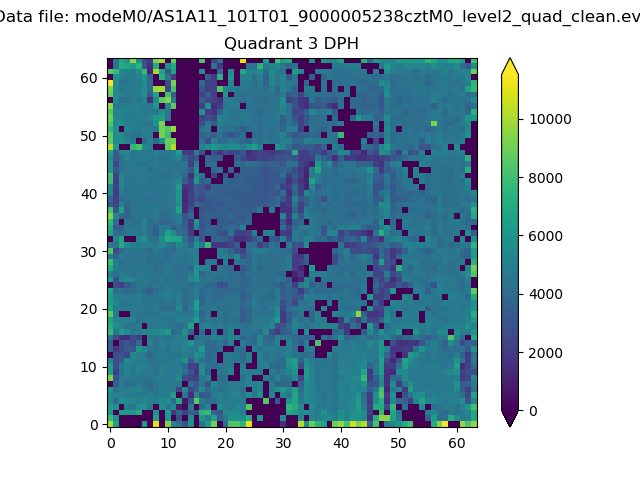 |
 |
Quadrant C |
| Plot type | Count rate plots | Images |
|---|---|---|
| Comparison with Poisson distribution Blue bars denote a histogram of data divided into 1 sec bins. Red curve is a Poisson curve with rate = median count rate of data. |
 |
 |
| Quadrant-wise count rates Data is divided into 100 sec bins |
 |
|
| Module-wise count rates for Quadrant A Data is divided into 100 sec bins |
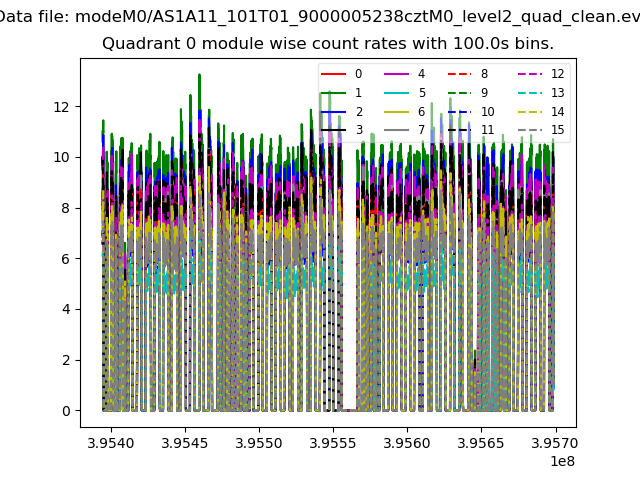 |
 |
| Module-wise count rates for Quadrant B Data is divided into 100 sec bins |
 |
 |
| Module-wise count rates for Quadrant C Data is divided into 100 sec bins |
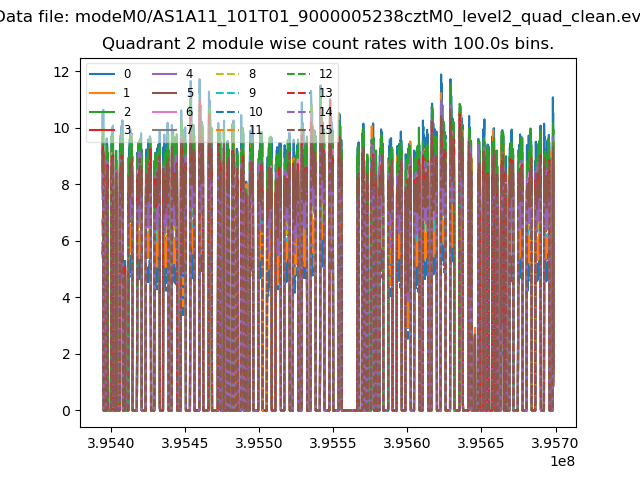 |
 |
| Module-wise count rates for Quadrant D Data is divided into 100 sec bins |
 |
 |
| Parameter | Plot |
|---|---|
| CZT HV Monitor | 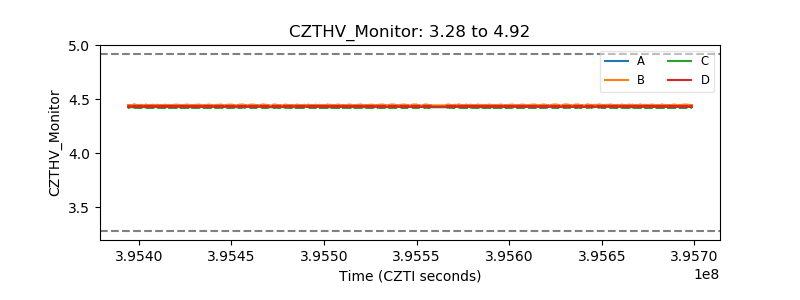 |
| D_VDD | 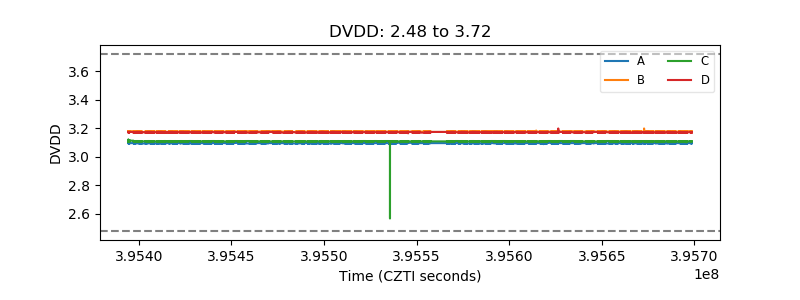 |
| Temperature 1 | 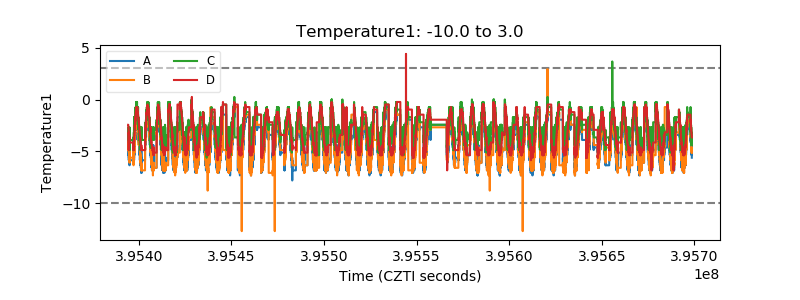 |
| Veto HV Monitor | 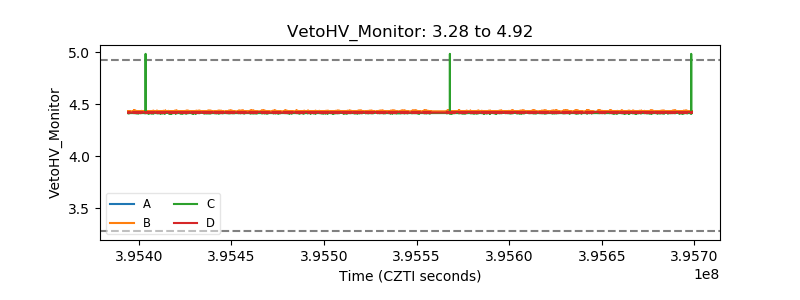 |
| Veto LLD | 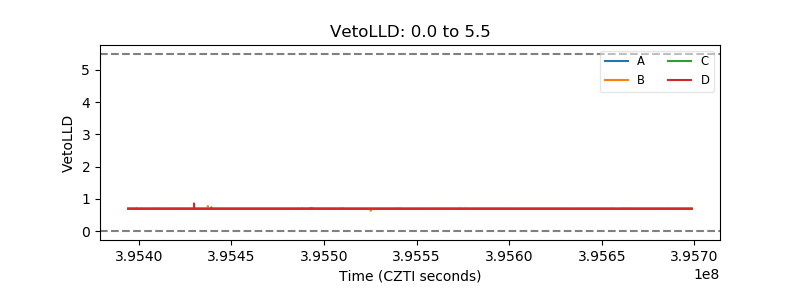 |
| Alpha Counter | 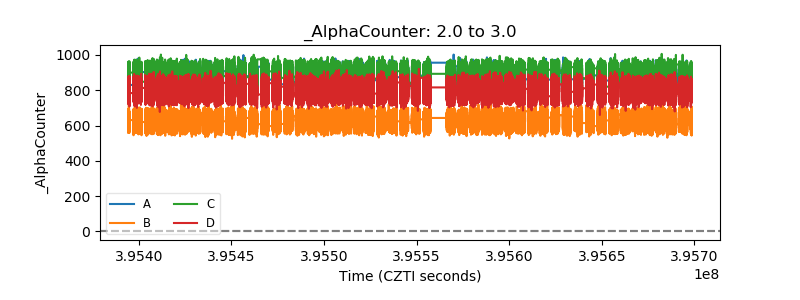 |
| _CPM_Rate | 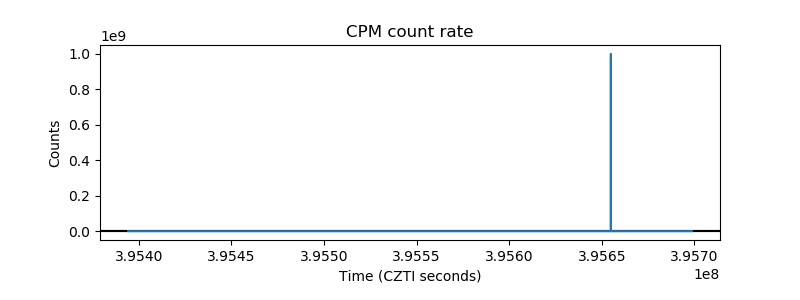 |
| CZT Counter | 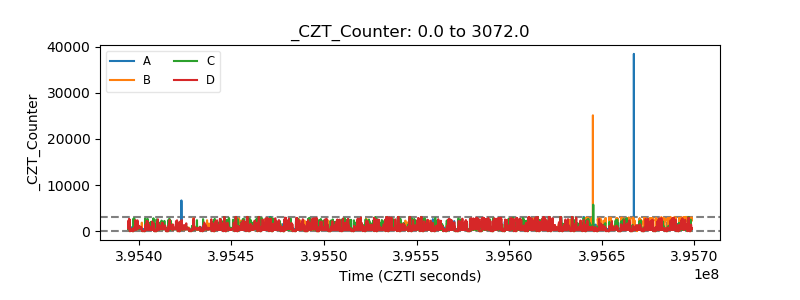 |
| +2.5 Volts monitor |  |
| +5 Volts monitor | 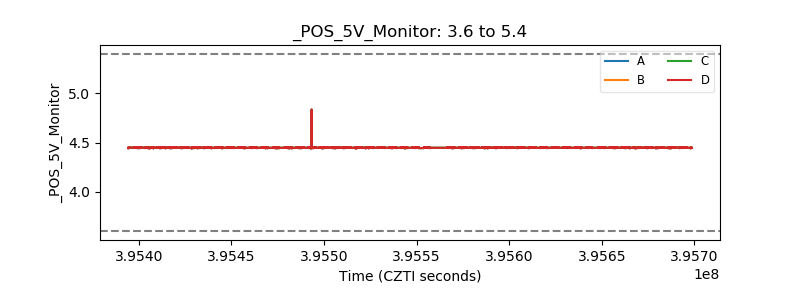 |
| _ROLL_ROT | 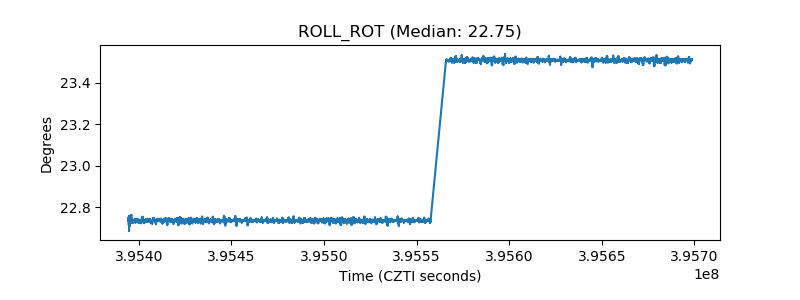 |
| _Roll_DEC | 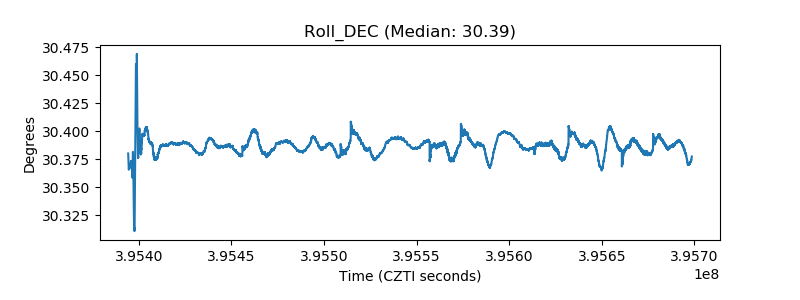 |
| _Roll_RA | 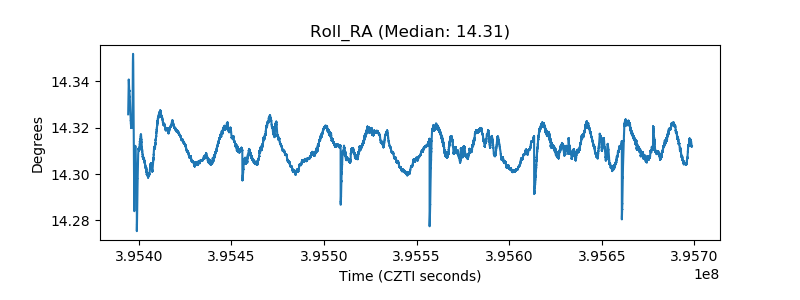 |
| Veto Counter | 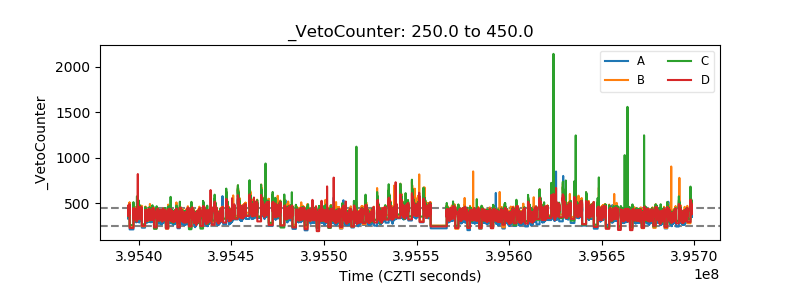 |