| Param | Original file | Final file |
|---|---|---|
| Filename | modeM0/AS1A11_101T01_9000005238_36712cztM0_level2.evt | modeM0/AS1A11_101T01_9000005238_36712cztM0_level2_quad_clean.evt |
| Size (bytes) | 156,021,120 | 30,035,520 |
| Size | 148.8 MB | 28.6 MB |
| Events in quadrant A | 885,938 | 202,076 |
| Events in quadrant B | 1,011,192 | 206,881 |
| Events in quadrant C | 1,230,357 | 194,852 |
| Events in quadrant D | 1,479,510 | 180,110 |
| Mode M0 | |||
|---|---|---|---|
| Quadrant | BADHDUFLAG | Total packets | Discarded packets |
| A | 0 | 3633 | 2 |
| B | 0 | 4126 | 1 |
| C | 0 | 4693 | 1 |
| D | 0 | 5636 | 1 |
| Mode SS | |||
|---|---|---|---|
| Quadrant | BADHDUFLAG | Total packets | Discarded packets |
| A | 0 | 36 | 0 |
| B | 0 | 36 | 0 |
| C | 0 | 36 | 0 |
| D | 0 | 36 | 0 |
| Mode M9 | |||
|---|---|---|---|
| Quadrant | BADHDUFLAG | Total packets | Discarded packets |
| A | 0 | 21 | 0 |
| B | 0 | 21 | 0 |
| C | 0 | 21 | 0 |
| D | 0 | 21 | 0 |
| Quadrant | Total seconds | Saturated seconds | Saturation percentage |
|---|---|---|---|
| A | 1705 | 5 | 0.293255% |
| B | 1705 | 14 | 0.821114% |
| C | 1705 | 101 | 5.923754% |
| D | 1705 | 179 | 10.498534% |
Noise dominated data is calculated using 1-second bins in cleaned event files. If a bin has >2000 counts, and if more than 50% of those come from <1% of pixels, then it is considered to be noise-dominated and hence unusable.
| Quadrant | # 1 sec bins | Bins with >0 counts | Bins with >2000 counts | High rate bins dominated by noise | Noise dominated (total time) | Noise dominated (detector-on time) | Marked lightcurve |
|---|---|---|---|---|---|---|---|
| A | 3767 | 1706 | 2 | 2 | 0.05% | 0.12% | 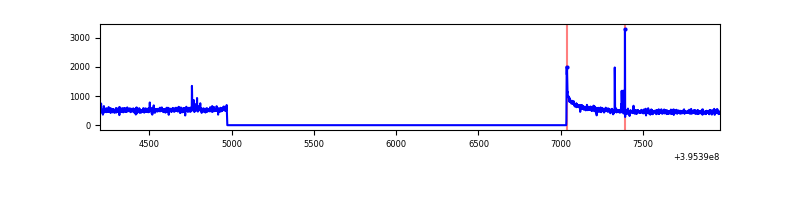 |
| B | 3767 | 1706 | 3 | 3 | 0.08% | 0.18% | 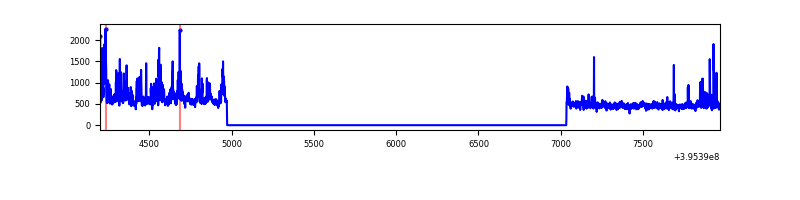 |
| C | 3767 | 1706 | 83 | 83 | 2.20% | 4.87% | 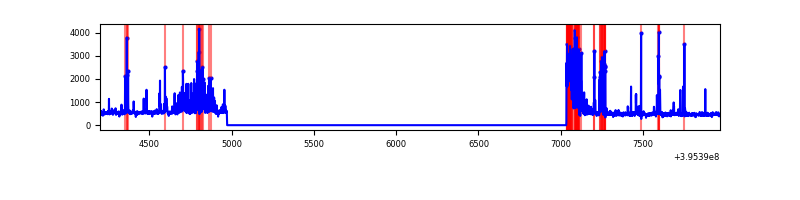 |
| D | 3767 | 1706 | 145 | 145 | 3.85% | 8.50% | 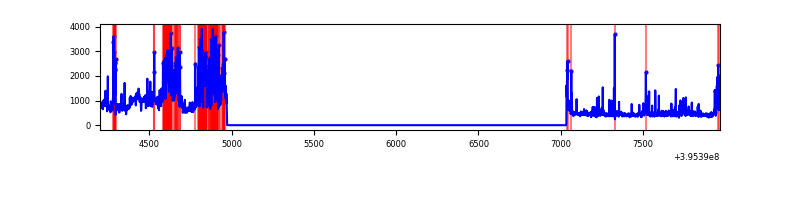 |
Top three noisy pixels from each quadrant. If the there are fewer than three noisy pixels in the level2.evt file, extra rows are filled as -1
| Pixel properties | Quadrant properties | ||||||
|---|---|---|---|---|---|---|---|
| Quadrant | DetID | PixID | Counts | Sigma | Mean | Median | Sigma |
| A | 10 | 83 | 90212 | 2137.95 | 200 | 196 | 42.1 |
| A | 9 | 143 | 15527 | 364.12 | 200 | 196 | 42.1 |
| A | 13 | 254 | 2938 | 65.12 | 200 | 196 | 42.1 |
| B | 0 | 221 | 143680 | 3476.49 | 200 | 195 | 41.3 |
| B | 5 | 255 | 27956 | 672.62 | 200 | 195 | 41.3 |
| B | 0 | 189 | 13932 | 332.83 | 200 | 195 | 41.3 |
| C | 14 | 254 | 245651 | 5286.8 | 191 | 192 | 46.4 |
| C | 0 | 10 | 157070 | 3378.91 | 191 | 192 | 46.4 |
| C | 15 | 214 | 79437 | 1706.81 | 191 | 192 | 46.4 |
| D | 12 | 233 | 415252 | 8821.12 | 186 | 180 | 47.1 |
| D | 13 | 36 | 205111 | 4355.2 | 186 | 180 | 47.1 |
| D | 2 | 250 | 31214 | 659.54 | 186 | 180 | 47.1 |
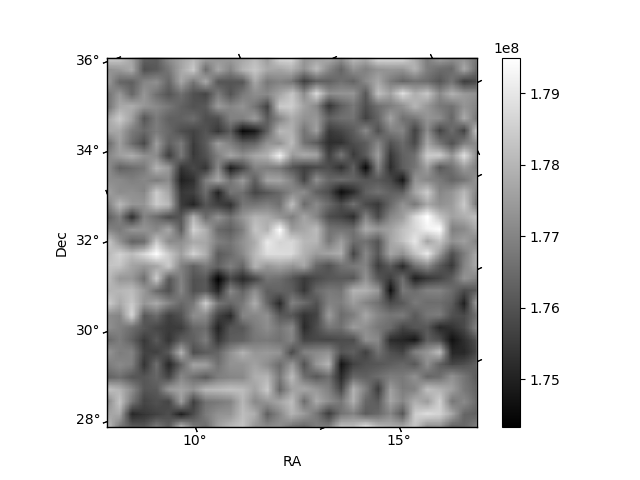
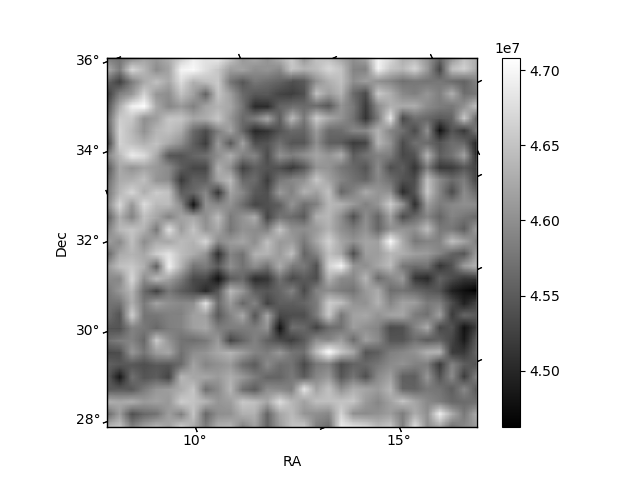
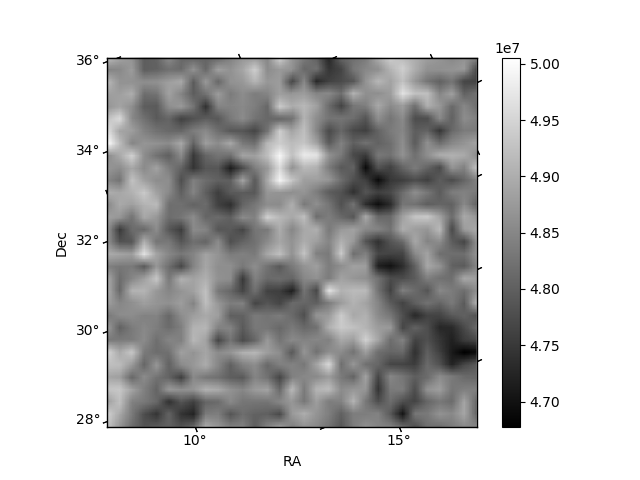
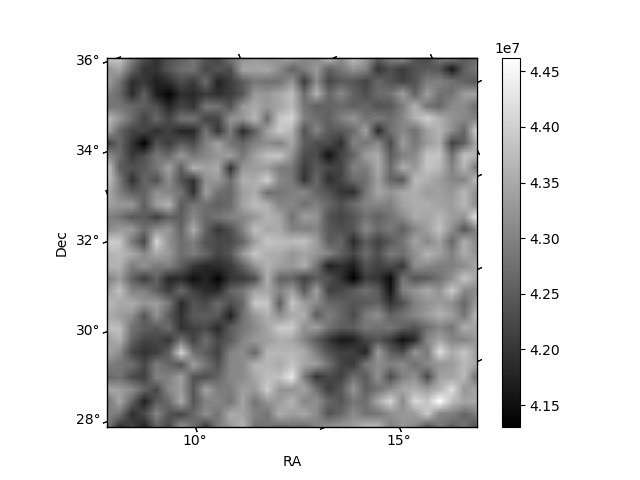
Histogram calculated using DETX and DETY for each event in the final _common_clean file
| Quadrant A | 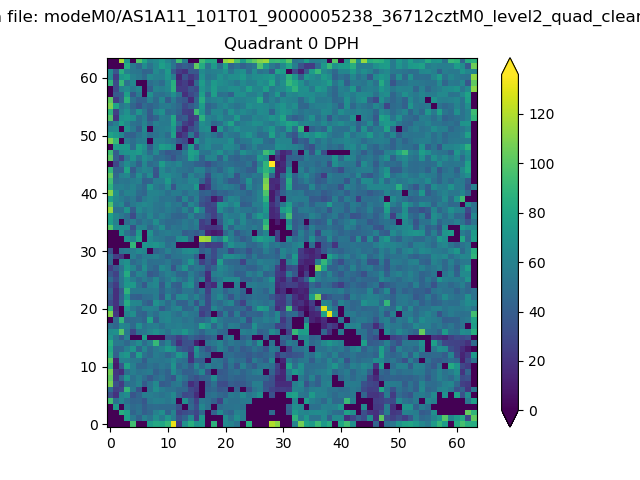 |
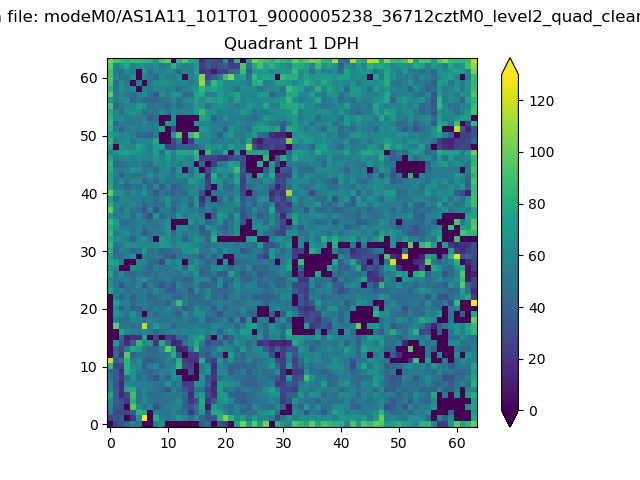 |
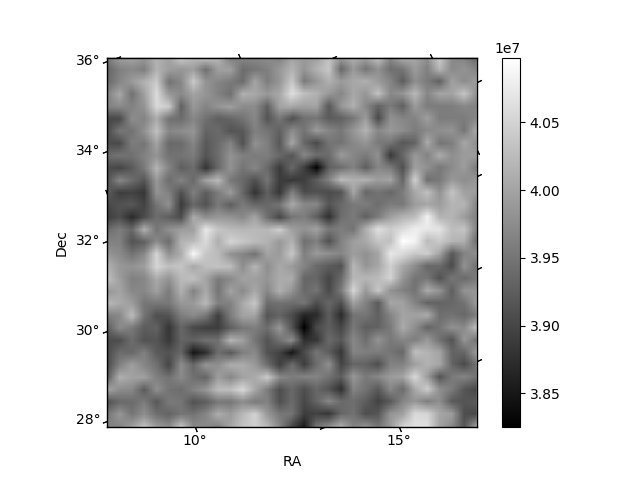
Quadrant B |
|---|---|---|---|
| Quadrant D | 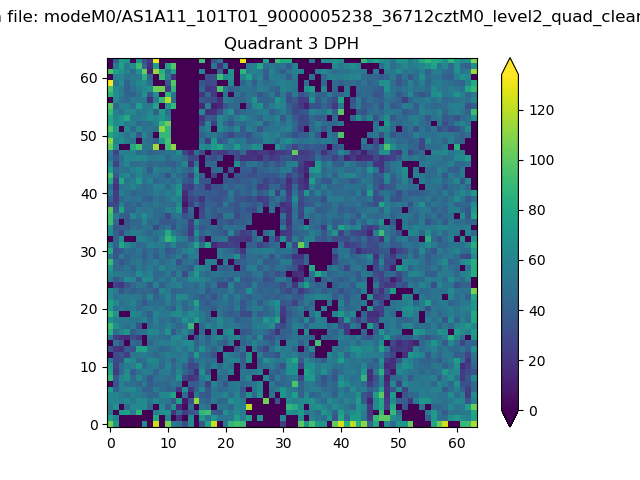 |
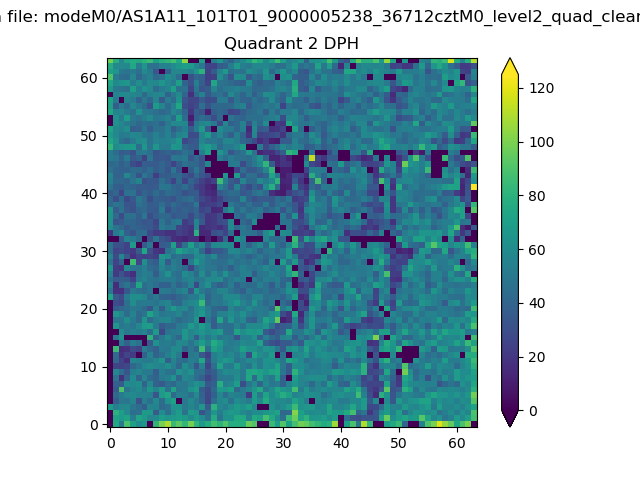 |
Quadrant C |
| Plot type | Count rate plots | Images |
|---|---|---|
| Comparison with Poisson distribution Blue bars denote a histogram of data divided into 1 sec bins. Red curve is a Poisson curve with rate = median count rate of data. |
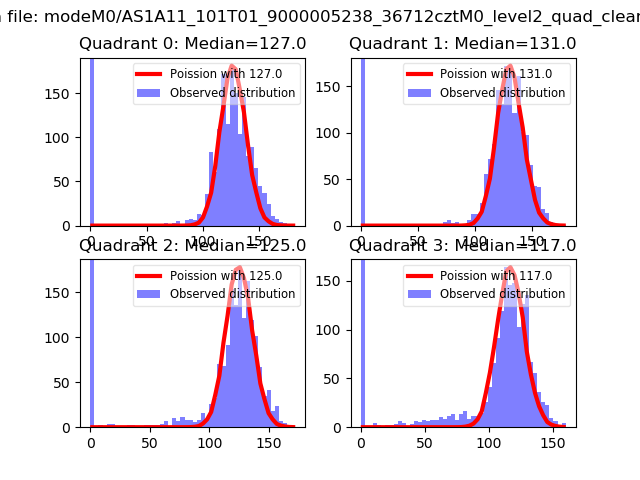 |
 |
| Quadrant-wise count rates Data is divided into 100 sec bins |
 |
|
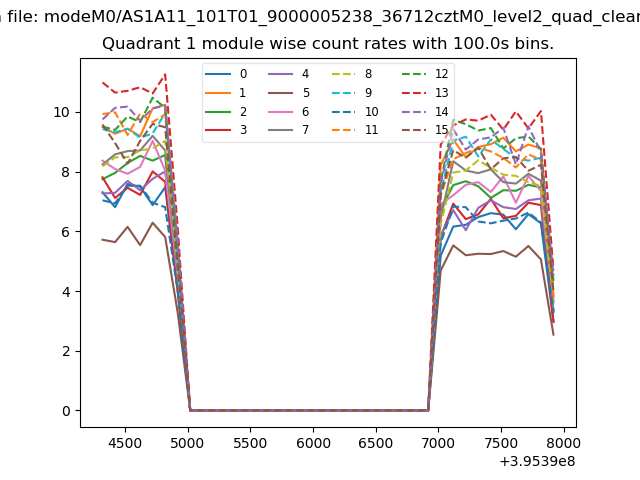
| Module-wise count rates for Quadrant A Data is divided into 100 sec bins |
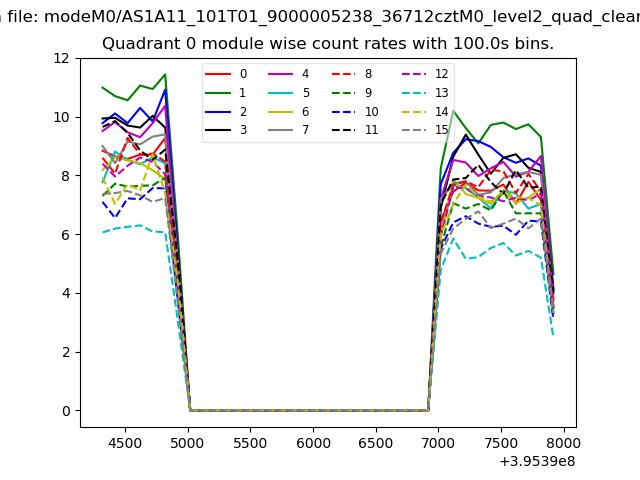 |
 |
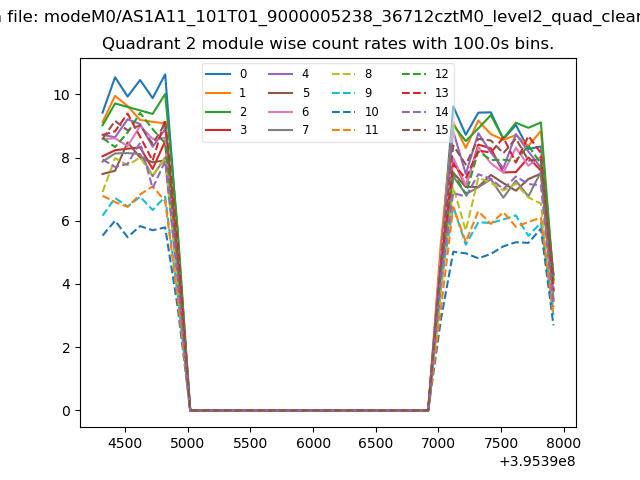
| Module-wise count rates for Quadrant B Data is divided into 100 sec bins |
 |
 |
| Module-wise count rates for Quadrant C Data is divided into 100 sec bins |
 |
 |
| Module-wise count rates for Quadrant D Data is divided into 100 sec bins |
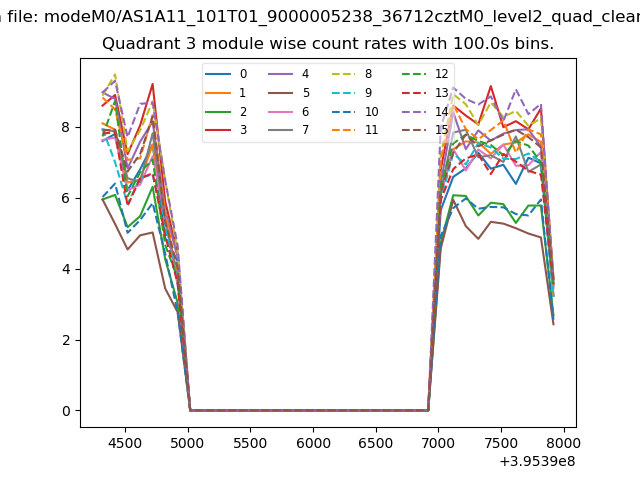 |
 |
| Parameter | Plot |
|---|---|
| CZT HV Monitor | 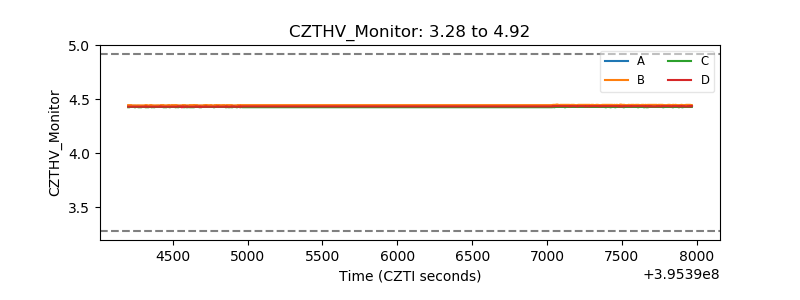 |
| D_VDD | 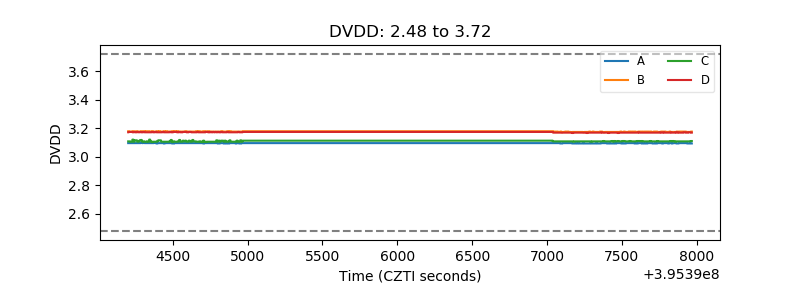 |
| Temperature 1 | 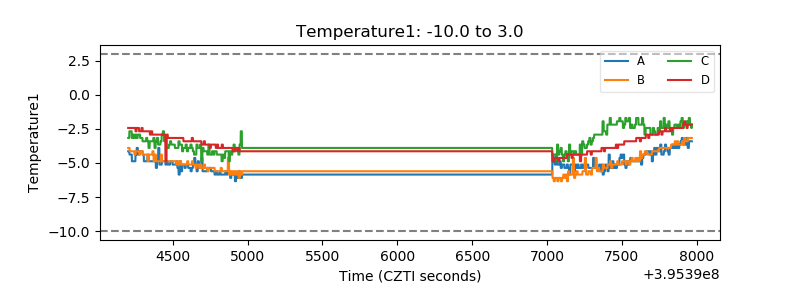 |
| Veto HV Monitor |  |
| Veto LLD | 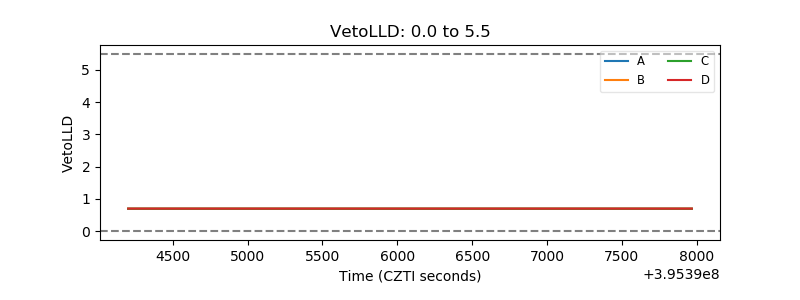 |
| Alpha Counter |  |
| _CPM_Rate | 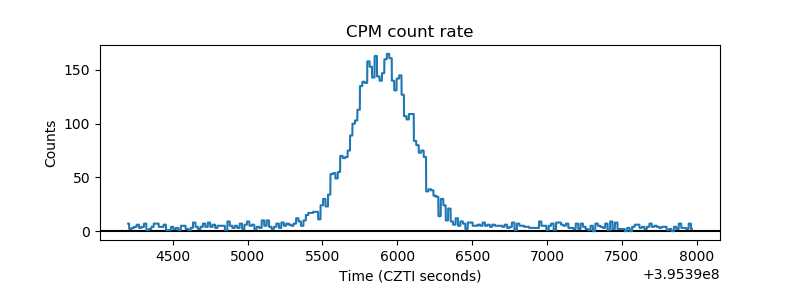 |
| CZT Counter | 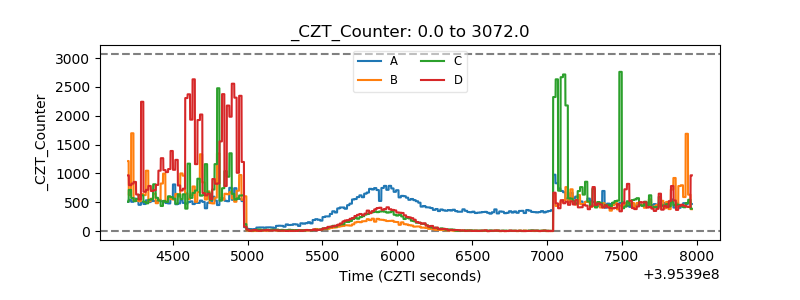 |
| +2.5 Volts monitor |  |
| +5 Volts monitor |  |
| _ROLL_ROT | 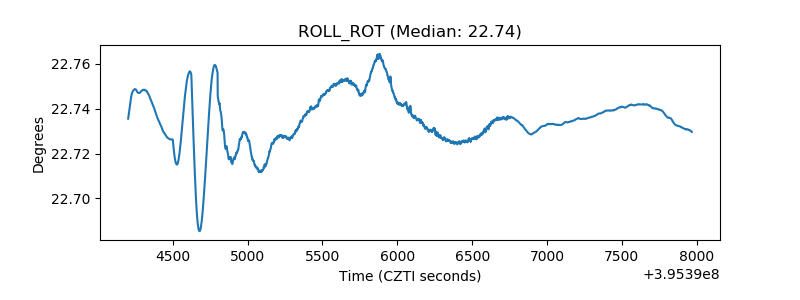 |
| _Roll_DEC |  |
| _Roll_RA | 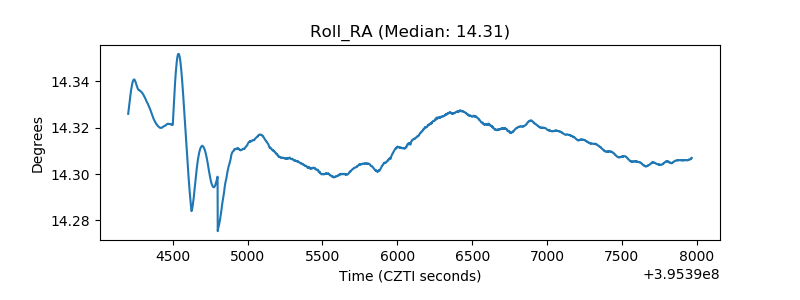 |
| Veto Counter | 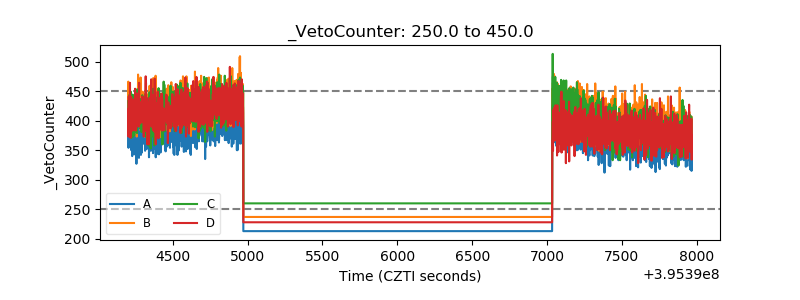 |