| Param | Original file | Final file |
|---|---|---|
| Filename | modeM0/AS1A11_101T01_9000005238_36714cztM0_level2.evt | modeM0/AS1A11_101T01_9000005238_36714cztM0_level2_quad_clean.evt |
| Size (bytes) | 443,911,680 | 57,441,600 |
| Size | 423.3 MB | 54.8 MB |
| Events in quadrant A | 2,875,730 | 339,114 |
| Events in quadrant B | 3,359,947 | 340,993 |
| Events in quadrant C | 3,368,343 | 329,477 |
| Events in quadrant D | 3,442,791 | 320,976 |
| Mode M0 | |||
|---|---|---|---|
| Quadrant | BADHDUFLAG | Total packets | Discarded packets |
| A | 0 | 12113 | 3 |
| B | 0 | 13656 | 2 |
| C | 0 | 13505 | 2 |
| D | 0 | 14016 | 2 |
| Mode SS | |||
|---|---|---|---|
| Quadrant | BADHDUFLAG | Total packets | Discarded packets |
| A | 0 | 118 | 0 |
| B | 0 | 118 | 0 |
| C | 0 | 118 | 0 |
| D | 0 | 118 | 0 |
| Mode M9 | |||
|---|---|---|---|
| Quadrant | BADHDUFLAG | Total packets | Discarded packets |
| A | 0 | 15 | 0 |
| B | 0 | 15 | 0 |
| C | 0 | 15 | 0 |
| D | 0 | 16 | 0 |
| Quadrant | Total seconds | Saturated seconds | Saturation percentage |
|---|---|---|---|
| A | 5846 | 9 | 0.153951% |
| B | 5846 | 81 | 1.385563% |
| C | 5846 | 125 | 2.138214% |
| D | 5846 | 124 | 2.121108% |
Noise dominated data is calculated using 1-second bins in cleaned event files. If a bin has >2000 counts, and if more than 50% of those come from <1% of pixels, then it is considered to be noise-dominated and hence unusable.
| Quadrant | # 1 sec bins | Bins with >0 counts | Bins with >2000 counts | High rate bins dominated by noise | Noise dominated (total time) | Noise dominated (detector-on time) | Marked lightcurve |
|---|---|---|---|---|---|---|---|
| A | 7279 | 5847 | 1 | 1 | 0.01% | 0.02% | 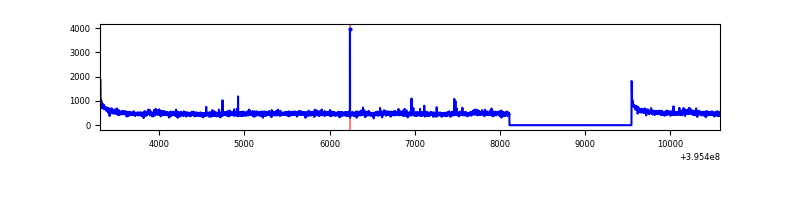 |
| B | 7279 | 5847 | 47 | 47 | 0.65% | 0.80% | 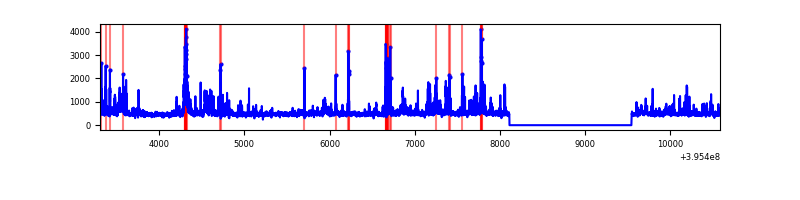 |
| C | 7279 | 5847 | 121 | 121 | 1.66% | 2.07% | 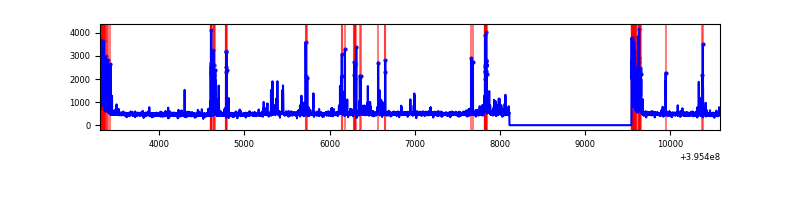 |
| D | 7279 | 5847 | 99 | 99 | 1.36% | 1.69% | 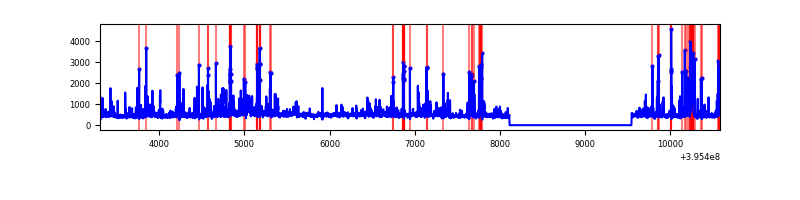 |
Top three noisy pixels from each quadrant. If the there are fewer than three noisy pixels in the level2.evt file, extra rows are filled as -1
| Pixel properties | Quadrant properties | ||||||
|---|---|---|---|---|---|---|---|
| Quadrant | DetID | PixID | Counts | Sigma | Mean | Median | Sigma |
| A | 10 | 83 | 237968 | 1747.66 | 663 | 650 | 135.8 |
| A | 10 | 228 | 36778 | 266.05 | 663 | 650 | 135.8 |
| A | 9 | 143 | 17586 | 124.72 | 663 | 650 | 135.8 |
| B | 5 | 255 | 244791 | 1914.6 | 657 | 641 | 127.5 |
| B | 0 | 221 | 176163 | 1376.43 | 657 | 641 | 127.5 |
| B | 4 | 171 | 125836 | 981.77 | 657 | 641 | 127.5 |
| C | 14 | 254 | 336597 | 2265.93 | 634 | 638 | 148.3 |
| C | 0 | 10 | 286639 | 1928.98 | 634 | 638 | 148.3 |
| C | 15 | 214 | 263596 | 1773.56 | 634 | 638 | 148.3 |
| D | 12 | 233 | 254617 | 1606.52 | 639 | 620 | 158.1 |
| D | 13 | 249 | 238402 | 1503.96 | 639 | 620 | 158.1 |
| D | 2 | 249 | 115475 | 726.45 | 639 | 620 | 158.1 |
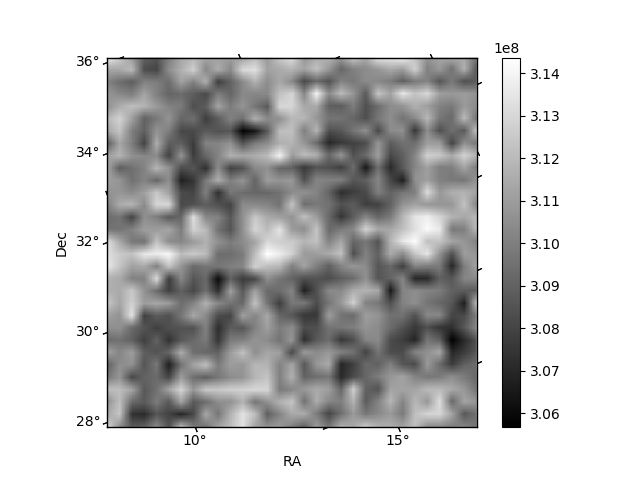
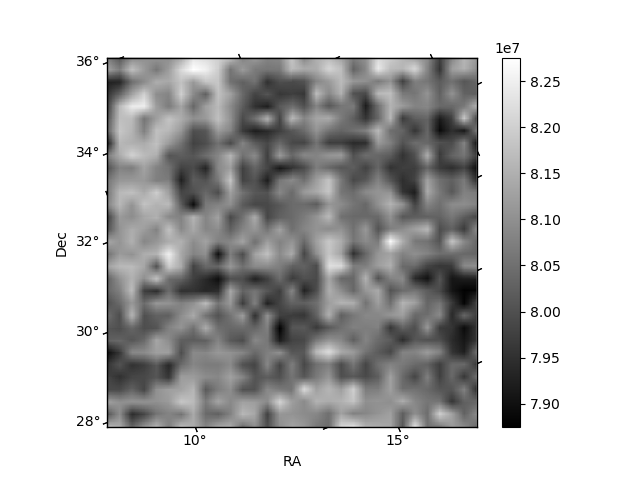
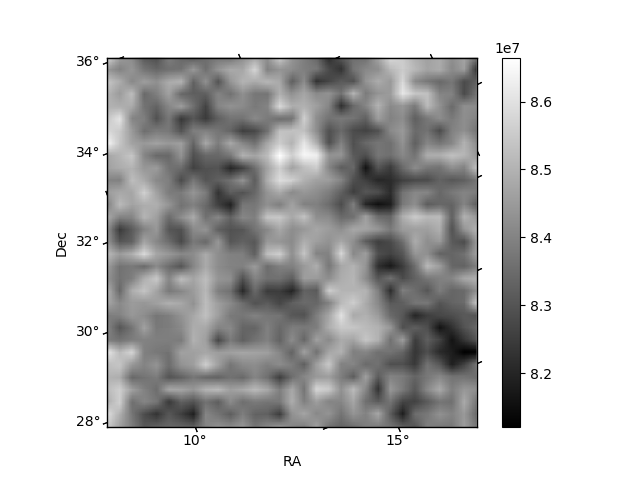
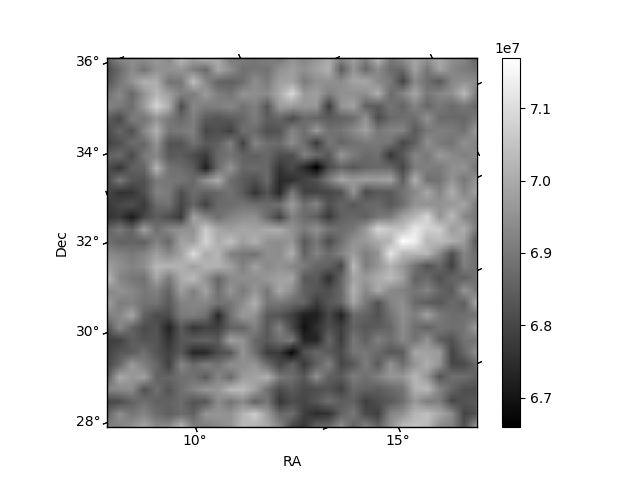
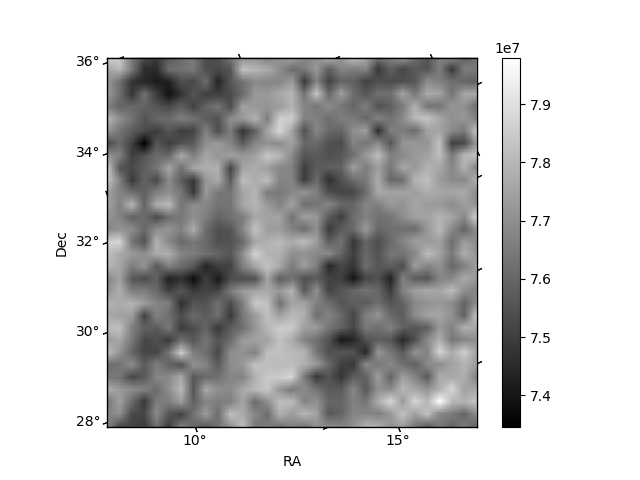
Histogram calculated using DETX and DETY for each event in the final _common_clean file
| Quadrant A | 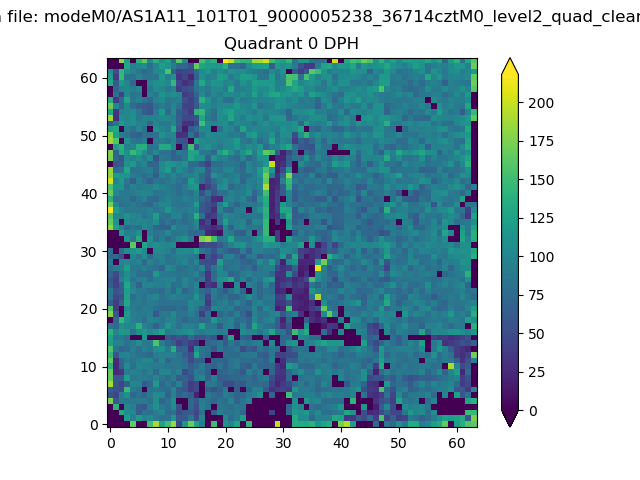 |
 |
Quadrant B |
|---|---|---|---|
| Quadrant D | 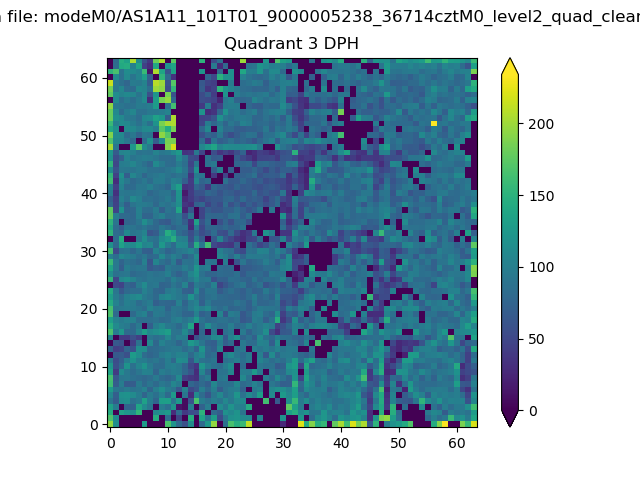 |
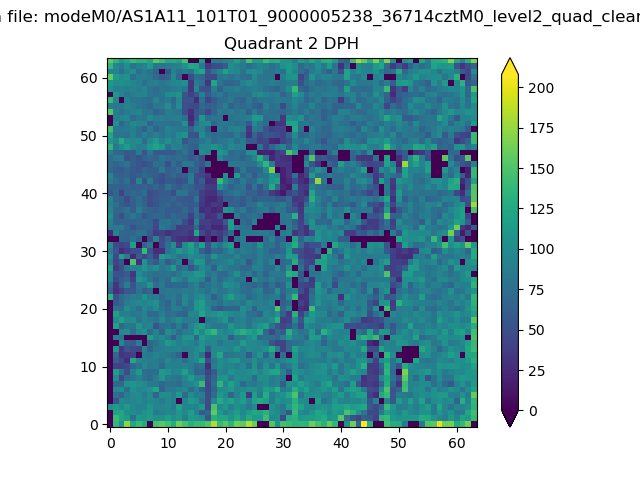 |
Quadrant C |
| Plot type | Count rate plots | Images |
|---|---|---|
| Comparison with Poisson distribution Blue bars denote a histogram of data divided into 1 sec bins. Red curve is a Poisson curve with rate = median count rate of data. |
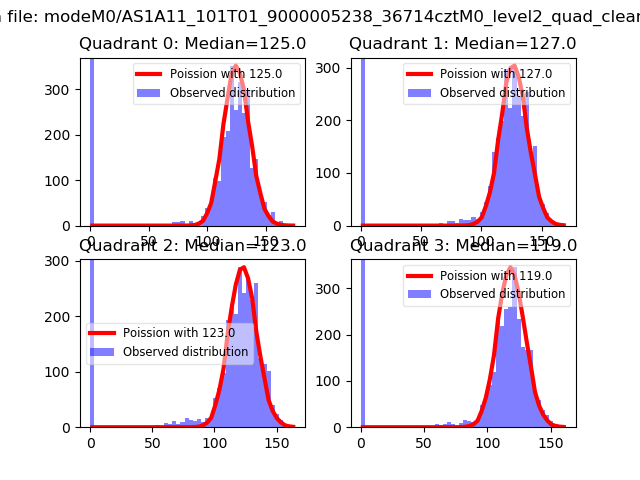 |
 |
| Quadrant-wise count rates Data is divided into 100 sec bins |
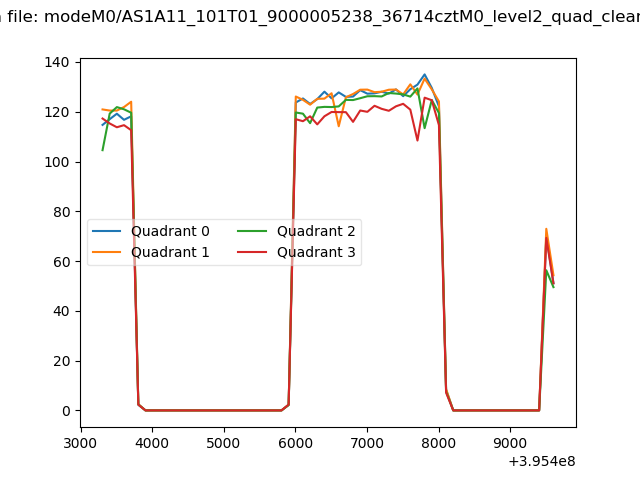 |
|
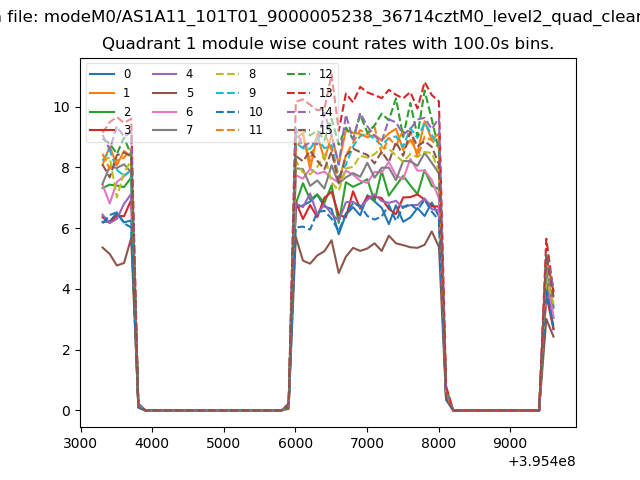
| Module-wise count rates for Quadrant A Data is divided into 100 sec bins |
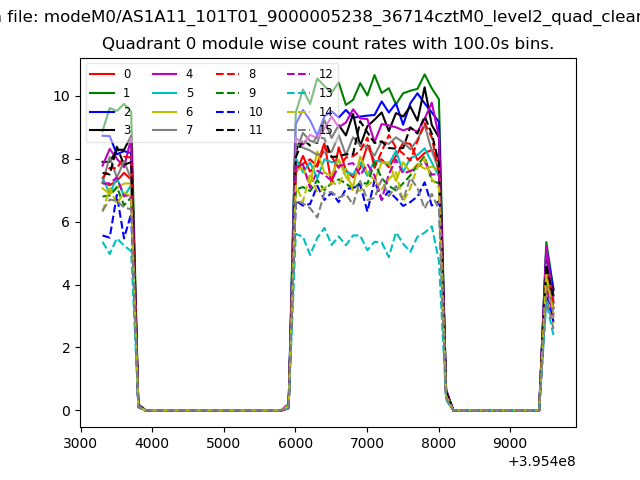 |
 |
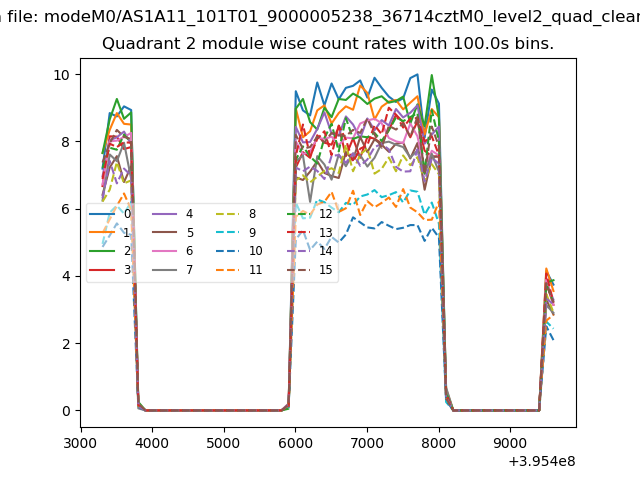
| Module-wise count rates for Quadrant B Data is divided into 100 sec bins |
 |
 |
| Module-wise count rates for Quadrant C Data is divided into 100 sec bins |
 |
 |
| Module-wise count rates for Quadrant D Data is divided into 100 sec bins |
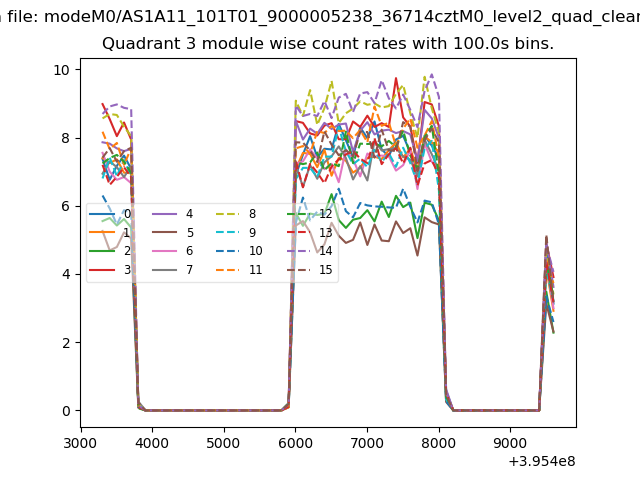 |
 |
| Parameter | Plot |
|---|---|
| CZT HV Monitor | 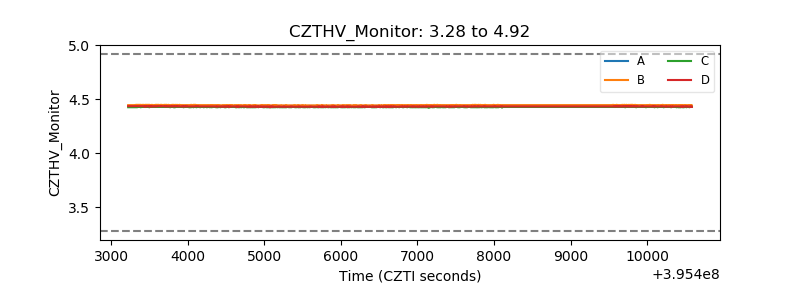 |
| D_VDD | 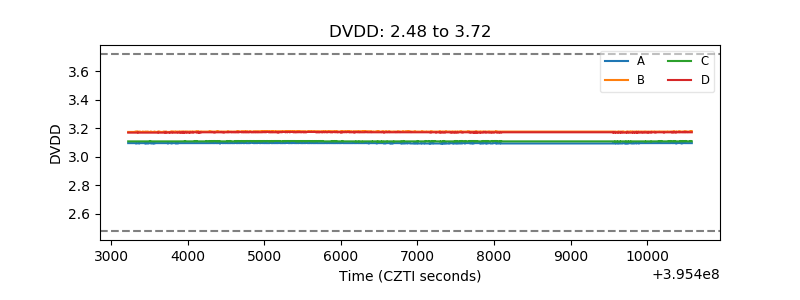 |
| Temperature 1 | 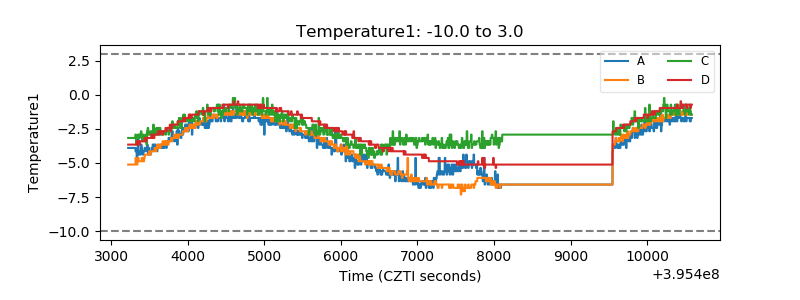 |
| Veto HV Monitor | 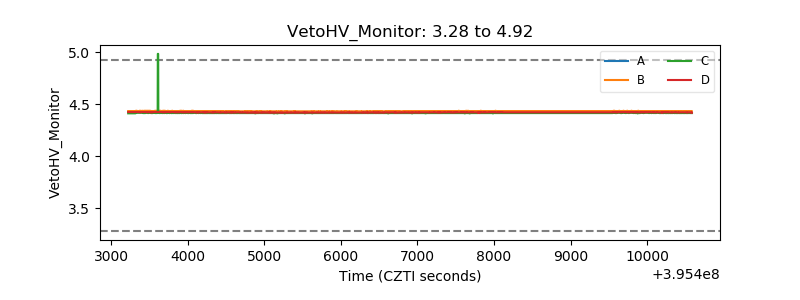 |
| Veto LLD | 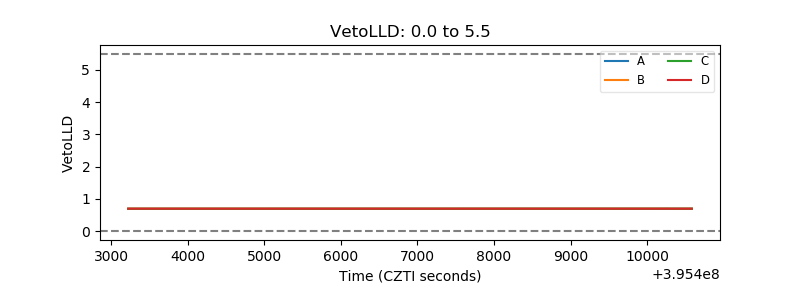 |
| Alpha Counter | 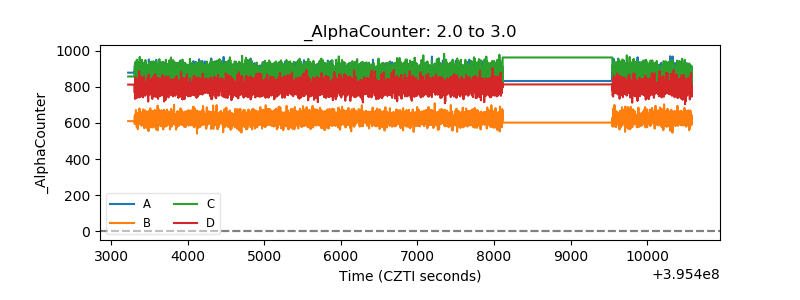 |
| _CPM_Rate | 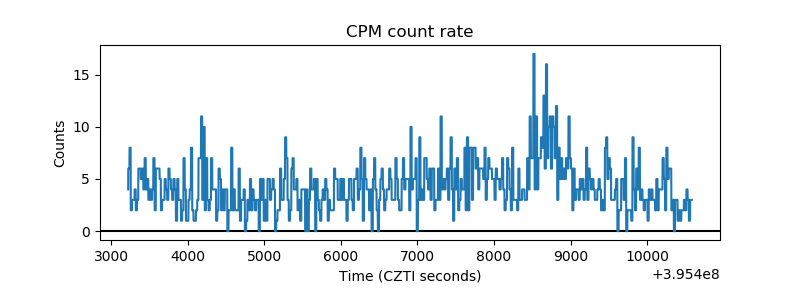 |
| CZT Counter | 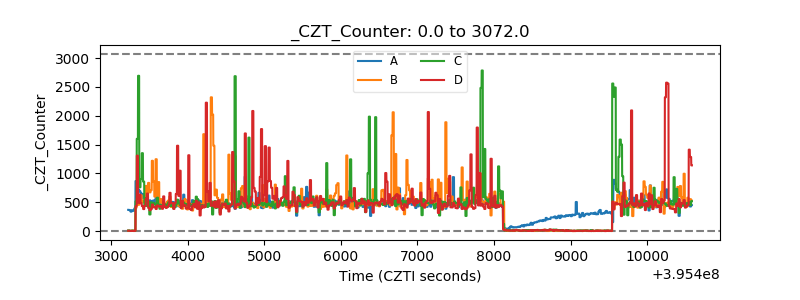 |
| +2.5 Volts monitor | 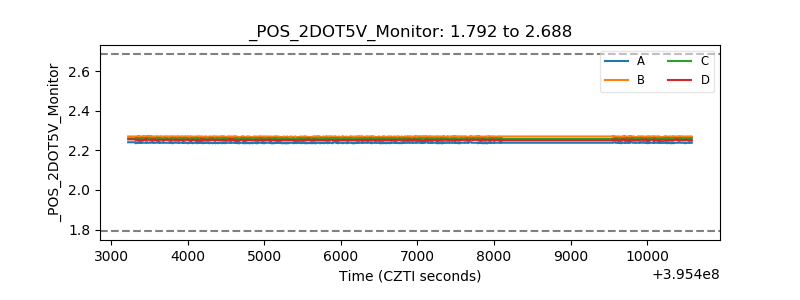 |
| +5 Volts monitor | 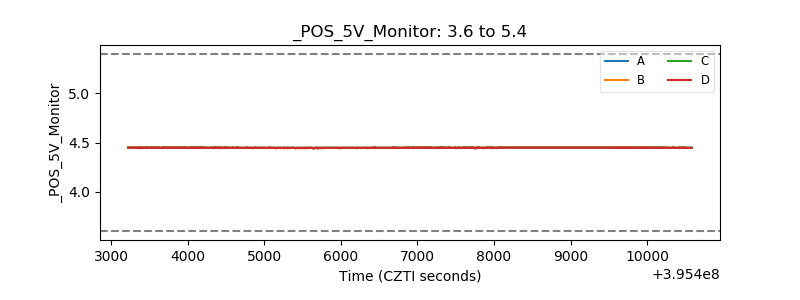 |
| _ROLL_ROT | 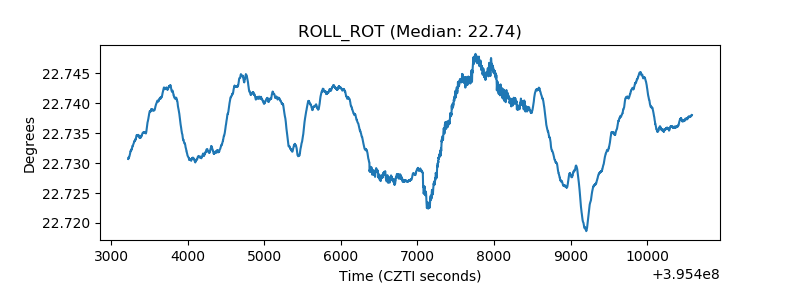 |
| _Roll_DEC | 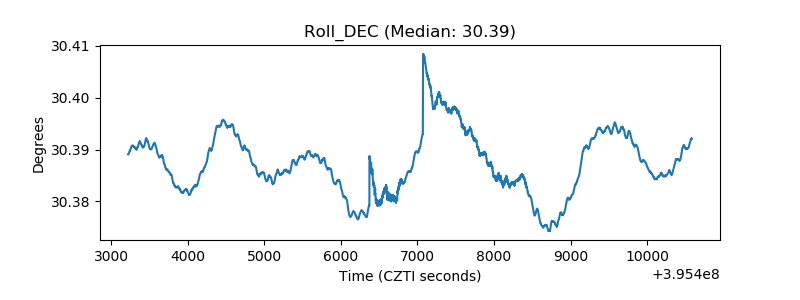 |
| _Roll_RA | 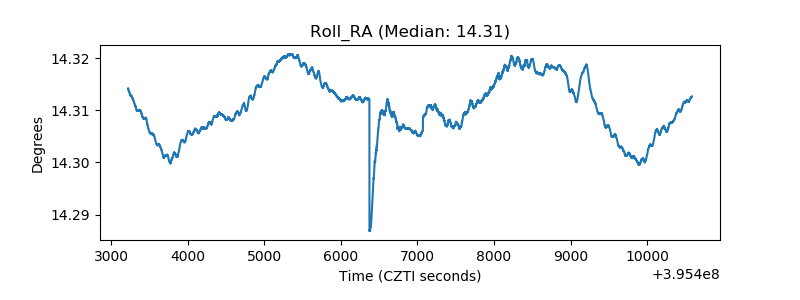 |
| Veto Counter | 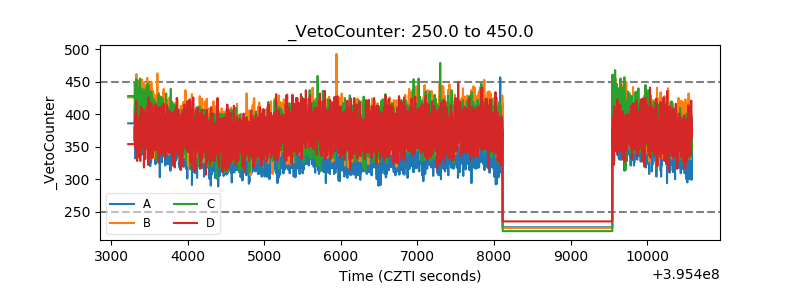 |