| Param | Original file | Final file |
|---|---|---|
| Filename | modeM0/AS1A11_101T01_9000005238_36715cztM0_level2.evt | modeM0/AS1A11_101T01_9000005238_36715cztM0_level2_quad_clean.evt |
| Size (bytes) | 478,918,080 | 58,510,080 |
| Size | 456.7 MB | 55.8 MB |
| Events in quadrant A | 2,932,636 | 346,935 |
| Events in quadrant B | 3,208,108 | 349,443 |
| Events in quadrant C | 4,079,276 | 332,062 |
| Events in quadrant D | 3,876,590 | 323,692 |
| Mode M0 | |||
|---|---|---|---|
| Quadrant | BADHDUFLAG | Total packets | Discarded packets |
| A | 0 | 12470 | 3 |
| B | 0 | 13345 | 2 |
| C | 0 | 15804 | 2 |
| D | 0 | 15472 | 2 |
| Mode SS | |||
|---|---|---|---|
| Quadrant | BADHDUFLAG | Total packets | Discarded packets |
| A | 0 | 124 | 0 |
| B | 0 | 124 | 0 |
| C | 0 | 124 | 0 |
| D | 0 | 124 | 0 |
| Mode M9 | |||
|---|---|---|---|
| Quadrant | BADHDUFLAG | Total packets | Discarded packets |
| A | 0 | 19 | 0 |
| B | 0 | 19 | 0 |
| C | 0 | 19 | 0 |
| D | 0 | 20 | 0 |
| Quadrant | Total seconds | Saturated seconds | Saturation percentage |
|---|---|---|---|
| A | 5995 | 13 | 0.216847% |
| B | 5995 | 37 | 0.617181% |
| C | 5995 | 348 | 5.804837% |
| D | 5995 | 144 | 2.402002% |
Noise dominated data is calculated using 1-second bins in cleaned event files. If a bin has >2000 counts, and if more than 50% of those come from <1% of pixels, then it is considered to be noise-dominated and hence unusable.
| Quadrant | # 1 sec bins | Bins with >0 counts | Bins with >2000 counts | High rate bins dominated by noise | Noise dominated (total time) | Noise dominated (detector-on time) | Marked lightcurve |
|---|---|---|---|---|---|---|---|
| A | 7278 | 5997 | 3 | 3 | 0.04% | 0.05% | 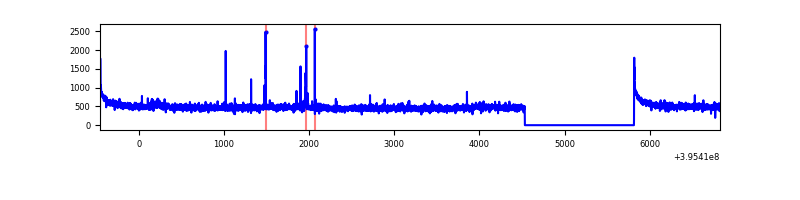 |
| B | 7278 | 5997 | 19 | 19 | 0.26% | 0.32% | 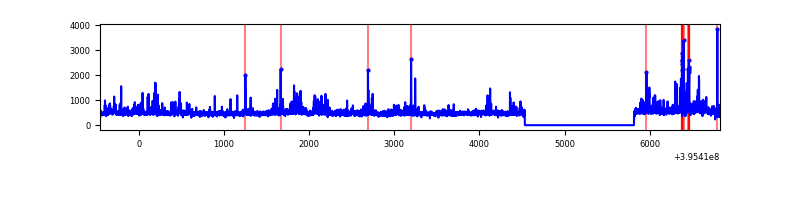 |
| C | 7278 | 5997 | 296 | 296 | 4.07% | 4.94% | 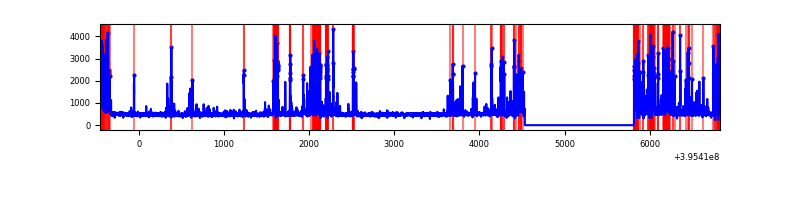 |
| D | 7278 | 5997 | 134 | 134 | 1.84% | 2.23% | 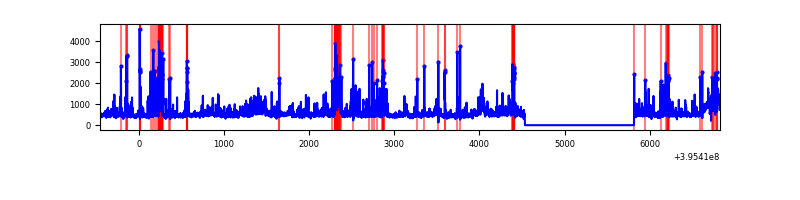 |
Top three noisy pixels from each quadrant. If the there are fewer than three noisy pixels in the level2.evt file, extra rows are filled as -1
| Pixel properties | Quadrant properties | ||||||
|---|---|---|---|---|---|---|---|
| Quadrant | DetID | PixID | Counts | Sigma | Mean | Median | Sigma |
| A | 10 | 83 | 237507 | 1704.35 | 682 | 669 | 139.0 |
| A | 9 | 143 | 18416 | 127.71 | 682 | 669 | 139.0 |
| A | 5 | 168 | 15622 | 107.61 | 682 | 669 | 139.0 |
| B | 0 | 221 | 180080 | 1384.18 | 675 | 659 | 129.6 |
| B | 0 | 189 | 142853 | 1096.98 | 675 | 659 | 129.6 |
| B | 5 | 255 | 86642 | 663.33 | 675 | 659 | 129.6 |
| C | 14 | 254 | 879974 | 5842.43 | 641 | 646 | 150.5 |
| C | 0 | 10 | 415921 | 2759.17 | 641 | 646 | 150.5 |
| C | 15 | 214 | 266392 | 1765.67 | 641 | 646 | 150.5 |
| D | 12 | 233 | 385393 | 2380.44 | 655 | 637 | 161.6 |
| D | 13 | 249 | 273456 | 1687.9 | 655 | 637 | 161.6 |
| D | 13 | 36 | 233680 | 1441.81 | 655 | 637 | 161.6 |
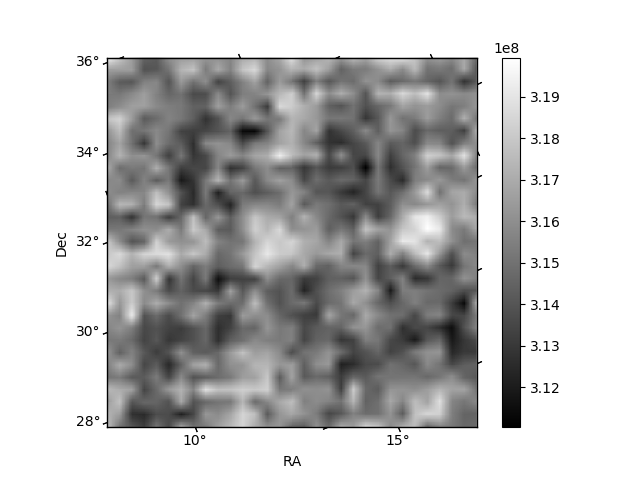
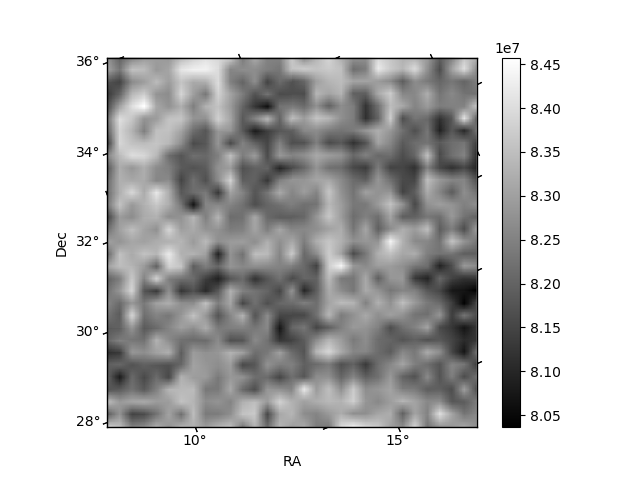
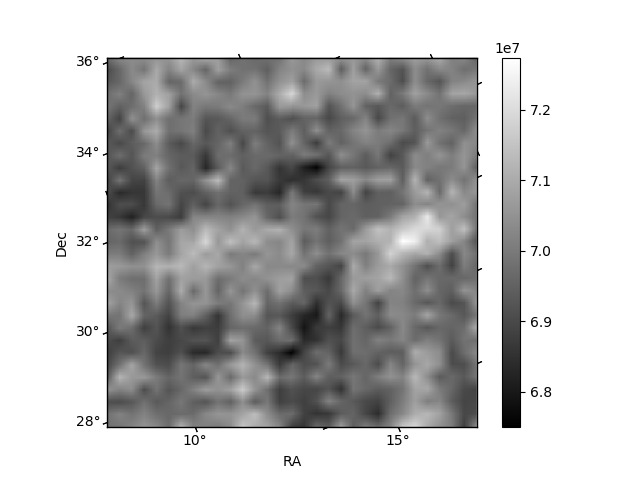
Histogram calculated using DETX and DETY for each event in the final _common_clean file
| Quadrant A | 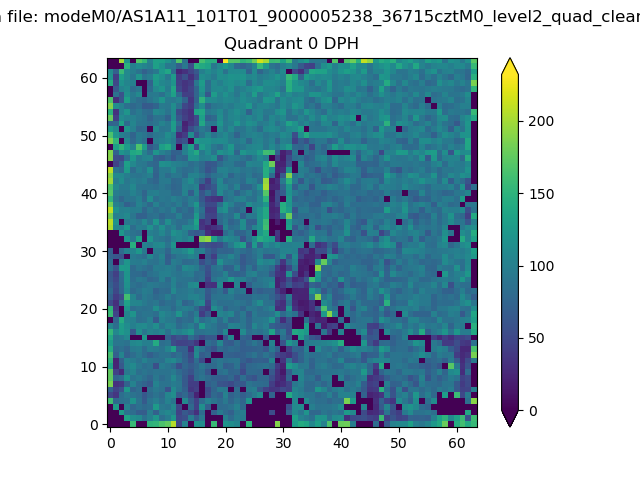 |
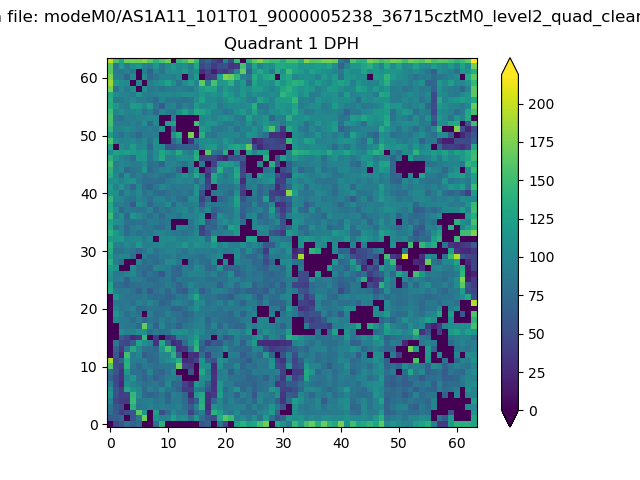 |
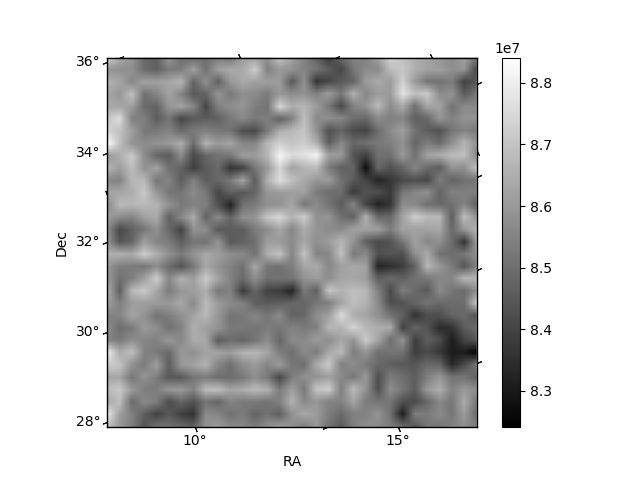
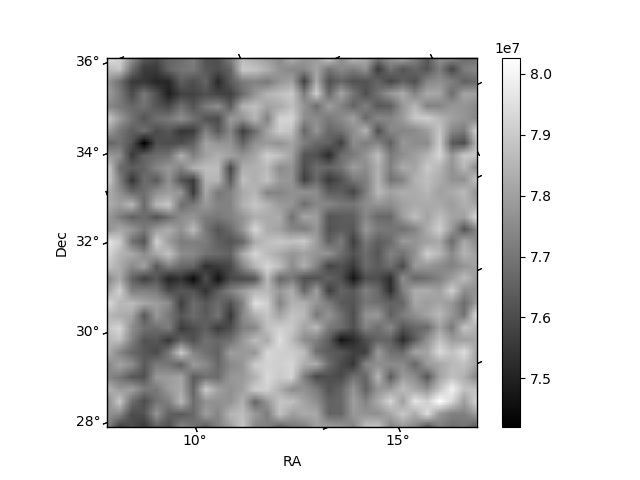
Quadrant B |
|---|---|---|---|
| Quadrant D | 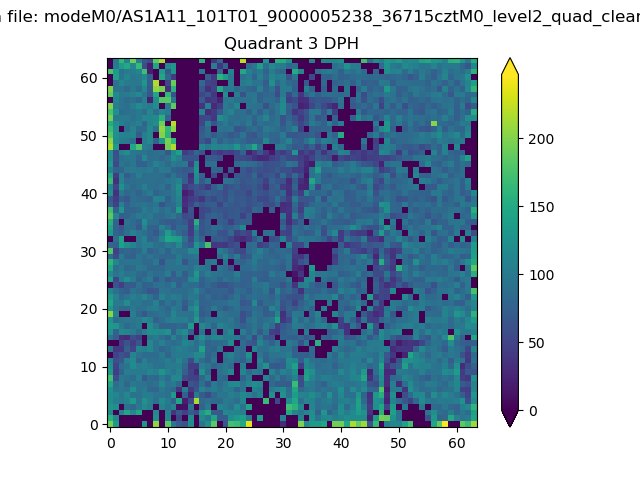 |
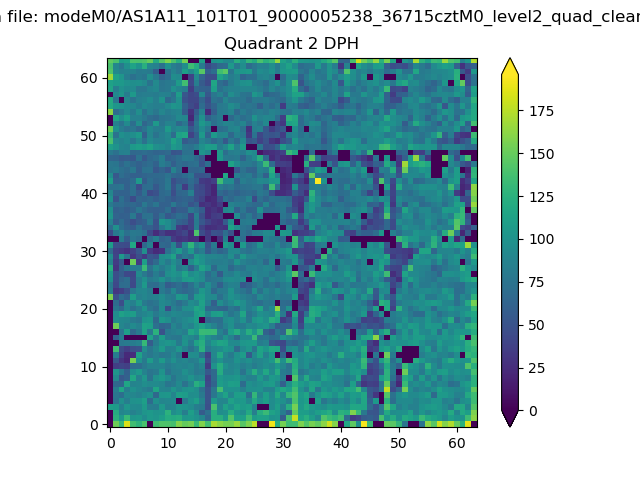 |
Quadrant C |
| Plot type | Count rate plots | Images |
|---|---|---|
| Comparison with Poisson distribution Blue bars denote a histogram of data divided into 1 sec bins. Red curve is a Poisson curve with rate = median count rate of data. |
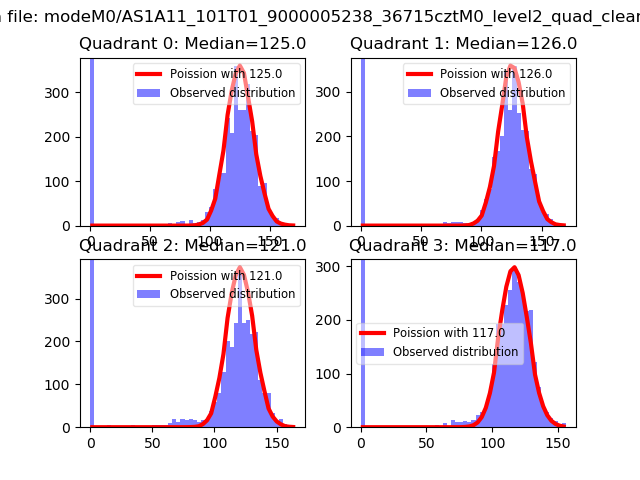 |
 |
| Quadrant-wise count rates Data is divided into 100 sec bins |
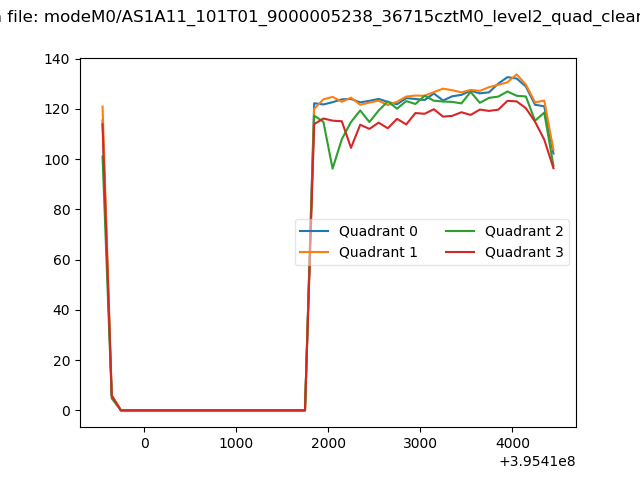 |
|
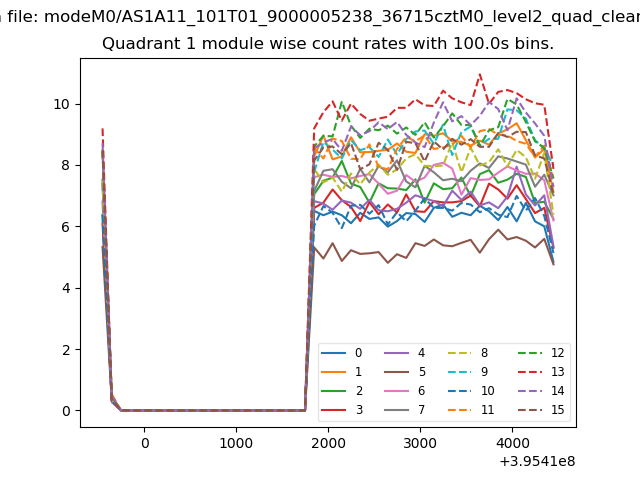
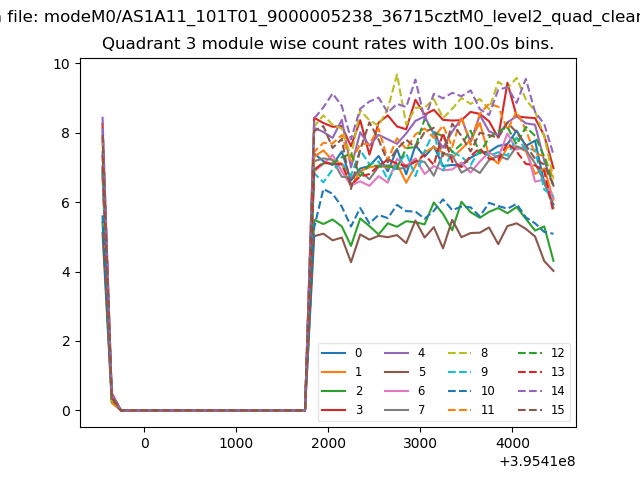
| Module-wise count rates for Quadrant A Data is divided into 100 sec bins |
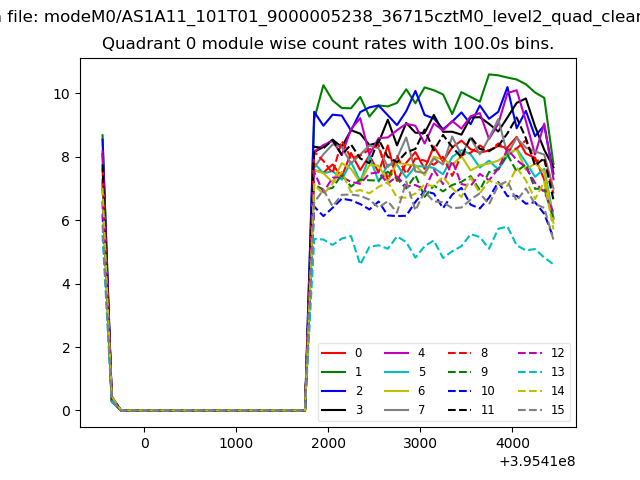 |
 |
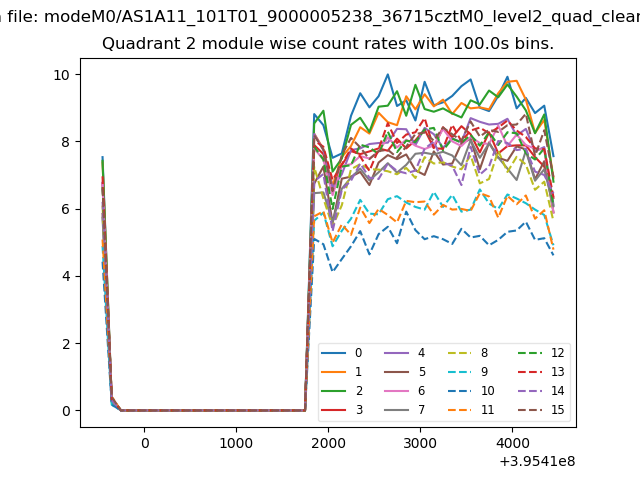
| Module-wise count rates for Quadrant B Data is divided into 100 sec bins |
 |
 |
| Module-wise count rates for Quadrant C Data is divided into 100 sec bins |
 |
 |
| Module-wise count rates for Quadrant D Data is divided into 100 sec bins |
 |
 |
| Parameter | Plot |
|---|---|
| CZT HV Monitor | 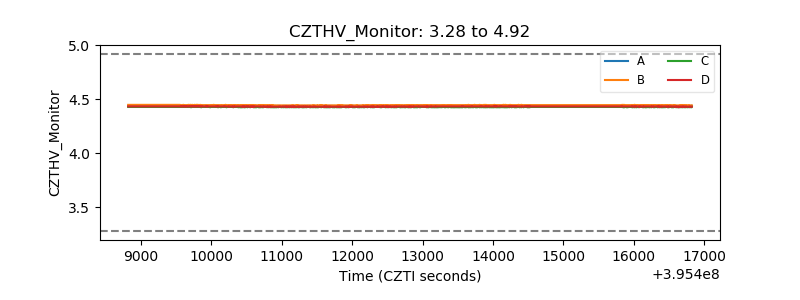 |
| D_VDD | 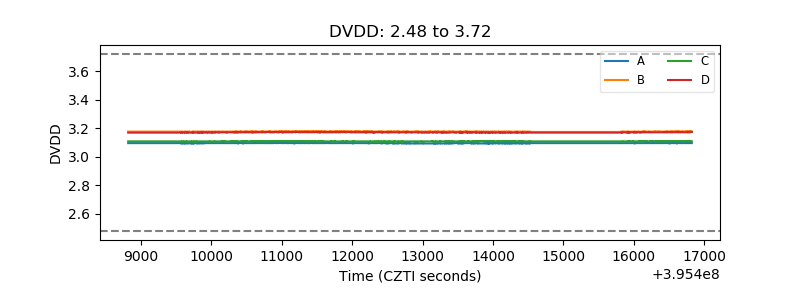 |
| Temperature 1 | 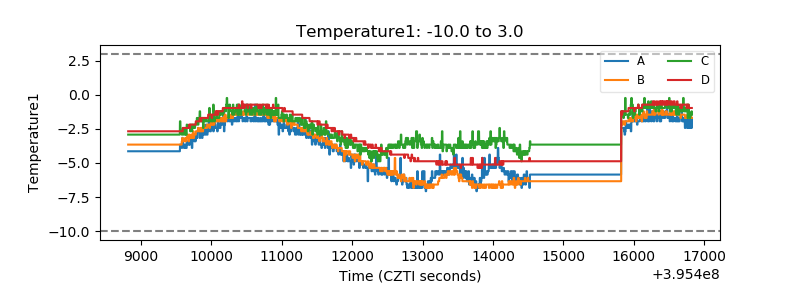 |
| Veto HV Monitor |  |
| Veto LLD | 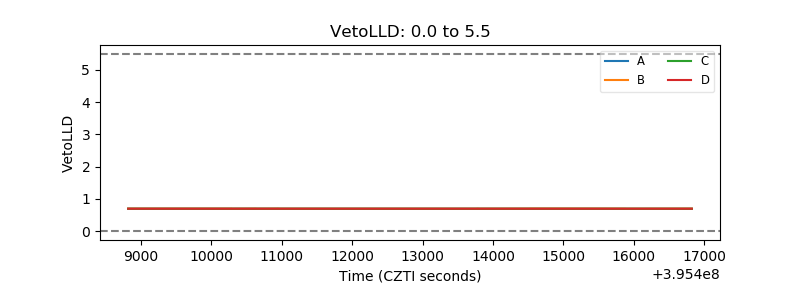 |
| Alpha Counter | 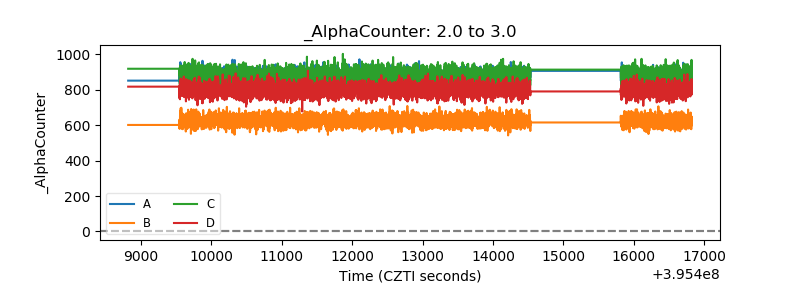 |
| _CPM_Rate | 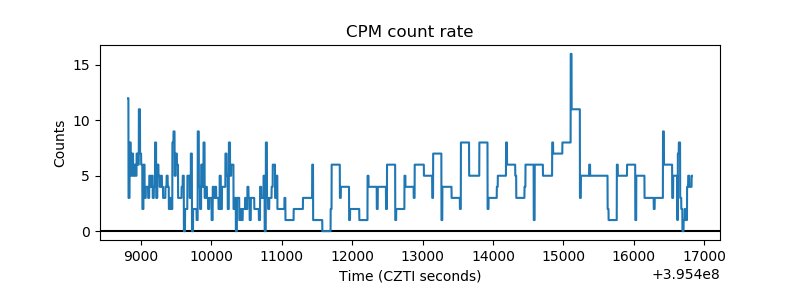 |
| CZT Counter | 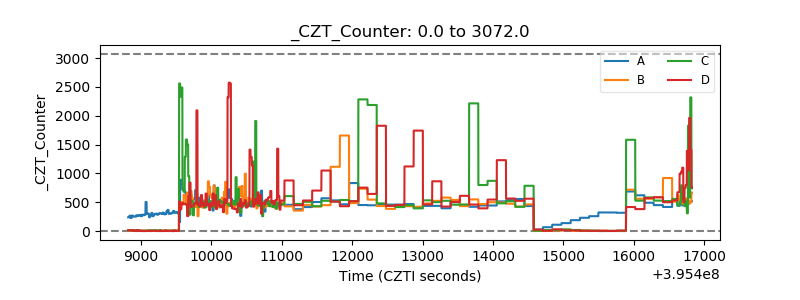 |
| +2.5 Volts monitor |  |
| +5 Volts monitor |  |
| _ROLL_ROT | 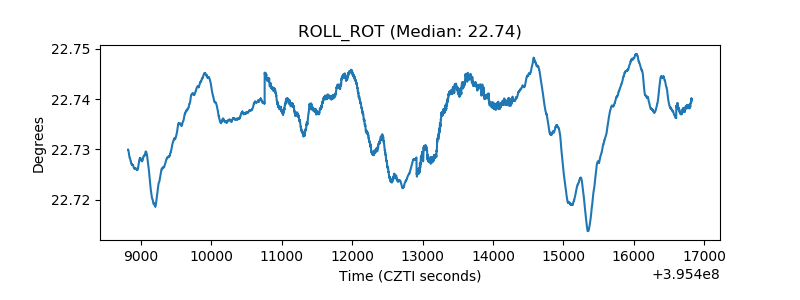 |
| _Roll_DEC | 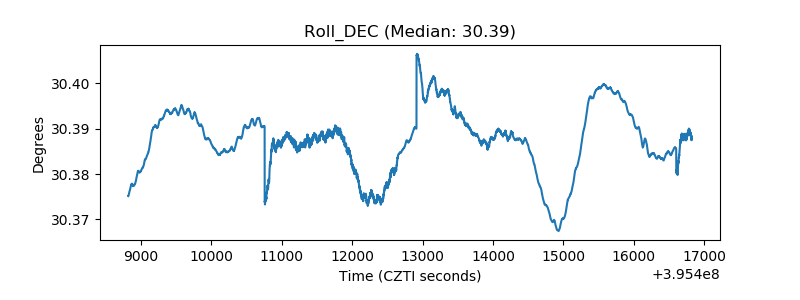 |
| _Roll_RA | 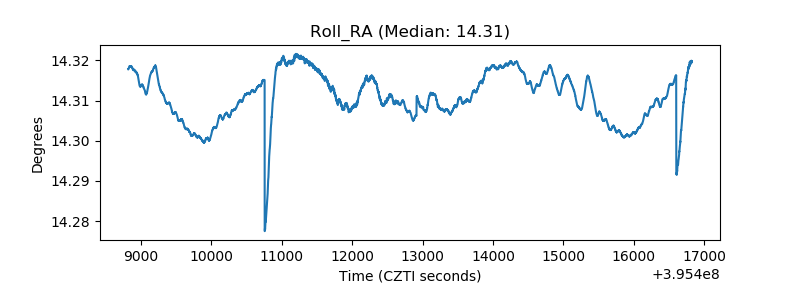 |
| Veto Counter | 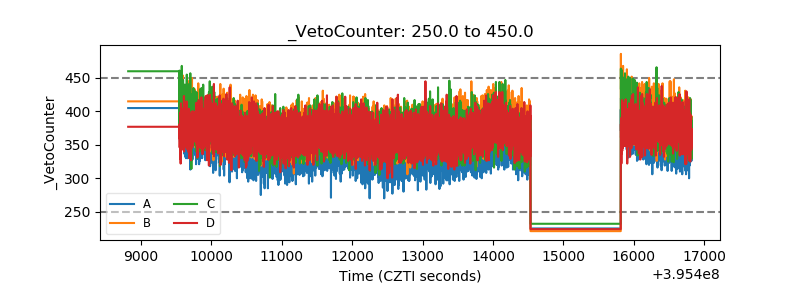 |