| Param | Original file | Final file |
|---|---|---|
| Filename | modeM0/AS1A11_101T01_9000005238_36718cztM0_level2.evt | modeM0/AS1A11_101T01_9000005238_36718cztM0_level2_quad_clean.evt |
| Size (bytes) | 1,224,354,240 | 202,314,240 |
| Size | 1.1 GB | 192.9 MB |
| Events in quadrant A | 7,578,276 | 1,291,456 |
| Events in quadrant B | 8,747,217 | 1,296,316 |
| Events in quadrant C | 9,410,174 | 1,261,635 |
| Events in quadrant D | 10,283,582 | 1,194,745 |
| Mode M0 | |||
|---|---|---|---|
| Quadrant | BADHDUFLAG | Total packets | Discarded packets |
| A | 0 | 32702 | 5 |
| B | 0 | 36164 | 4 |
| C | 0 | 37649 | 4 |
| D | 0 | 41219 | 4 |
| Mode SS | |||
|---|---|---|---|
| Quadrant | BADHDUFLAG | Total packets | Discarded packets |
| A | 0 | 320 | 0 |
| B | 0 | 320 | 0 |
| C | 0 | 320 | 0 |
| D | 0 | 320 | 0 |
| Mode M9 | |||
|---|---|---|---|
| Quadrant | BADHDUFLAG | Total packets | Discarded packets |
| A | 0 | 47 | 0 |
| B | 0 | 47 | 0 |
| C | 0 | 47 | 0 |
| D | 0 | 48 | 0 |
| Quadrant | Total seconds | Saturated seconds | Saturation percentage |
|---|---|---|---|
| A | 15703 | 43 | 0.273833% |
| B | 15703 | 308 | 1.961409% |
| C | 15703 | 459 | 2.923008% |
| D | 15703 | 636 | 4.050181% |
Noise dominated data is calculated using 1-second bins in cleaned event files. If a bin has >2000 counts, and if more than 50% of those come from <1% of pixels, then it is considered to be noise-dominated and hence unusable.
| Quadrant | # 1 sec bins | Bins with >0 counts | Bins with >2000 counts | High rate bins dominated by noise | Noise dominated (total time) | Noise dominated (detector-on time) | Marked lightcurve |
|---|---|---|---|---|---|---|---|
| A | 19821 | 15707 | 11 | 11 | 0.06% | 0.07% | 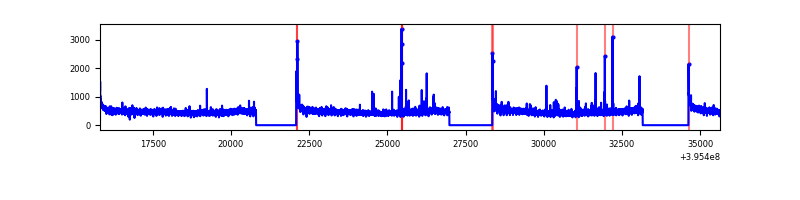 |
| B | 19821 | 15707 | 209 | 209 | 1.05% | 1.33% | 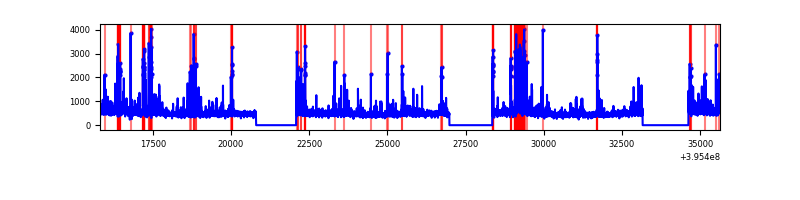 |
| C | 19821 | 15707 | 350 | 350 | 1.77% | 2.23% | 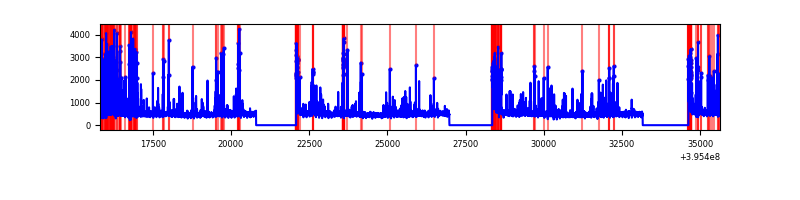 |
| D | 19821 | 15707 | 520 | 520 | 2.62% | 3.31% | 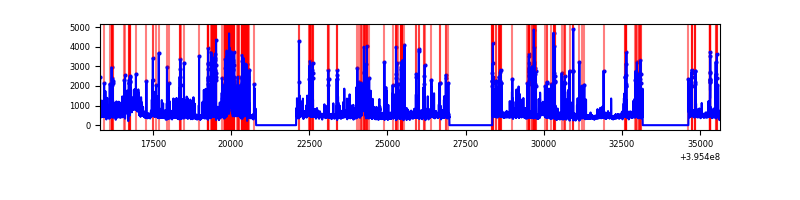 |
Top three noisy pixels from each quadrant. If the there are fewer than three noisy pixels in the level2.evt file, extra rows are filled as -1
| Pixel properties | Quadrant properties | ||||||
|---|---|---|---|---|---|---|---|
| Quadrant | DetID | PixID | Counts | Sigma | Mean | Median | Sigma |
| A | 10 | 83 | 563824 | 1568.58 | 1778 | 1742 | 358.3 |
| A | 9 | 143 | 109068 | 299.51 | 1778 | 1742 | 358.3 |
| A | 13 | 254 | 29489 | 77.43 | 1778 | 1742 | 358.3 |
| B | 5 | 255 | 792287 | 2358.66 | 1760 | 1712 | 335.2 |
| B | 0 | 189 | 377872 | 1122.26 | 1760 | 1712 | 335.2 |
| B | 4 | 171 | 155207 | 457.95 | 1760 | 1712 | 335.2 |
| C | 14 | 254 | 1136327 | 2857.17 | 1703 | 1711 | 397.1 |
| C | 0 | 10 | 897235 | 2255.09 | 1703 | 1711 | 397.1 |
| C | 15 | 214 | 698395 | 1754.38 | 1703 | 1711 | 397.1 |
| D | 12 | 233 | 1648485 | 3899.87 | 1707 | 1655 | 422.3 |
| D | 13 | 36 | 384893 | 907.55 | 1707 | 1655 | 422.3 |
| D | 2 | 250 | 333225 | 785.19 | 1707 | 1655 | 422.3 |
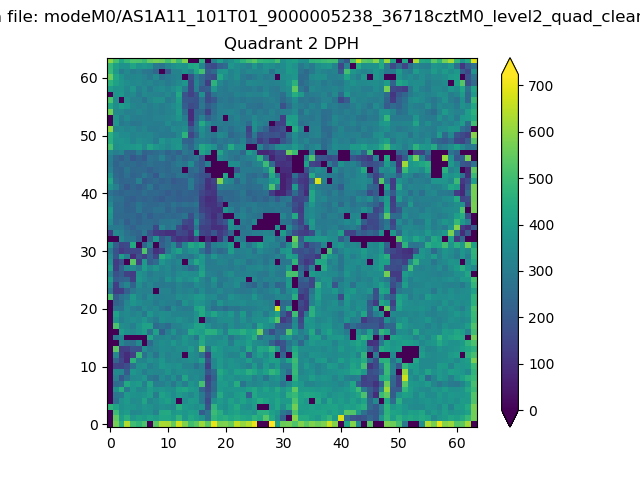
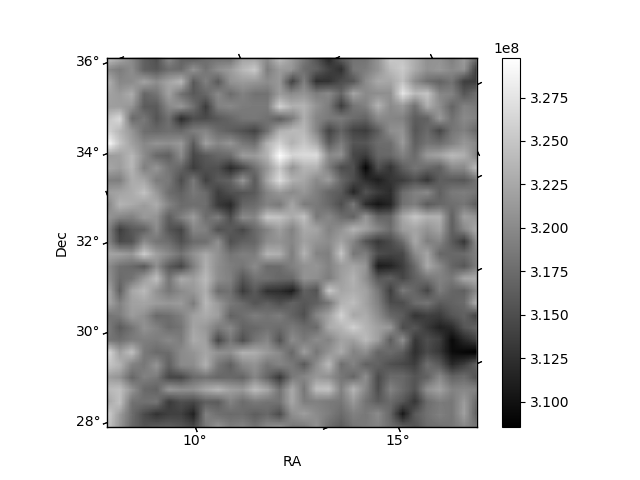
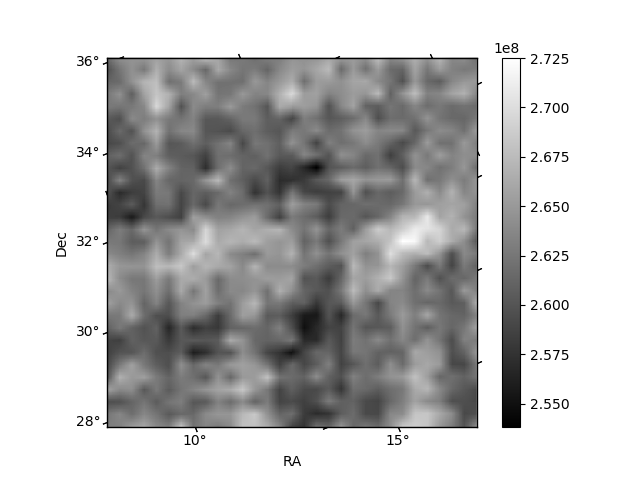
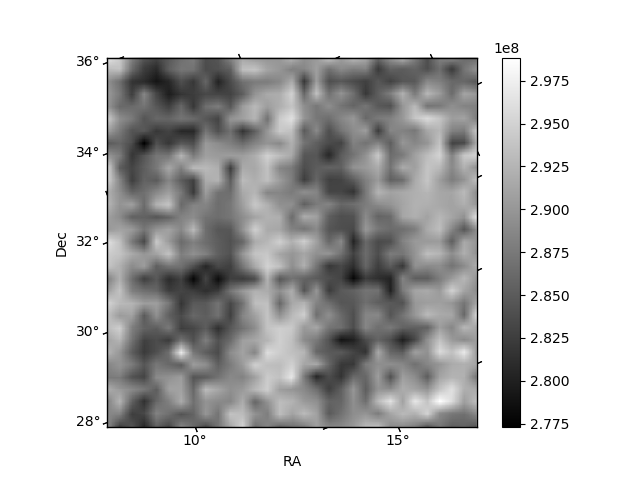
Histogram calculated using DETX and DETY for each event in the final _common_clean file
| Quadrant A |  |
 |
Quadrant B |
|---|---|---|---|
| Quadrant D | 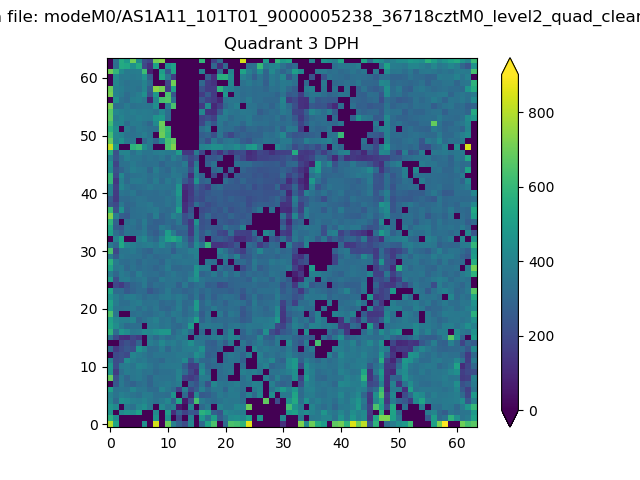 |
 |
Quadrant C |
| Plot type | Count rate plots | Images |
|---|---|---|
| Comparison with Poisson distribution Blue bars denote a histogram of data divided into 1 sec bins. Red curve is a Poisson curve with rate = median count rate of data. |
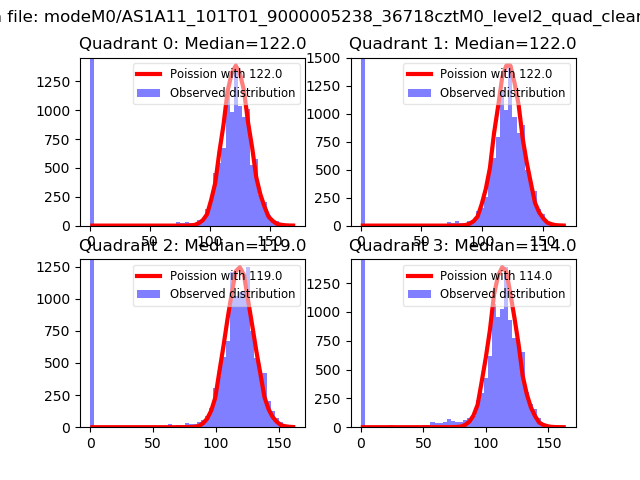 |
 |
| Quadrant-wise count rates Data is divided into 100 sec bins |
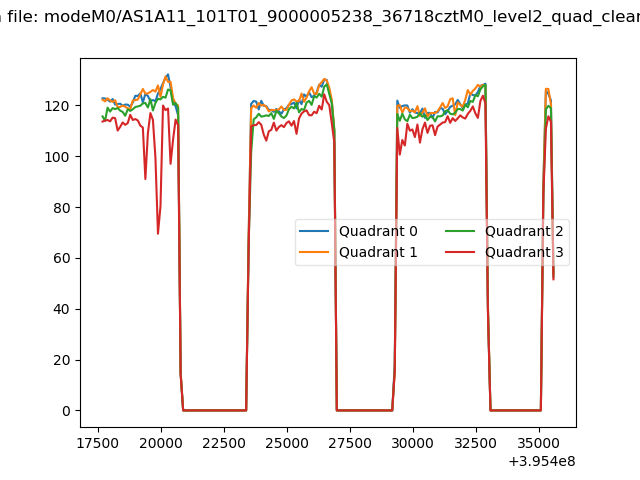 |
|
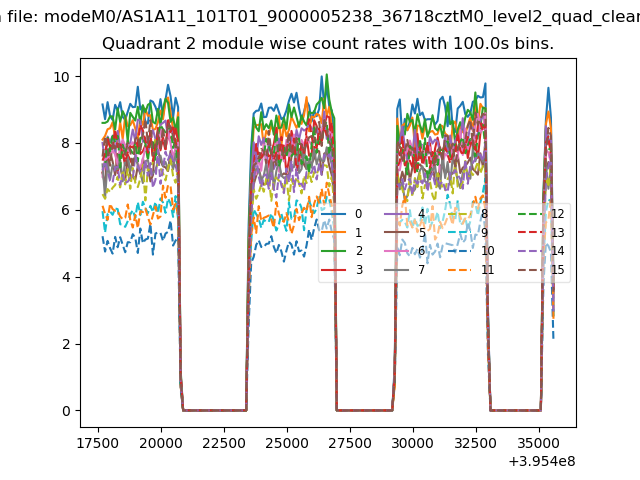
| Module-wise count rates for Quadrant A Data is divided into 100 sec bins |
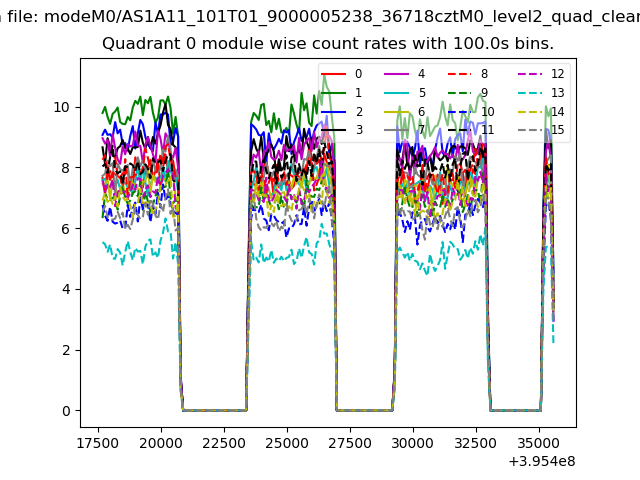 |
 |
| Module-wise count rates for Quadrant B Data is divided into 100 sec bins |
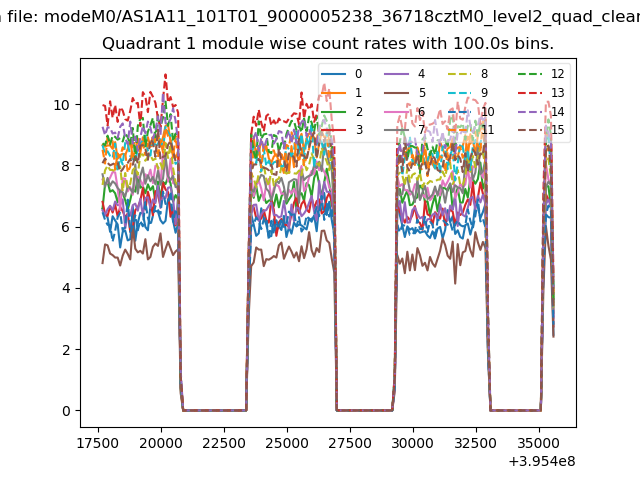 |
 |
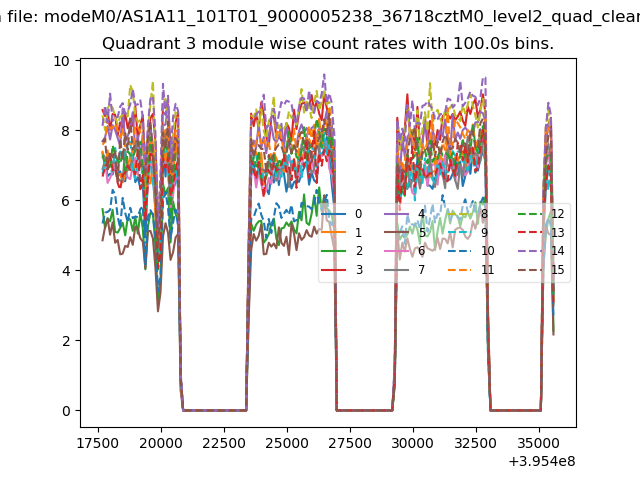
| Module-wise count rates for Quadrant C Data is divided into 100 sec bins |
 |
 |
| Module-wise count rates for Quadrant D Data is divided into 100 sec bins |
 |
 |
| Parameter | Plot |
|---|---|
| CZT HV Monitor | 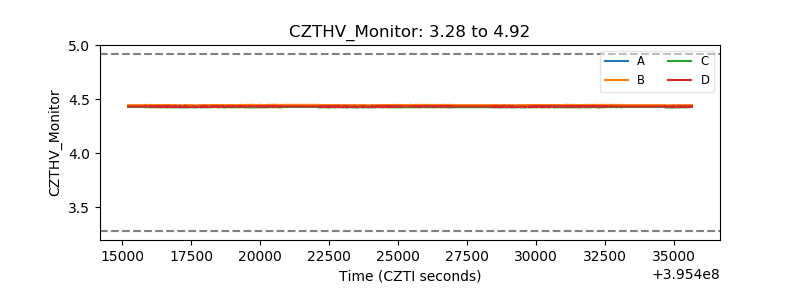 |
| D_VDD | 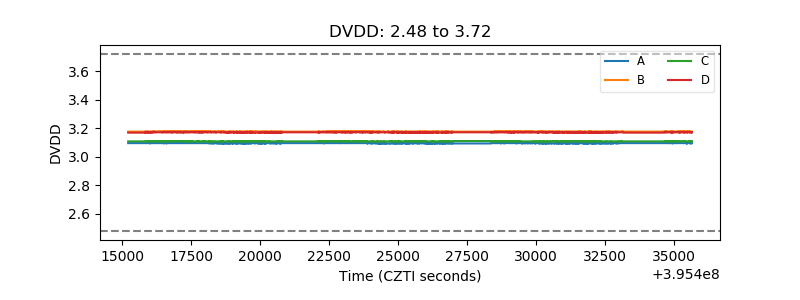 |
| Temperature 1 | 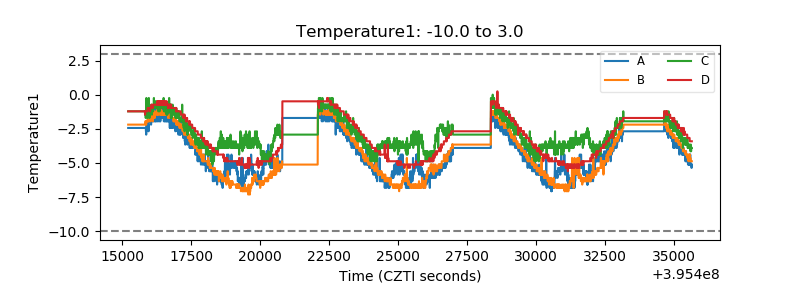 |
| Veto HV Monitor |  |
| Veto LLD | 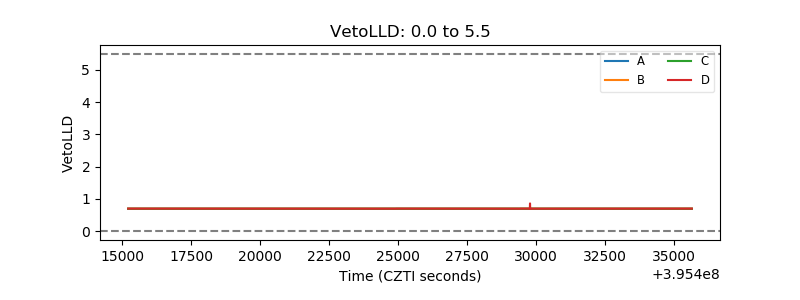 |
| Alpha Counter | 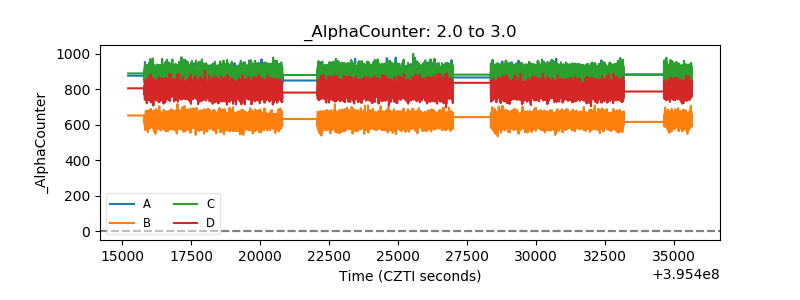 |
| _CPM_Rate |  |
| CZT Counter | 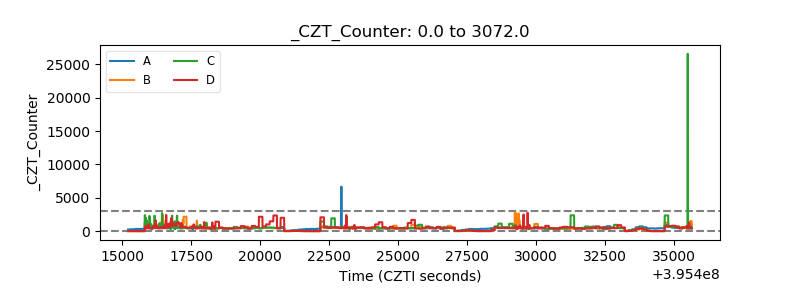 |
| +2.5 Volts monitor |  |
| +5 Volts monitor |  |
| _ROLL_ROT | 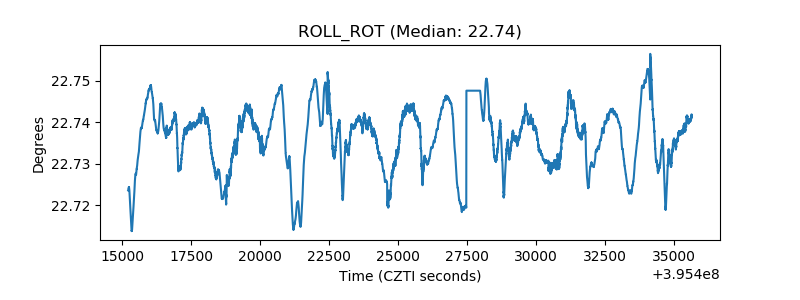 |
| _Roll_DEC | 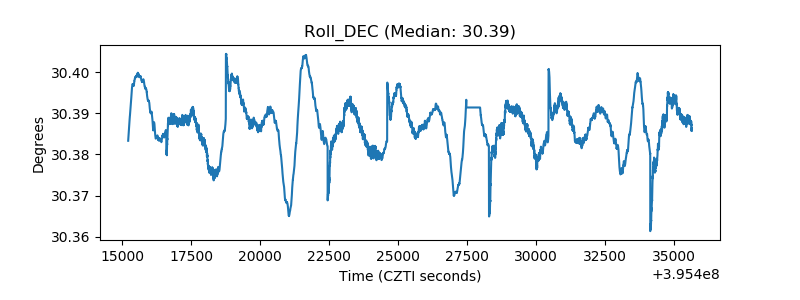 |
| _Roll_RA | 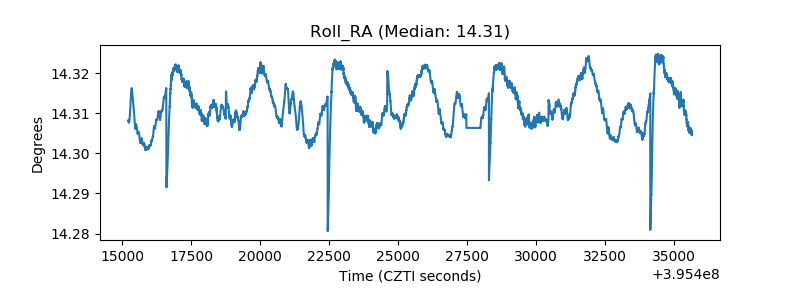 |
| Veto Counter | 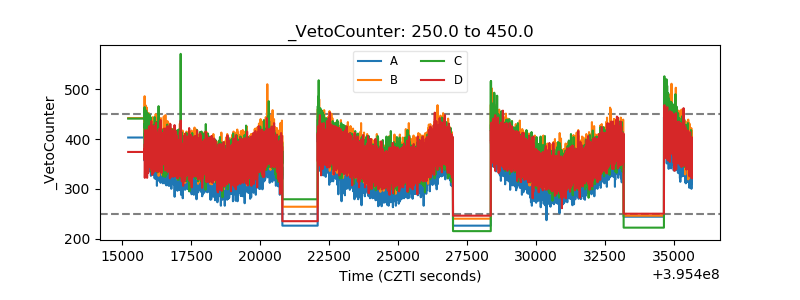 |