| Param | Original file | Final file |
|---|---|---|
| Filename | modeM0/AS1A11_101T01_9000005238_36719cztM0_level2.evt | modeM0/AS1A11_101T01_9000005238_36719cztM0_level2_quad_clean.evt |
| Size (bytes) | 436,587,840 | 82,382,400 |
| Size | 416.4 MB | 78.6 MB |
| Events in quadrant A | 2,755,464 | 536,101 |
| Events in quadrant B | 3,178,655 | 539,737 |
| Events in quadrant C | 3,550,433 | 524,946 |
| Events in quadrant D | 3,357,012 | 502,298 |
| Mode M0 | |||
|---|---|---|---|
| Quadrant | BADHDUFLAG | Total packets | Discarded packets |
| A | 0 | 11927 | 3 |
| B | 0 | 13108 | 2 |
| C | 0 | 14091 | 2 |
| D | 0 | 13758 | 2 |
| Mode SS | |||
|---|---|---|---|
| Quadrant | BADHDUFLAG | Total packets | Discarded packets |
| A | 0 | 114 | 0 |
| B | 0 | 114 | 0 |
| C | 0 | 114 | 0 |
| D | 0 | 114 | 0 |
| Mode M9 | |||
|---|---|---|---|
| Quadrant | BADHDUFLAG | Total packets | Discarded packets |
| A | 0 | 18 | 0 |
| B | 0 | 18 | 0 |
| C | 0 | 18 | 0 |
| D | 0 | 19 | 0 |
| Quadrant | Total seconds | Saturated seconds | Saturation percentage |
|---|---|---|---|
| A | 5599 | 23 | 0.410788% |
| B | 5599 | 92 | 1.643151% |
| C | 5599 | 235 | 4.197178% |
| D | 5599 | 138 | 2.464726% |
Noise dominated data is calculated using 1-second bins in cleaned event files. If a bin has >2000 counts, and if more than 50% of those come from <1% of pixels, then it is considered to be noise-dominated and hence unusable.
| Quadrant | # 1 sec bins | Bins with >0 counts | Bins with >2000 counts | High rate bins dominated by noise | Noise dominated (total time) | Noise dominated (detector-on time) | Marked lightcurve |
|---|---|---|---|---|---|---|---|
| A | 7212 | 5600 | 11 | 11 | 0.15% | 0.20% | 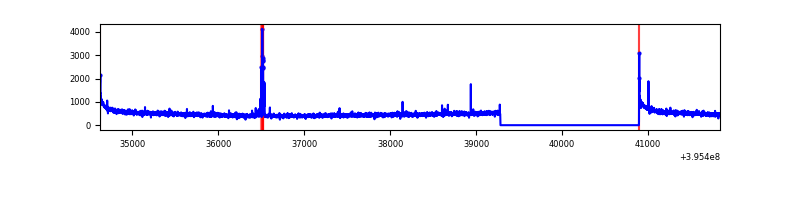 |
| B | 7212 | 5600 | 47 | 47 | 0.65% | 0.84% | 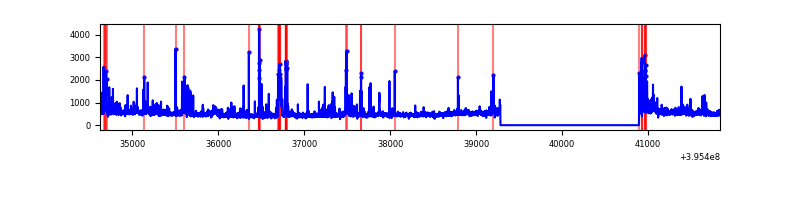 |
| C | 7212 | 5600 | 169 | 169 | 2.34% | 3.02% | 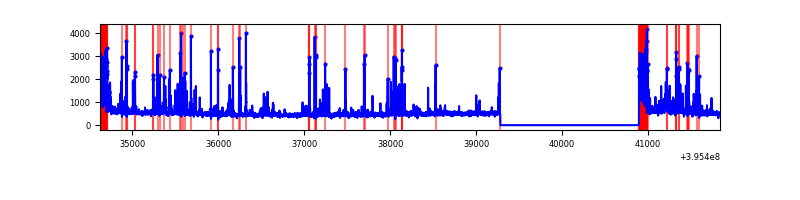 |
| D | 7212 | 5600 | 107 | 107 | 1.48% | 1.91% | 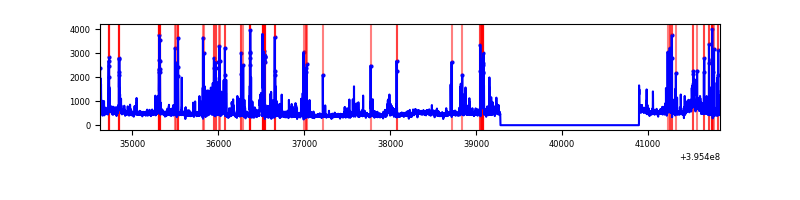 |
Top three noisy pixels from each quadrant. If the there are fewer than three noisy pixels in the level2.evt file, extra rows are filled as -1
| Pixel properties | Quadrant properties | ||||||
|---|---|---|---|---|---|---|---|
| Quadrant | DetID | PixID | Counts | Sigma | Mean | Median | Sigma |
| A | 10 | 83 | 228165 | 1748.32 | 635 | 622 | 130.1 |
| A | 15 | 223 | 49184 | 373.12 | 635 | 622 | 130.1 |
| A | 13 | 6 | 11648 | 84.72 | 635 | 622 | 130.1 |
| B | 5 | 255 | 273798 | 2222.89 | 633 | 616 | 122.9 |
| B | 0 | 221 | 111036 | 898.49 | 633 | 616 | 122.9 |
| B | 0 | 189 | 95180 | 769.47 | 633 | 616 | 122.9 |
| C | 14 | 254 | 470302 | 3263.79 | 608 | 611 | 143.9 |
| C | 0 | 10 | 401828 | 2787.98 | 608 | 611 | 143.9 |
| C | 15 | 214 | 248558 | 1722.94 | 608 | 611 | 143.9 |
| D | 2 | 153 | 164598 | 1076.8 | 615 | 596 | 152.3 |
| D | 13 | 249 | 164559 | 1076.55 | 615 | 596 | 152.3 |
| D | 12 | 233 | 154594 | 1011.12 | 615 | 596 | 152.3 |
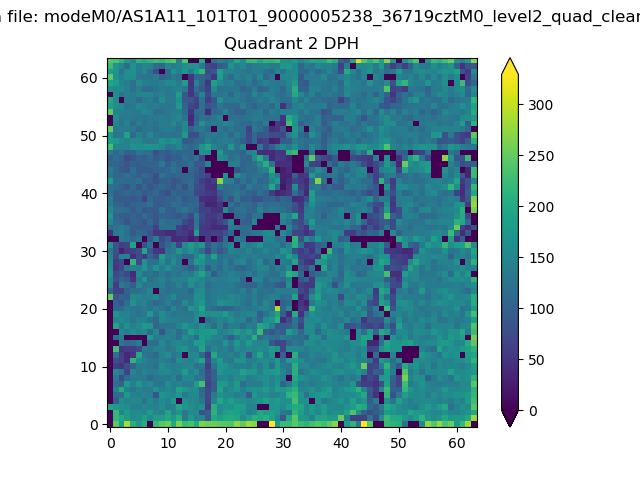
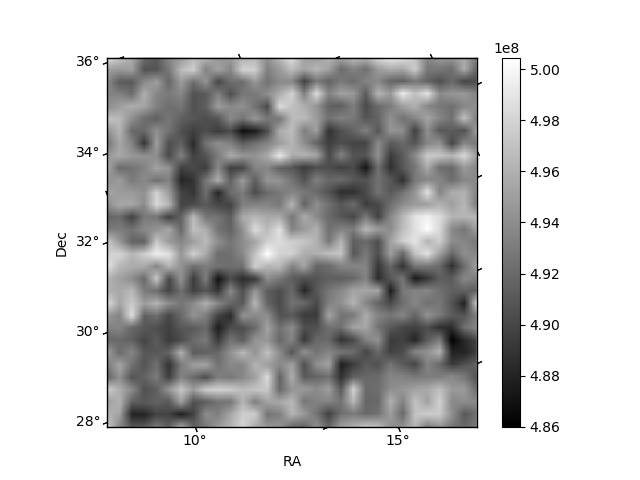
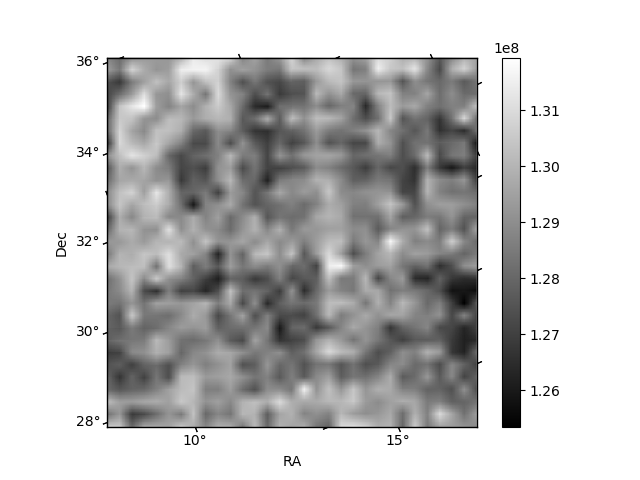
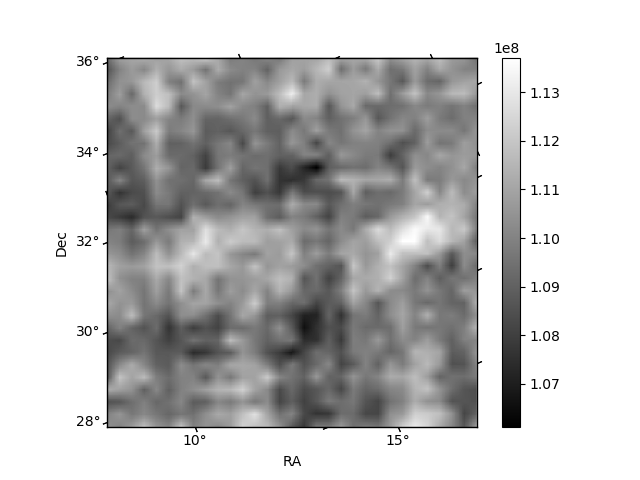
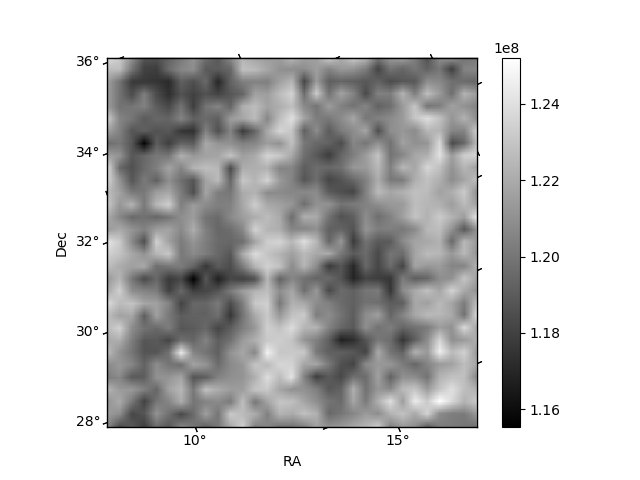
Histogram calculated using DETX and DETY for each event in the final _common_clean file
| Quadrant A | 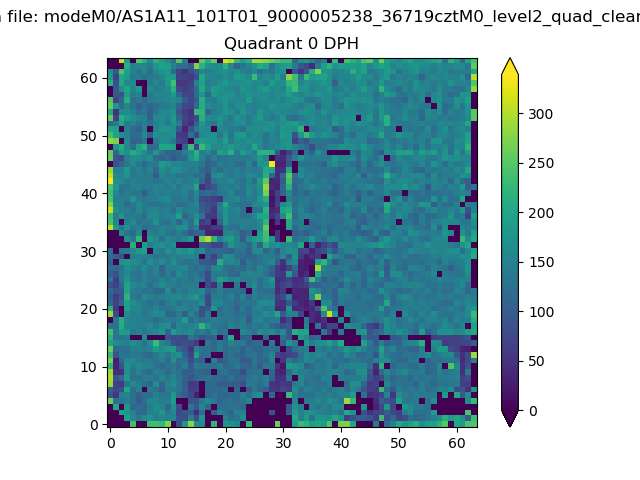 |
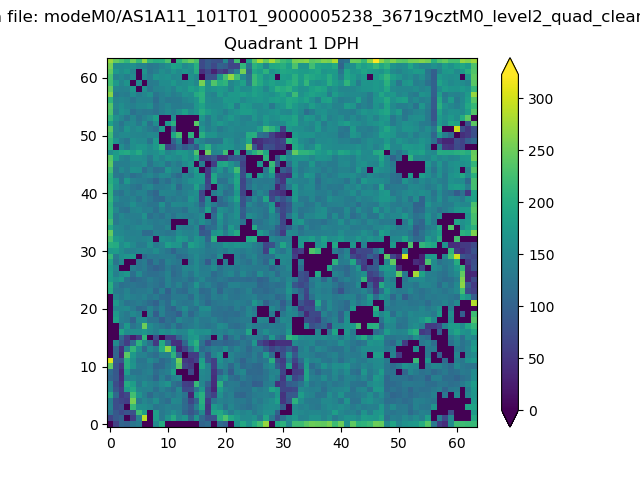 |
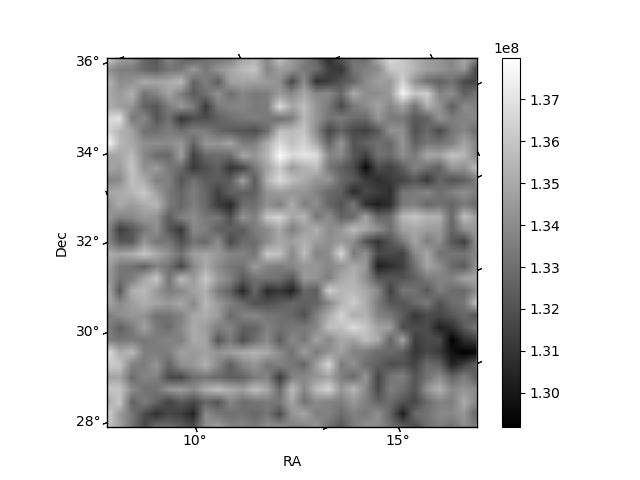
Quadrant B |
|---|---|---|---|
| Quadrant D | 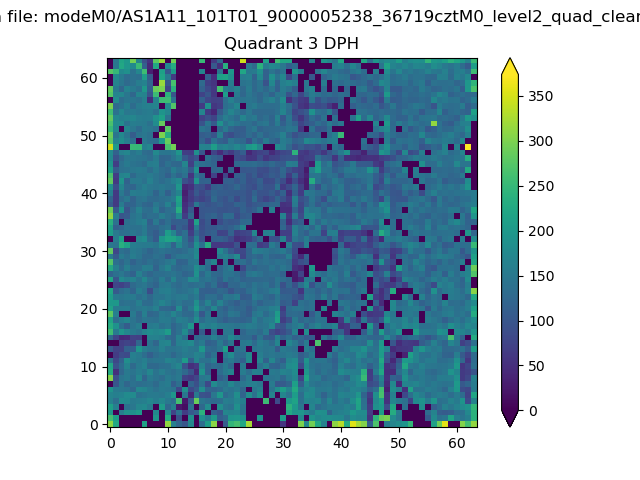 |
 |
Quadrant C |
| Plot type | Count rate plots | Images |
|---|---|---|
| Comparison with Poisson distribution Blue bars denote a histogram of data divided into 1 sec bins. Red curve is a Poisson curve with rate = median count rate of data. |
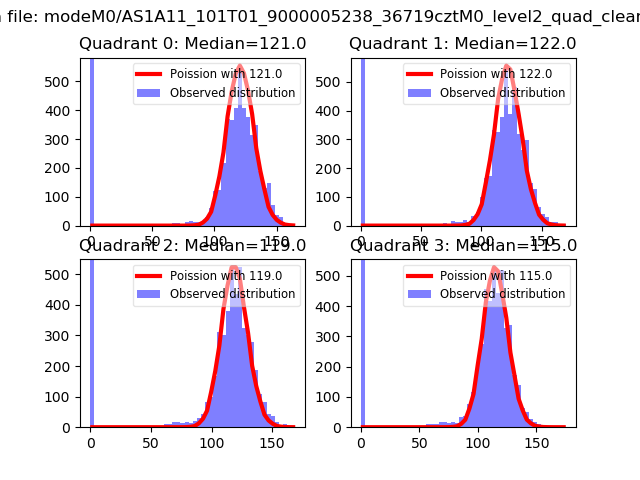 |
 |
| Quadrant-wise count rates Data is divided into 100 sec bins |
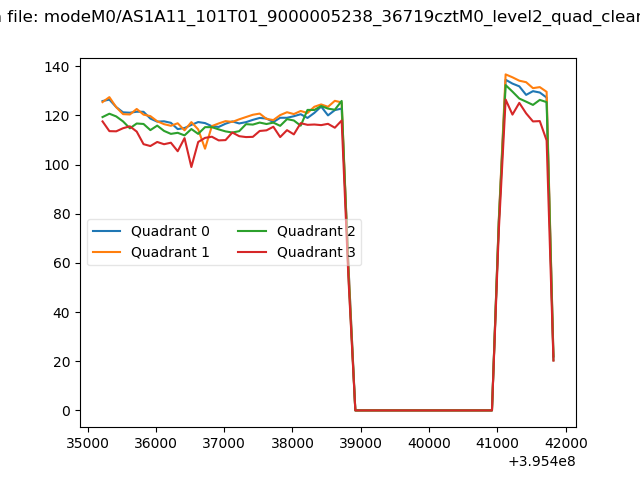 |
|
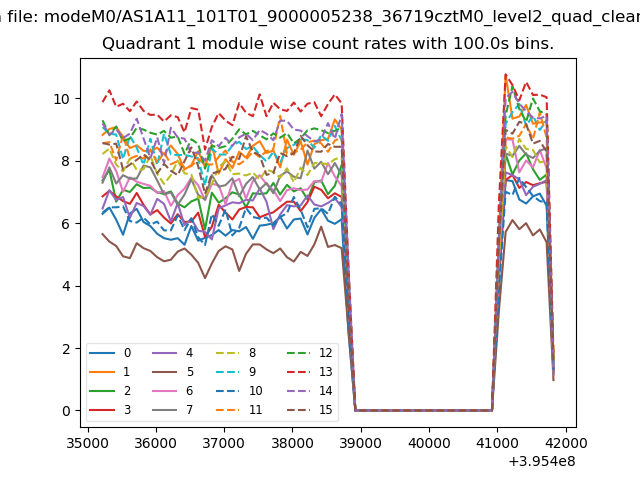
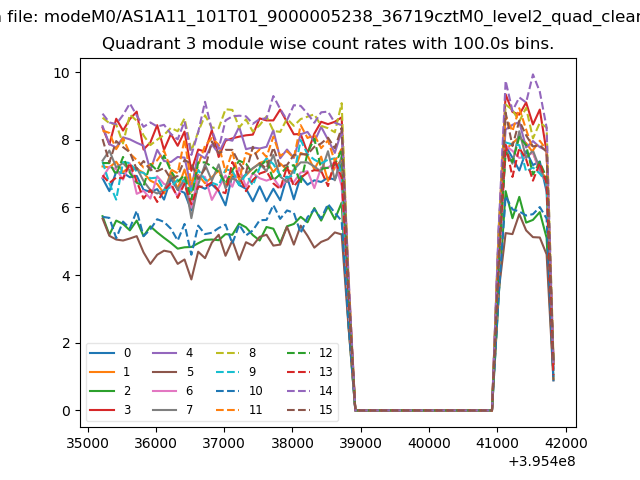
| Module-wise count rates for Quadrant A Data is divided into 100 sec bins |
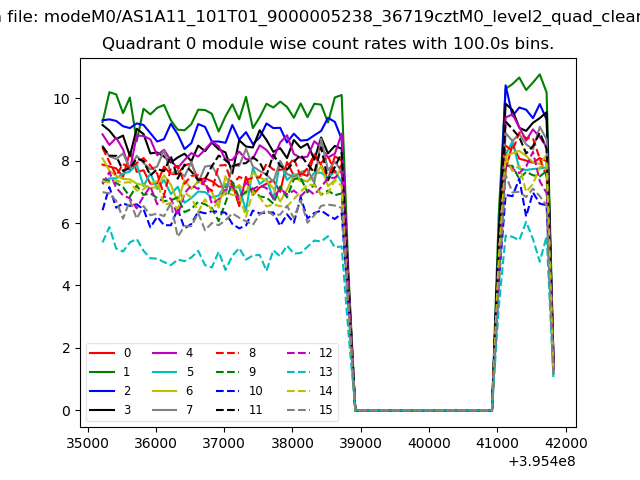 |
 |
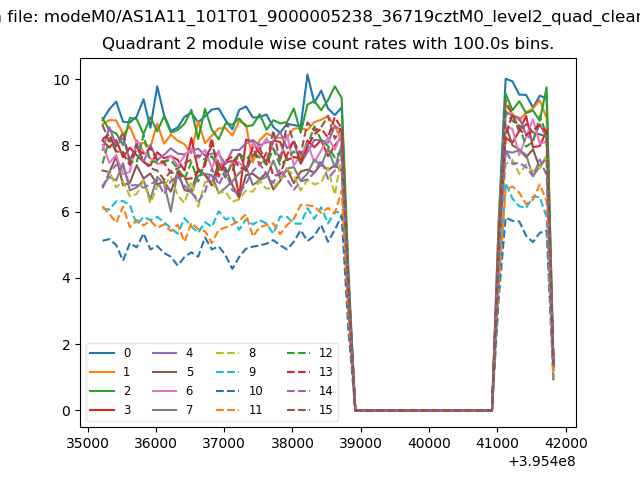
| Module-wise count rates for Quadrant B Data is divided into 100 sec bins |
 |
 |
| Module-wise count rates for Quadrant C Data is divided into 100 sec bins |
 |
 |
| Module-wise count rates for Quadrant D Data is divided into 100 sec bins |
 |
 |
| Parameter | Plot |
|---|---|
| CZT HV Monitor |  |
| D_VDD | 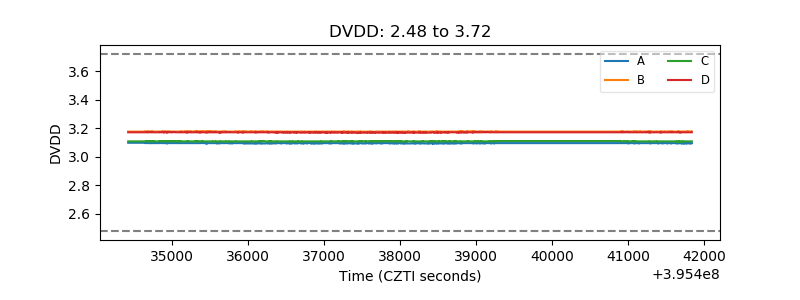 |
| Temperature 1 | 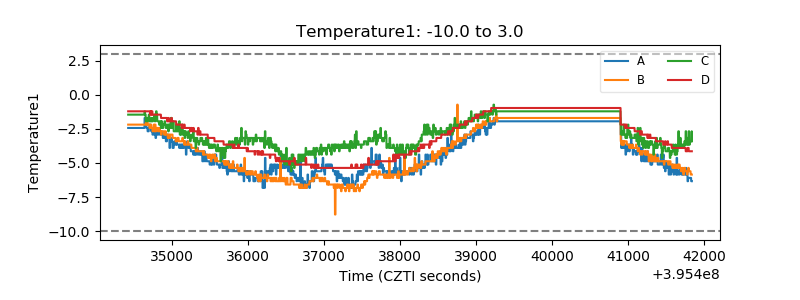 |
| Veto HV Monitor | 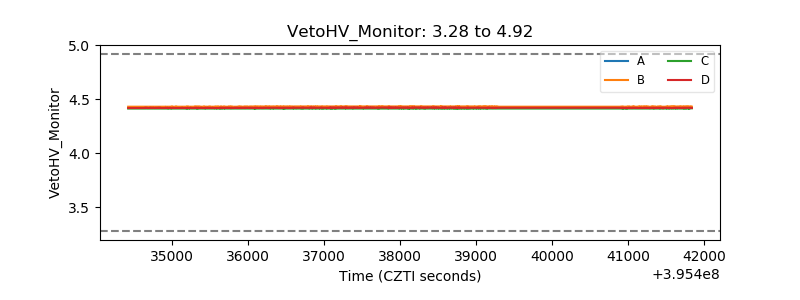 |
| Veto LLD | 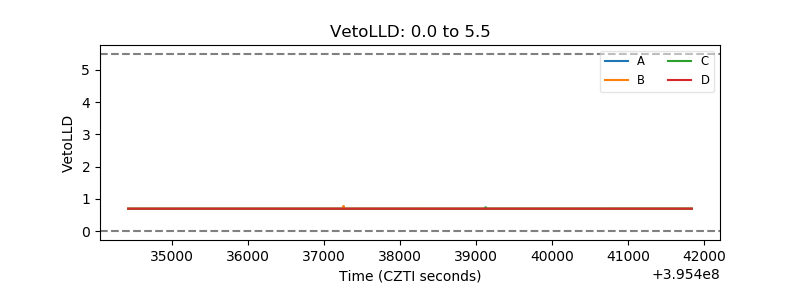 |
| Alpha Counter | 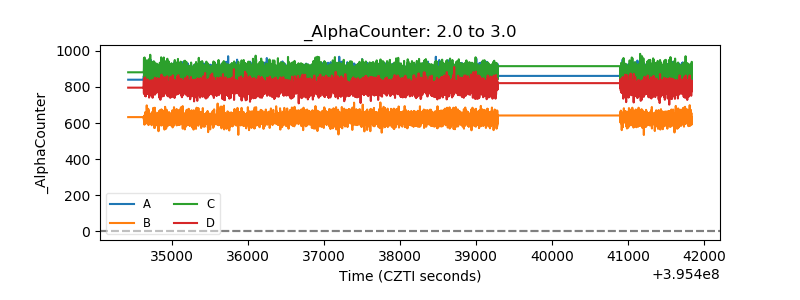 |
| _CPM_Rate | 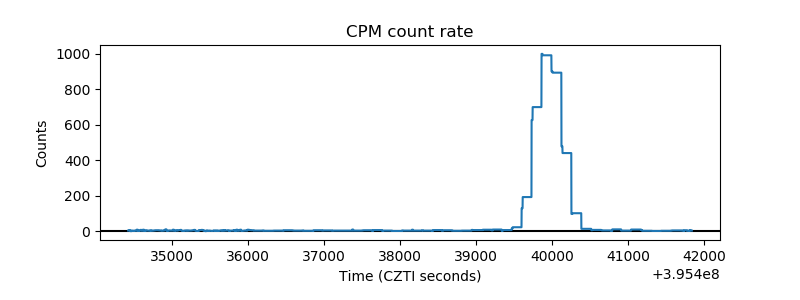 |
| CZT Counter | 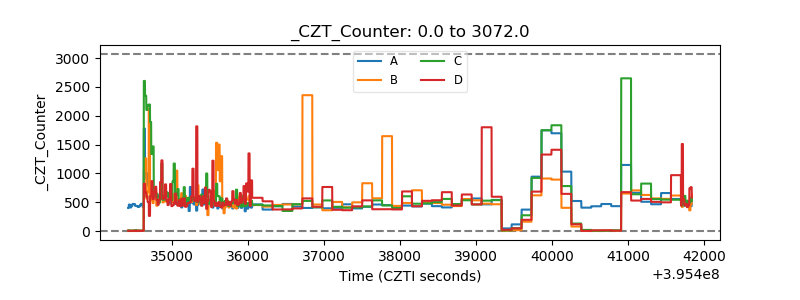 |
| +2.5 Volts monitor |  |
| +5 Volts monitor |  |
| _ROLL_ROT | 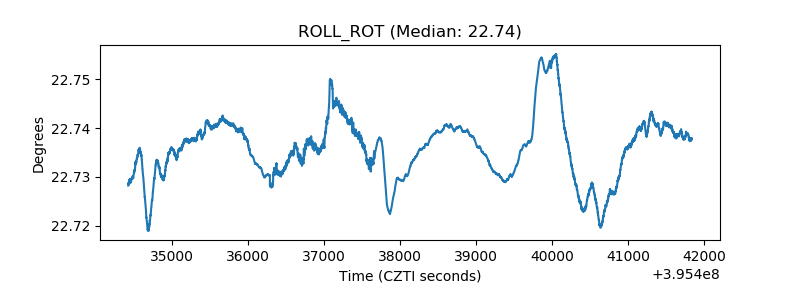 |
| _Roll_DEC | 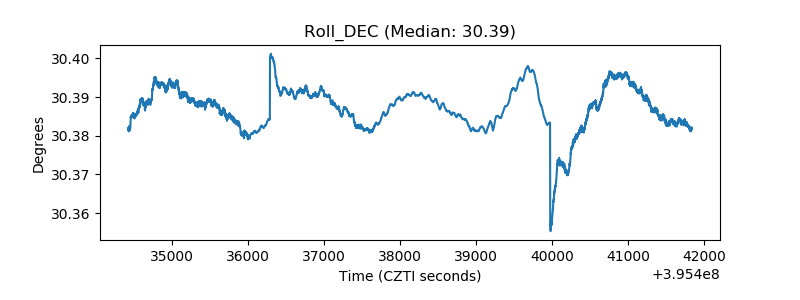 |
| _Roll_RA | 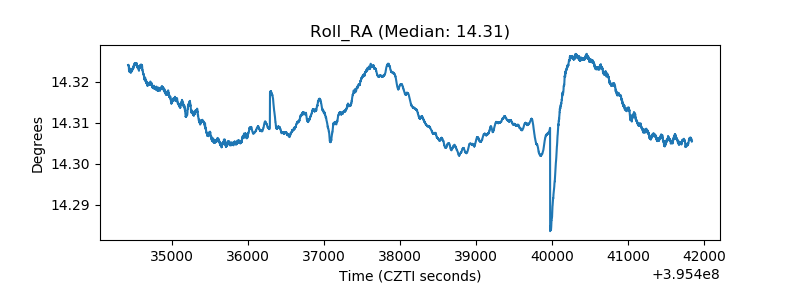 |
| Veto Counter | 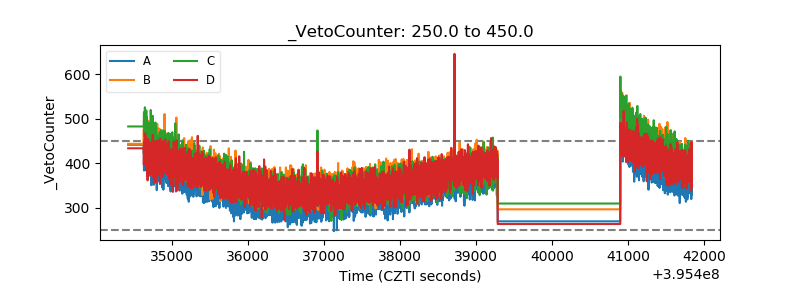 |