| Param | Original file | Final file |
|---|---|---|
| Filename | modeM0/AS1A11_101T01_9000005238_36721cztM0_level2.evt | modeM0/AS1A11_101T01_9000005238_36721cztM0_level2_quad_clean.evt |
| Size (bytes) | 418,276,800 | 84,801,600 |
| Size | 398.9 MB | 80.9 MB |
| Events in quadrant A | 2,593,598 | 556,876 |
| Events in quadrant B | 2,840,706 | 567,279 |
| Events in quadrant C | 3,623,234 | 543,340 |
| Events in quadrant D | 3,245,724 | 525,323 |
| Mode M0 | |||
|---|---|---|---|
| Quadrant | BADHDUFLAG | Total packets | Discarded packets |
| A | 0 | 11340 | 3 |
| B | 0 | 11851 | 2 |
| C | 0 | 14220 | 2 |
| D | 0 | 13349 | 2 |
| Mode SS | |||
|---|---|---|---|
| Quadrant | BADHDUFLAG | Total packets | Discarded packets |
| A | 0 | 110 | 0 |
| B | 0 | 110 | 0 |
| C | 0 | 110 | 0 |
| D | 0 | 110 | 0 |
| Mode M9 | |||
|---|---|---|---|
| Quadrant | BADHDUFLAG | Total packets | Discarded packets |
| A | 0 | 30 | 0 |
| B | 0 | 30 | 0 |
| C | 0 | 30 | 0 |
| D | 0 | 31 | 0 |
| Quadrant | Total seconds | Saturated seconds | Saturation percentage |
|---|---|---|---|
| A | 5355 | 15 | 0.280112% |
| B | 5355 | 55 | 1.027077% |
| C | 5355 | 338 | 6.311858% |
| D | 5355 | 117 | 2.184874% |
Noise dominated data is calculated using 1-second bins in cleaned event files. If a bin has >2000 counts, and if more than 50% of those come from <1% of pixels, then it is considered to be noise-dominated and hence unusable.
| Quadrant | # 1 sec bins | Bins with >0 counts | Bins with >2000 counts | High rate bins dominated by noise | Noise dominated (total time) | Noise dominated (detector-on time) | Marked lightcurve |
|---|---|---|---|---|---|---|---|
| A | 7088 | 5356 | 7 | 7 | 0.10% | 0.13% | 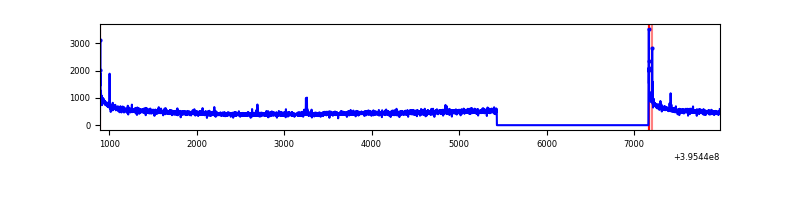 |
| B | 7088 | 5356 | 28 | 28 | 0.40% | 0.52% | 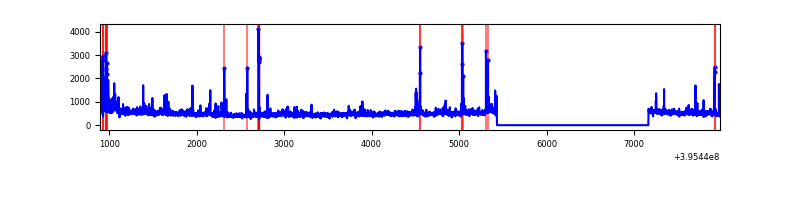 |
| C | 7088 | 5356 | 246 | 246 | 3.47% | 4.59% | 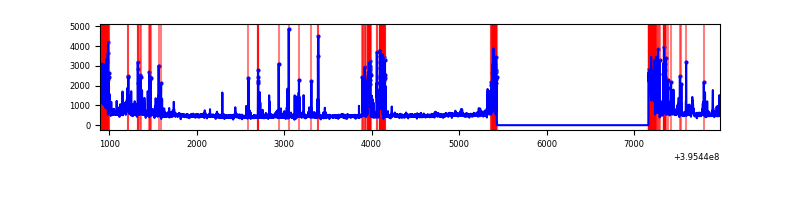 |
| D | 7088 | 5356 | 107 | 107 | 1.51% | 2.00% | 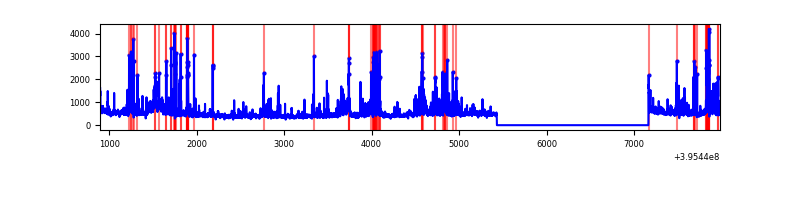 |
Top three noisy pixels from each quadrant. If the there are fewer than three noisy pixels in the level2.evt file, extra rows are filled as -1
| Pixel properties | Quadrant properties | ||||||
|---|---|---|---|---|---|---|---|
| Quadrant | DetID | PixID | Counts | Sigma | Mean | Median | Sigma |
| A | 10 | 83 | 214531 | 1722.69 | 607 | 595 | 124.2 |
| A | 9 | 143 | 21509 | 168.41 | 607 | 595 | 124.2 |
| A | 13 | 6 | 9667 | 73.05 | 607 | 595 | 124.2 |
| B | 0 | 221 | 108015 | 921.76 | 608 | 593 | 116.5 |
| B | 0 | 189 | 99717 | 850.55 | 608 | 593 | 116.5 |
| B | 5 | 255 | 67834 | 576.98 | 608 | 593 | 116.5 |
| C | 14 | 254 | 651332 | 4794.38 | 580 | 584 | 135.7 |
| C | 0 | 10 | 425805 | 3132.81 | 580 | 584 | 135.7 |
| C | 15 | 214 | 235982 | 1734.29 | 580 | 584 | 135.7 |
| D | 12 | 233 | 206913 | 1434.38 | 588 | 572 | 143.9 |
| D | 13 | 171 | 146547 | 1014.75 | 588 | 572 | 143.9 |
| D | 12 | 6 | 142838 | 988.96 | 588 | 572 | 143.9 |
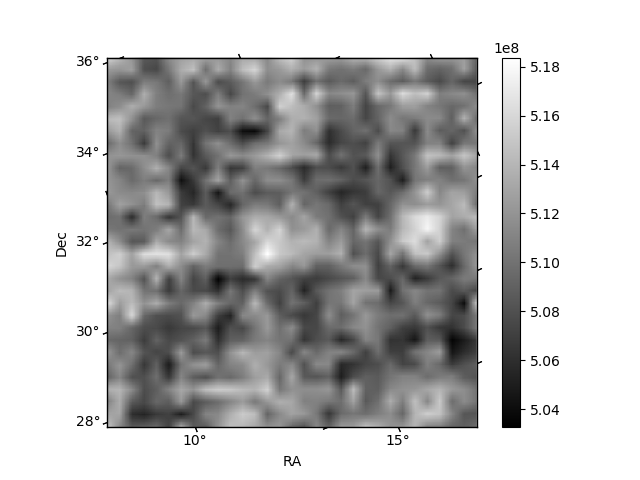
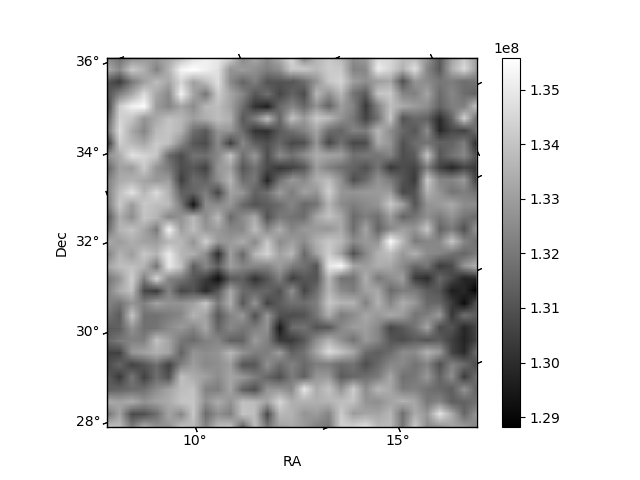
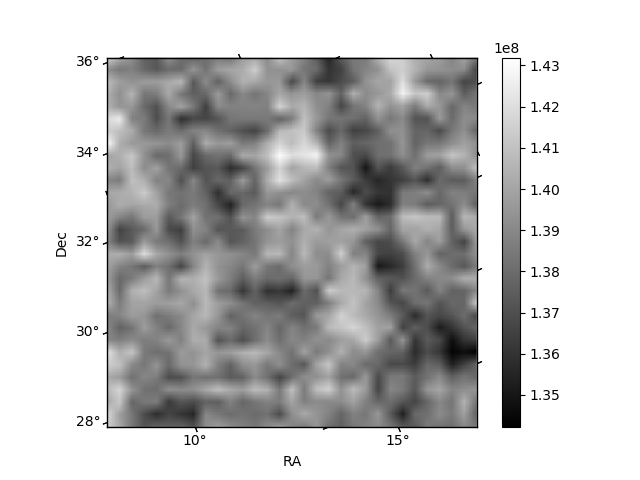
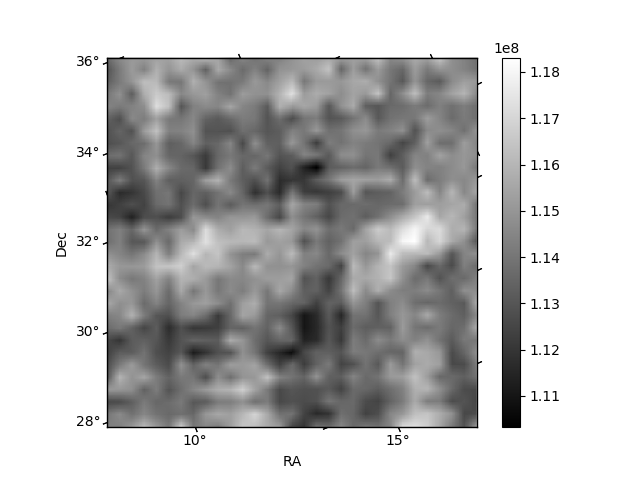
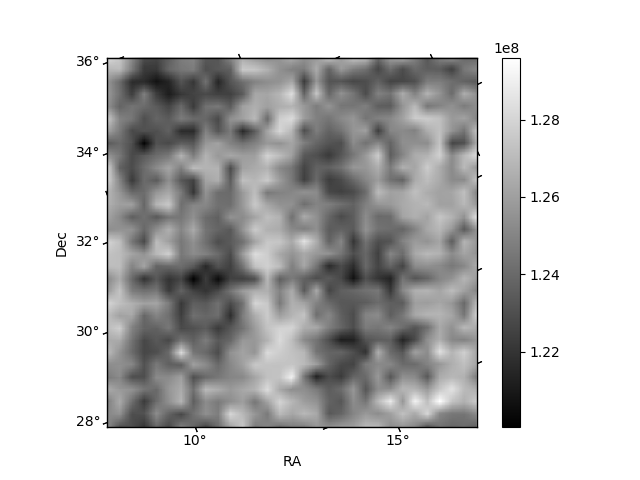
Histogram calculated using DETX and DETY for each event in the final _common_clean file
| Quadrant A | 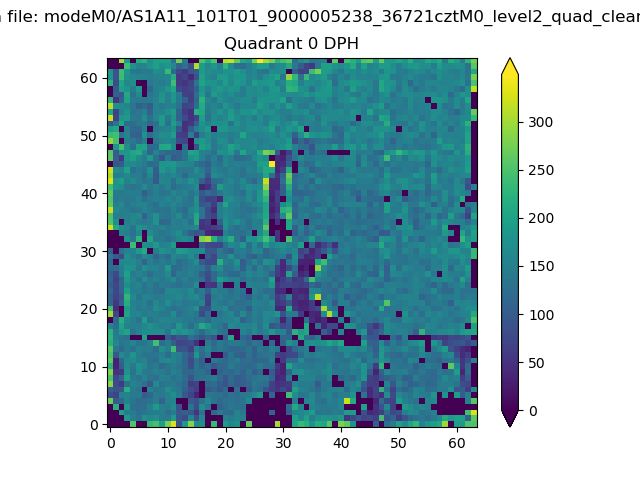 |
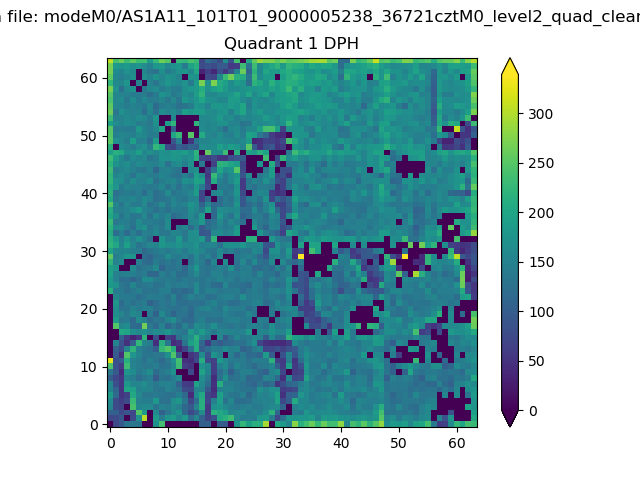 |
Quadrant B |
|---|---|---|---|
| Quadrant D | 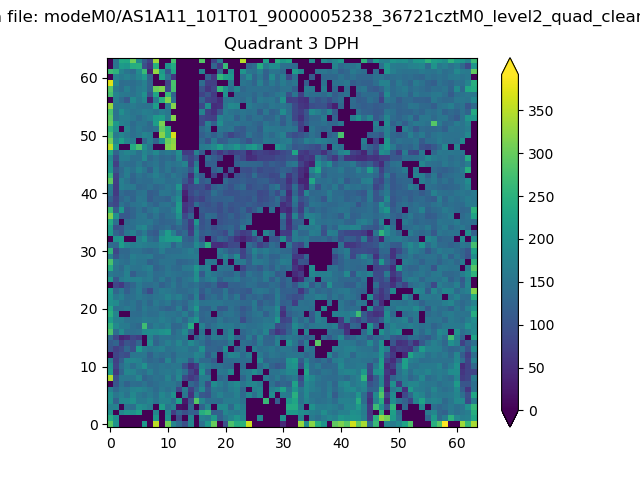 |
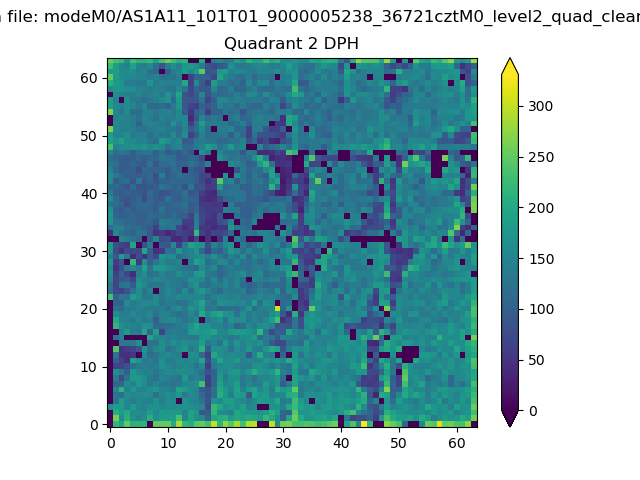 |
Quadrant C |
| Plot type | Count rate plots | Images |
|---|---|---|
| Comparison with Poisson distribution Blue bars denote a histogram of data divided into 1 sec bins. Red curve is a Poisson curve with rate = median count rate of data. |
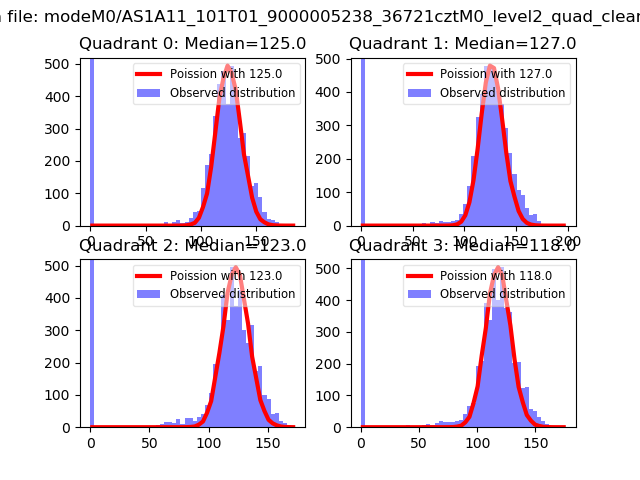 |
 |
| Quadrant-wise count rates Data is divided into 100 sec bins |
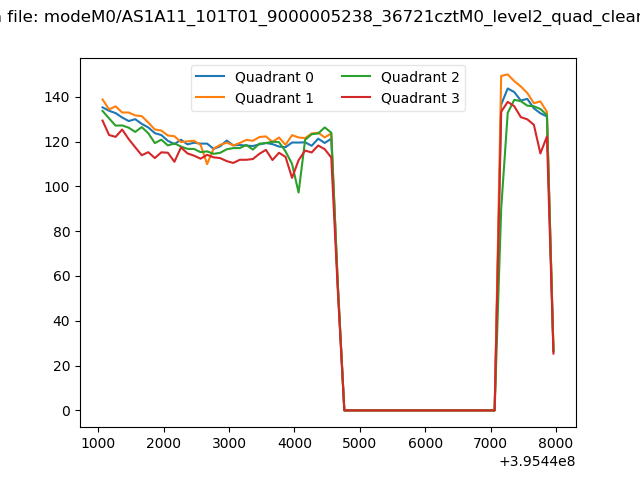 |
|
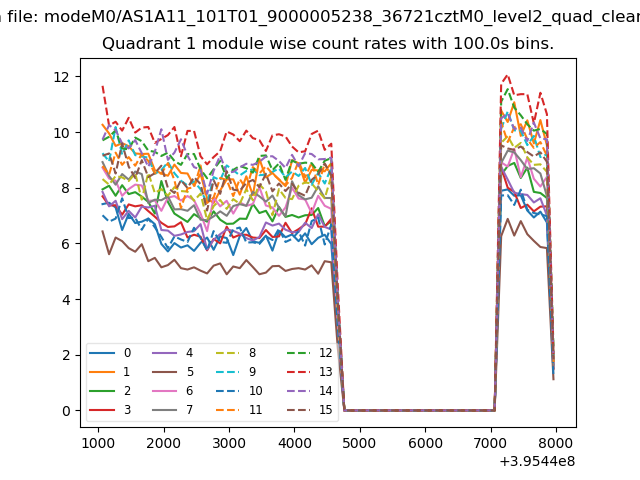
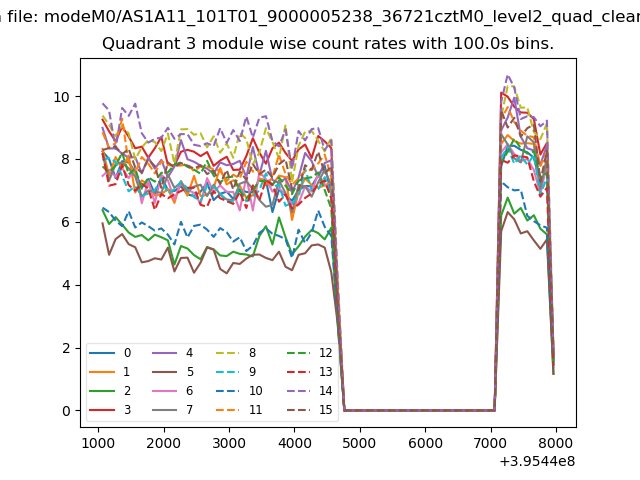
| Module-wise count rates for Quadrant A Data is divided into 100 sec bins |
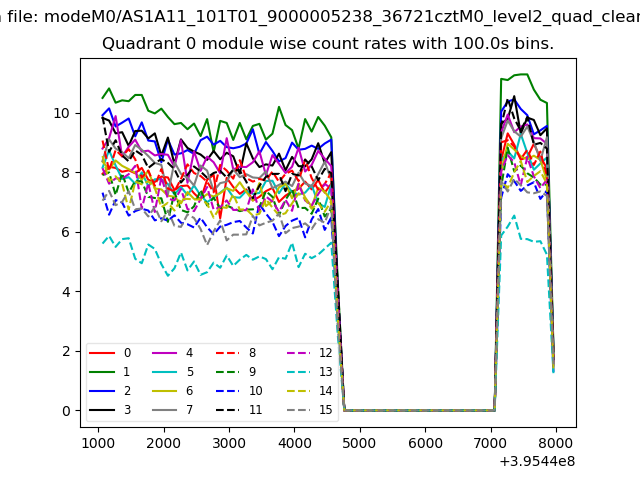 |
 |
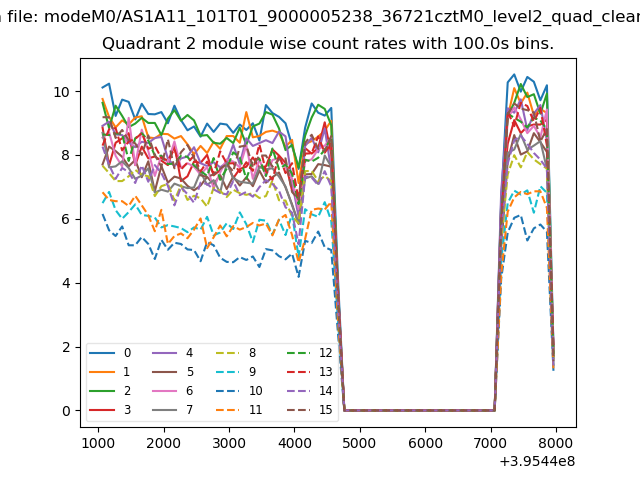
| Module-wise count rates for Quadrant B Data is divided into 100 sec bins |
 |
 |
| Module-wise count rates for Quadrant C Data is divided into 100 sec bins |
 |
 |
| Module-wise count rates for Quadrant D Data is divided into 100 sec bins |
 |
 |
| Parameter | Plot |
|---|---|
| CZT HV Monitor | 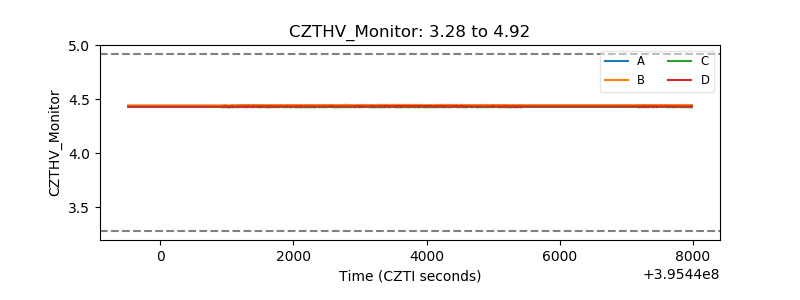 |
| D_VDD | 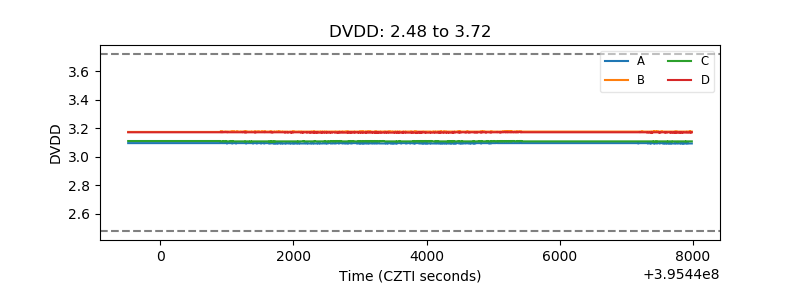 |
| Temperature 1 | 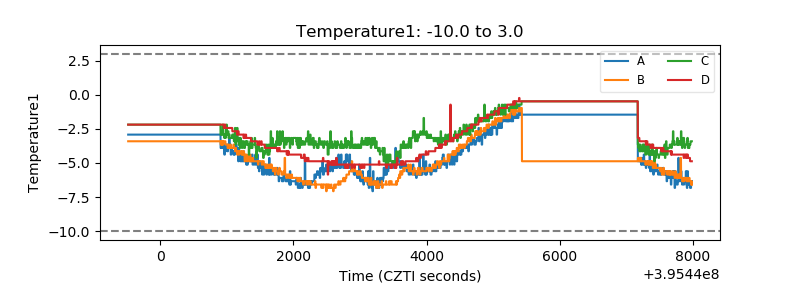 |
| Veto HV Monitor | 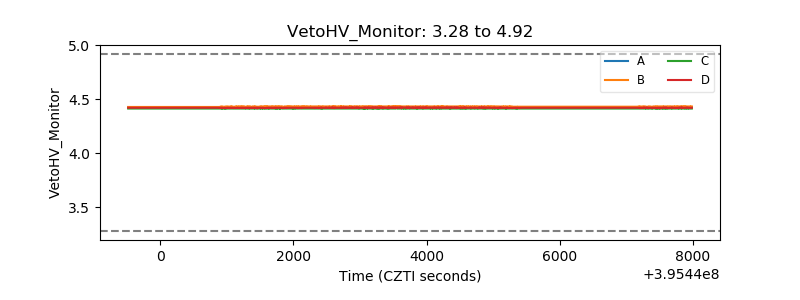 |
| Veto LLD | 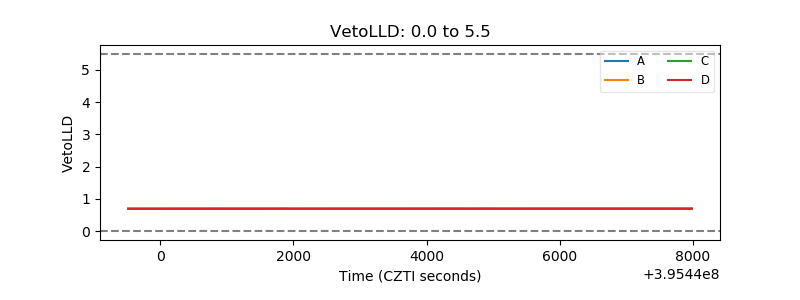 |
| Alpha Counter | 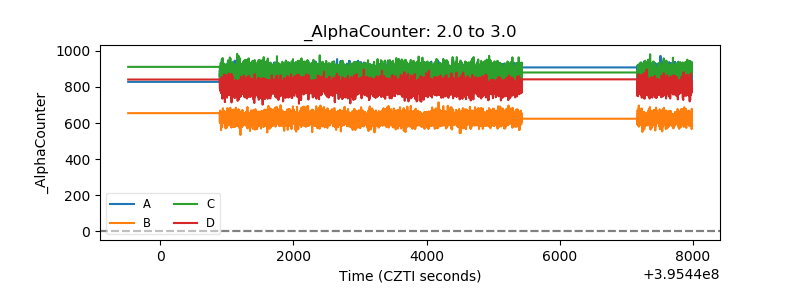 |
| _CPM_Rate | 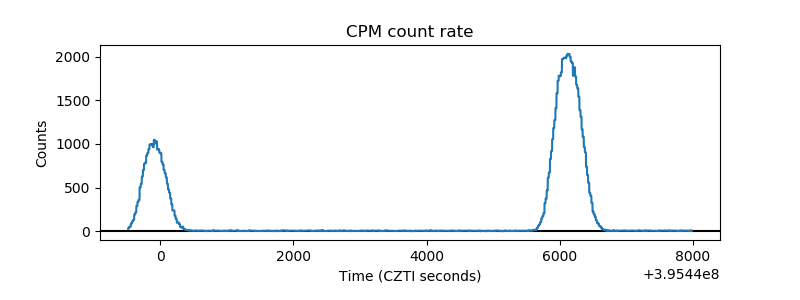 |
| CZT Counter | 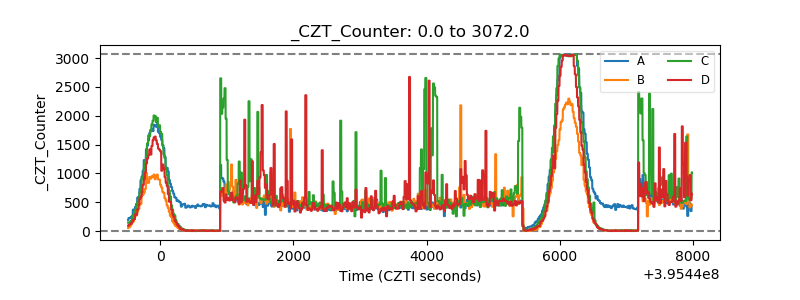 |
| +2.5 Volts monitor |  |
| +5 Volts monitor |  |
| _ROLL_ROT | 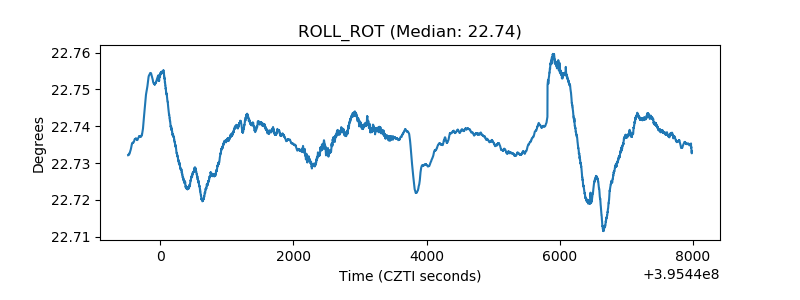 |
| _Roll_DEC | 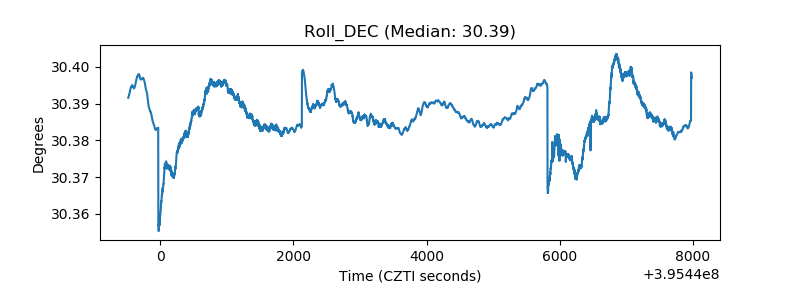 |
| _Roll_RA | 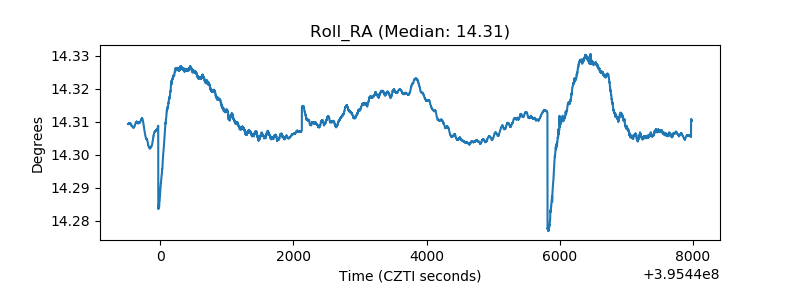 |
| Veto Counter |  |