| Param | Original file | Final file |
|---|---|---|
| Filename | modeM0/AS1A11_101T01_9000005238_36722cztM0_level2.evt | modeM0/AS1A11_101T01_9000005238_36722cztM0_level2_quad_clean.evt |
| Size (bytes) | 399,214,080 | 81,650,880 |
| Size | 380.7 MB | 77.9 MB |
| Events in quadrant A | 2,518,102 | 536,293 |
| Events in quadrant B | 2,833,120 | 549,156 |
| Events in quadrant C | 3,657,535 | 513,244 |
| Events in quadrant D | 2,730,958 | 512,685 |
| Mode M0 | |||
|---|---|---|---|
| Quadrant | BADHDUFLAG | Total packets | Discarded packets |
| A | 0 | 10879 | 3 |
| B | 0 | 11757 | 2 |
| C | 0 | 14134 | 2 |
| D | 0 | 11735 | 2 |
| Mode SS | |||
|---|---|---|---|
| Quadrant | BADHDUFLAG | Total packets | Discarded packets |
| A | 0 | 104 | 0 |
| B | 0 | 104 | 0 |
| C | 0 | 104 | 0 |
| D | 0 | 104 | 0 |
| Mode M9 | |||
|---|---|---|---|
| Quadrant | BADHDUFLAG | Total packets | Discarded packets |
| A | 0 | 25 | 0 |
| B | 0 | 25 | 0 |
| C | 0 | 25 | 0 |
| D | 0 | 26 | 0 |
| Quadrant | Total seconds | Saturated seconds | Saturation percentage |
|---|---|---|---|
| A | 5157 | 13 | 0.252085% |
| B | 5157 | 78 | 1.512507% |
| C | 5157 | 345 | 6.689936% |
| D | 5157 | 59 | 1.144076% |
Noise dominated data is calculated using 1-second bins in cleaned event files. If a bin has >2000 counts, and if more than 50% of those come from <1% of pixels, then it is considered to be noise-dominated and hence unusable.
| Quadrant | # 1 sec bins | Bins with >0 counts | Bins with >2000 counts | High rate bins dominated by noise | Noise dominated (total time) | Noise dominated (detector-on time) | Marked lightcurve |
|---|---|---|---|---|---|---|---|
| A | 7010 | 5158 | 6 | 6 | 0.09% | 0.12% | 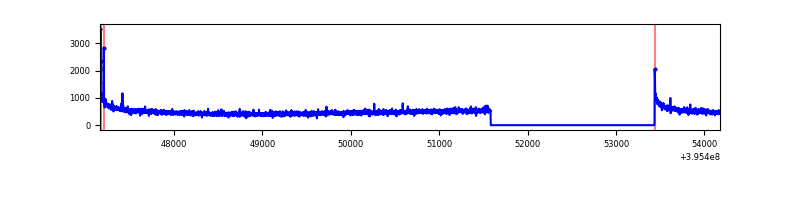 |
| B | 7010 | 5158 | 57 | 57 | 0.81% | 1.11% | 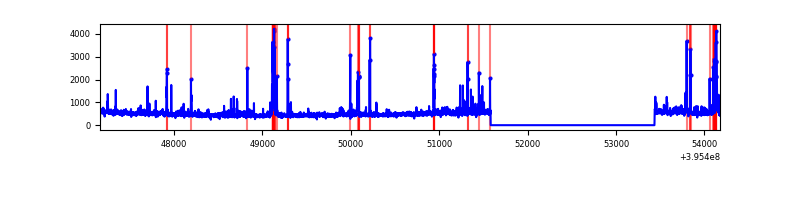 |
| C | 7010 | 5158 | 292 | 292 | 4.17% | 5.66% | 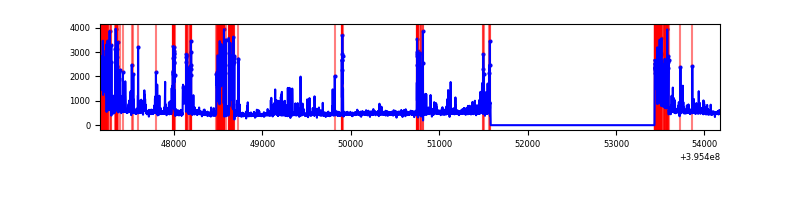 |
| D | 7010 | 5158 | 52 | 52 | 0.74% | 1.01% | 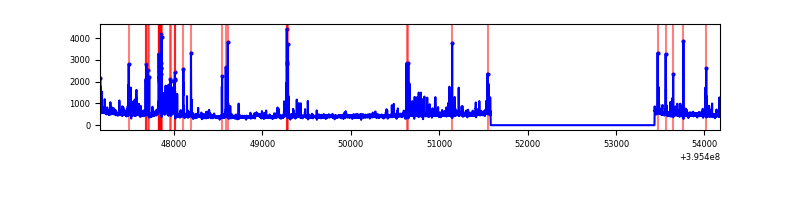 |
Top three noisy pixels from each quadrant. If the there are fewer than three noisy pixels in the level2.evt file, extra rows are filled as -1
| Pixel properties | Quadrant properties | ||||||
|---|---|---|---|---|---|---|---|
| Quadrant | DetID | PixID | Counts | Sigma | Mean | Median | Sigma |
| A | 10 | 83 | 207582 | 1731.73 | 591 | 581 | 119.5 |
| A | 9 | 143 | 15995 | 128.95 | 591 | 581 | 119.5 |
| A | 13 | 254 | 8911 | 69.69 | 591 | 581 | 119.5 |
| B | 5 | 255 | 230461 | 2029.11 | 593 | 578 | 113.3 |
| B | 0 | 189 | 69533 | 608.64 | 593 | 578 | 113.3 |
| B | 4 | 171 | 44420 | 386.98 | 593 | 578 | 113.3 |
| C | 14 | 254 | 650339 | 4999.46 | 561 | 566 | 130.0 |
| C | 0 | 10 | 562550 | 4324.0 | 561 | 566 | 130.0 |
| C | 15 | 214 | 224984 | 1726.71 | 561 | 566 | 130.0 |
| D | 12 | 6 | 154936 | 1105.98 | 575 | 560 | 139.6 |
| D | 2 | 250 | 96831 | 689.71 | 575 | 560 | 139.6 |
| D | 2 | 153 | 81101 | 577.01 | 575 | 560 | 139.6 |
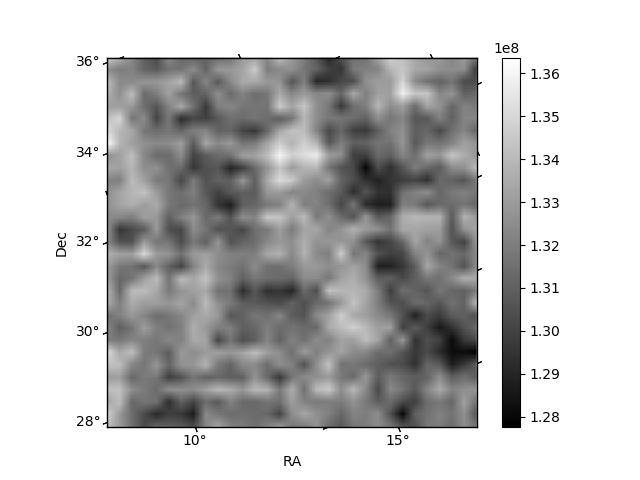
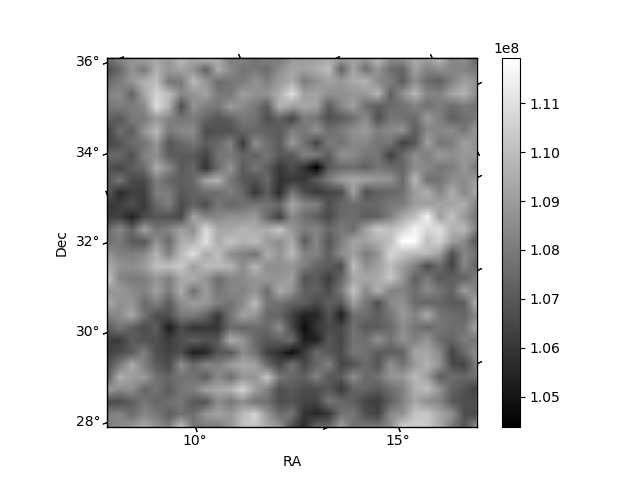
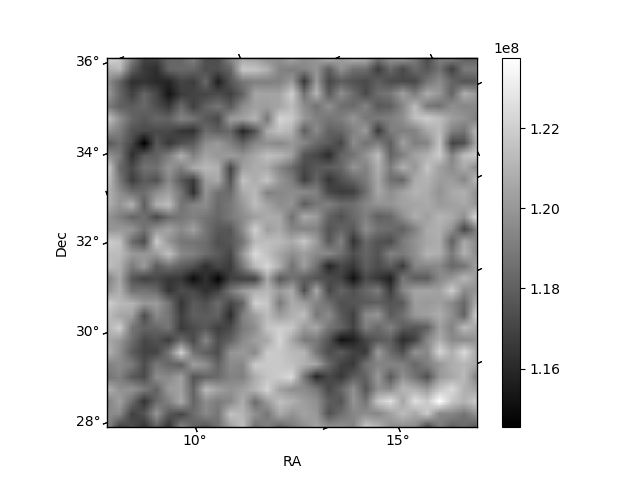
Histogram calculated using DETX and DETY for each event in the final _common_clean file
| Quadrant A |  |
 |
Quadrant B |
|---|---|---|---|
| Quadrant D |  |
 |
Quadrant C |
| Plot type | Count rate plots | Images |
|---|---|---|
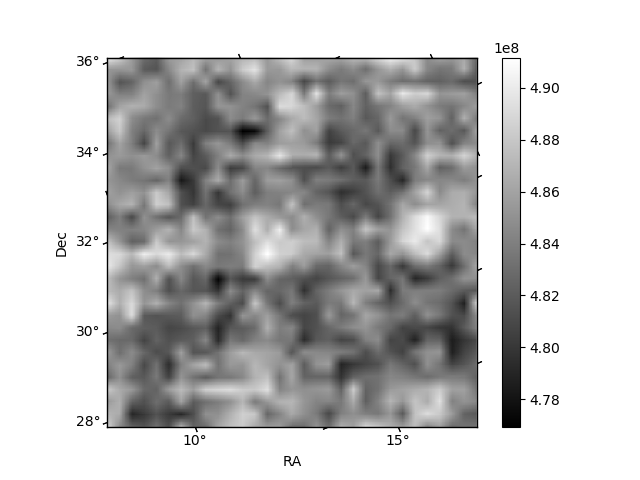
| Comparison with Poisson distribution Blue bars denote a histogram of data divided into 1 sec bins. Red curve is a Poisson curve with rate = median count rate of data. |
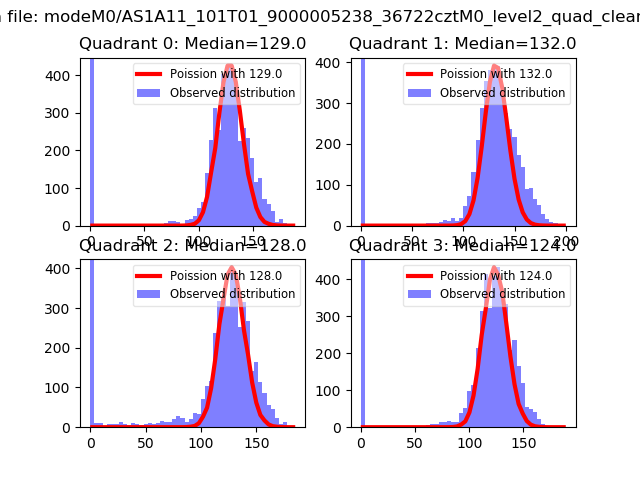 |
 |
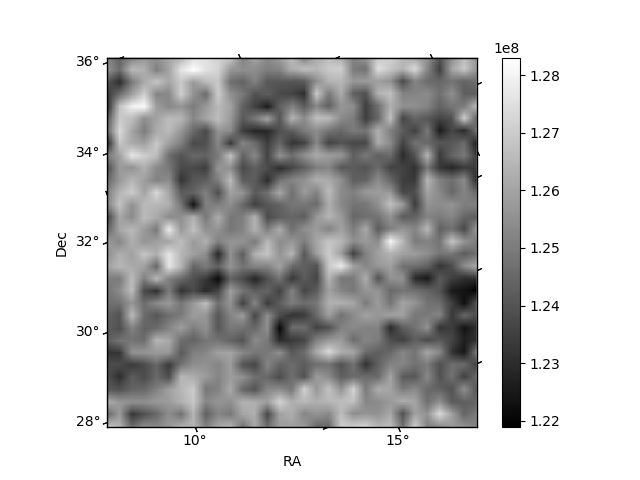
| Quadrant-wise count rates Data is divided into 100 sec bins |
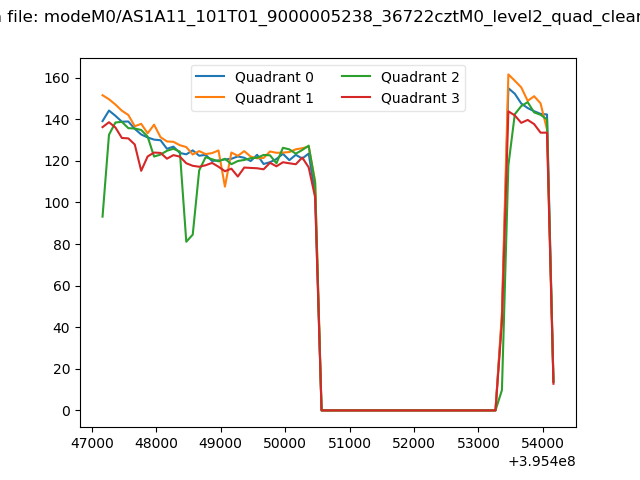 |
|
| Module-wise count rates for Quadrant A Data is divided into 100 sec bins |
 |
 |
| Module-wise count rates for Quadrant B Data is divided into 100 sec bins |
 |
 |
| Module-wise count rates for Quadrant C Data is divided into 100 sec bins |
 |
 |
| Module-wise count rates for Quadrant D Data is divided into 100 sec bins |
 |
 |
| Parameter | Plot |
|---|---|
| CZT HV Monitor |  |
| D_VDD | 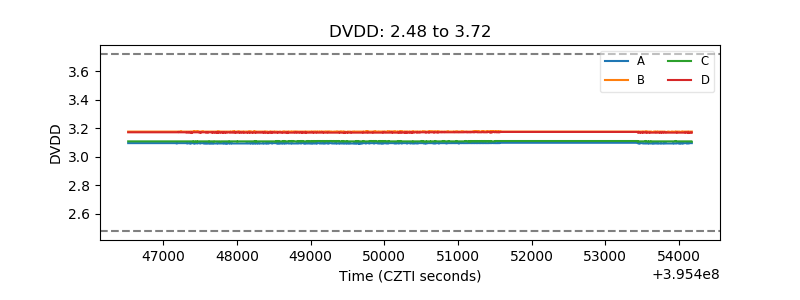 |
| Temperature 1 |  |
| Veto HV Monitor | 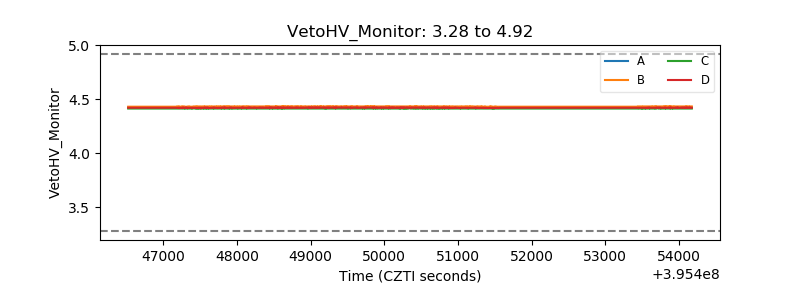 |
| Veto LLD |  |
| Alpha Counter | 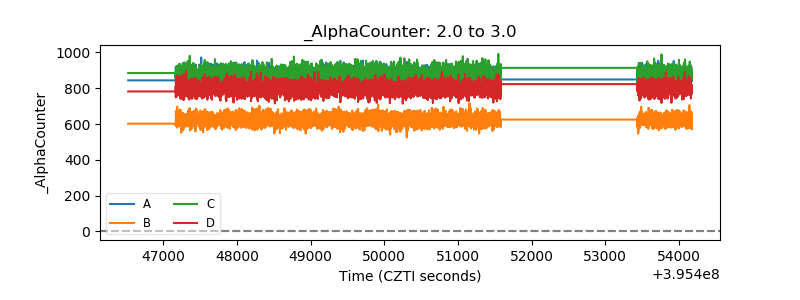 |
| _CPM_Rate | 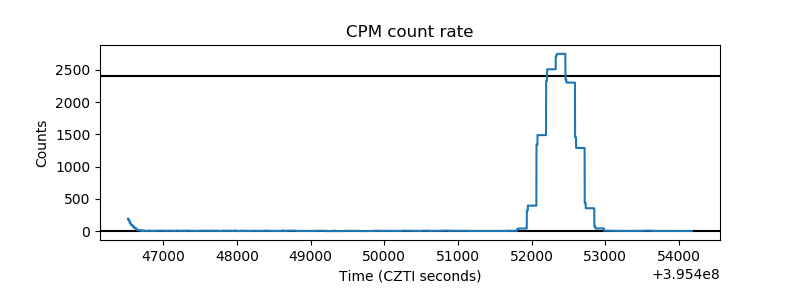 |
| CZT Counter | 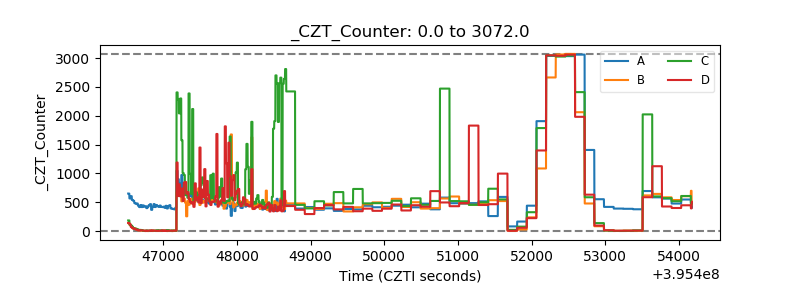 |
| +2.5 Volts monitor | 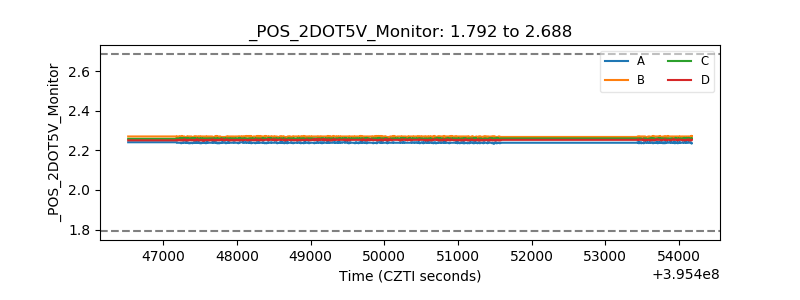 |
| +5 Volts monitor | 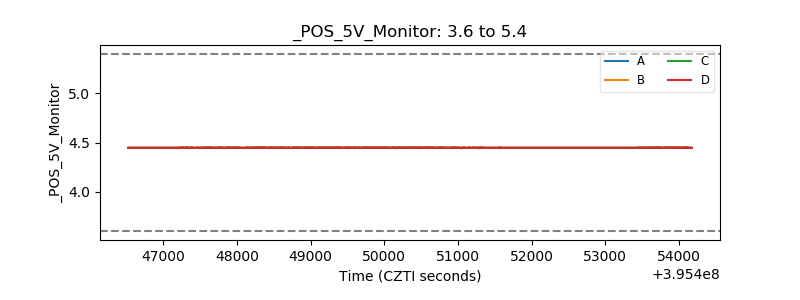 |
| _ROLL_ROT |  |
| _Roll_DEC | 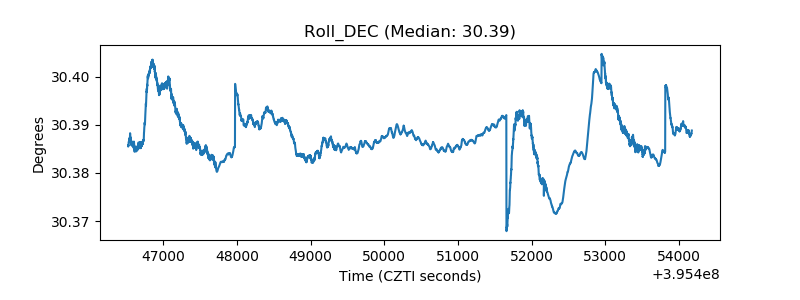 |
| _Roll_RA | 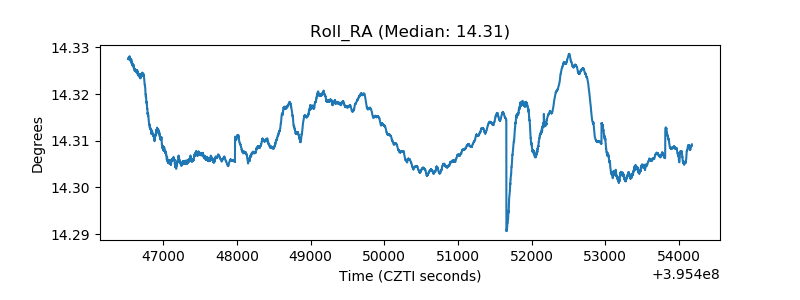 |
| Veto Counter |  |