| Param | Original file | Final file |
|---|---|---|
| Filename | modeM0/AS1A11_101T01_9000005238_36724cztM0_level2.evt | modeM0/AS1A11_101T01_9000005238_36724cztM0_level2_quad_clean.evt |
| Size (bytes) | 405,941,760 | 70,853,760 |
| Size | 387.1 MB | 67.6 MB |
| Events in quadrant A | 2,503,709 | 457,419 |
| Events in quadrant B | 2,981,140 | 473,186 |
| Events in quadrant C | 3,632,732 | 437,993 |
| Events in quadrant D | 2,840,666 | 430,359 |
| Mode M0 | |||
|---|---|---|---|
| Quadrant | BADHDUFLAG | Total packets | Discarded packets |
| A | 0 | 10457 | 3 |
| B | 0 | 11980 | 2 |
| C | 0 | 13818 | 2 |
| D | 0 | 11591 | 2 |
| Mode SS | |||
|---|---|---|---|
| Quadrant | BADHDUFLAG | Total packets | Discarded packets |
| A | 0 | 102 | 0 |
| B | 0 | 102 | 0 |
| C | 0 | 102 | 0 |
| D | 0 | 102 | 0 |
| Mode M9 | |||
|---|---|---|---|
| Quadrant | BADHDUFLAG | Total packets | Discarded packets |
| A | 0 | 30 | 0 |
| B | 0 | 30 | 0 |
| C | 0 | 30 | 0 |
| D | 0 | 31 | 0 |
| Quadrant | Total seconds | Saturated seconds | Saturation percentage |
|---|---|---|---|
| A | 4934 | 8 | 0.162140% |
| B | 4934 | 28 | 0.567491% |
| C | 4934 | 333 | 6.749088% |
| D | 4934 | 22 | 0.445886% |
Noise dominated data is calculated using 1-second bins in cleaned event files. If a bin has >2000 counts, and if more than 50% of those come from <1% of pixels, then it is considered to be noise-dominated and hence unusable.
| Quadrant | # 1 sec bins | Bins with >0 counts | Bins with >2000 counts | High rate bins dominated by noise | Noise dominated (total time) | Noise dominated (detector-on time) | Marked lightcurve |
|---|---|---|---|---|---|---|---|
| A | 7027 | 4935 | 2 | 2 | 0.03% | 0.04% | 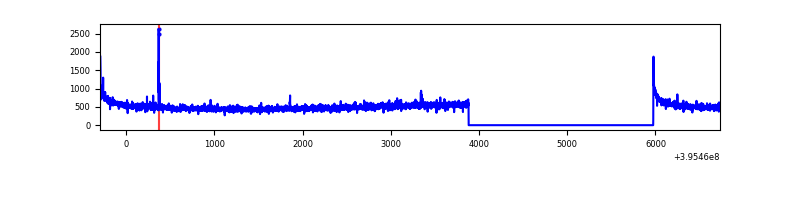 |
| B | 7027 | 4935 | 20 | 20 | 0.28% | 0.41% | 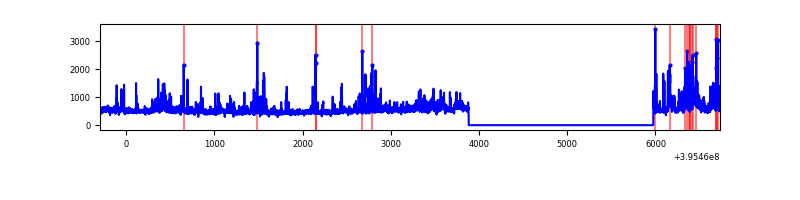 |
| C | 7027 | 4935 | 259 | 259 | 3.69% | 5.25% | 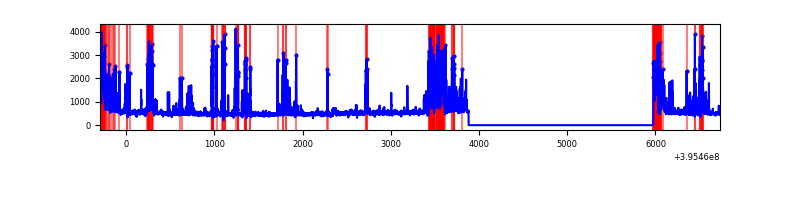 |
| D | 7027 | 4935 | 19 | 19 | 0.27% | 0.39% | 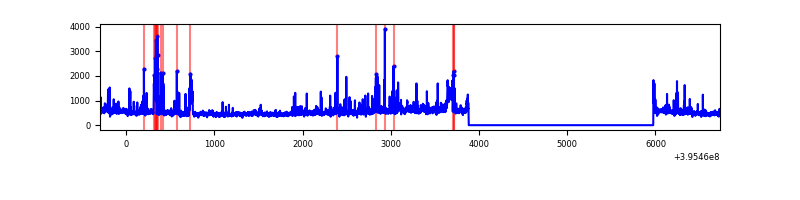 |
Top three noisy pixels from each quadrant. If the there are fewer than three noisy pixels in the level2.evt file, extra rows are filled as -1
| Pixel properties | Quadrant properties | ||||||
|---|---|---|---|---|---|---|---|
| Quadrant | DetID | PixID | Counts | Sigma | Mean | Median | Sigma |
| A | 10 | 83 | 201077 | 1708.54 | 587 | 576 | 117.4 |
| A | 9 | 143 | 22653 | 188.13 | 587 | 576 | 117.4 |
| A | 13 | 254 | 7983 | 63.12 | 587 | 576 | 117.4 |
| B | 4 | 171 | 432834 | 3879.72 | 589 | 577 | 111.4 |
| B | 5 | 255 | 127414 | 1138.42 | 589 | 577 | 111.4 |
| B | 0 | 221 | 28058 | 246.66 | 589 | 577 | 111.4 |
| C | 14 | 254 | 816883 | 6413.48 | 551 | 555 | 127.3 |
| C | 0 | 10 | 373557 | 2930.49 | 551 | 555 | 127.3 |
| C | 15 | 214 | 218398 | 1711.48 | 551 | 555 | 127.3 |
| D | 7 | 223 | 211655 | 1535.75 | 564 | 550 | 137.5 |
| D | 13 | 249 | 149482 | 1083.45 | 564 | 550 | 137.5 |
| D | 1 | 20 | 99865 | 722.5 | 564 | 550 | 137.5 |
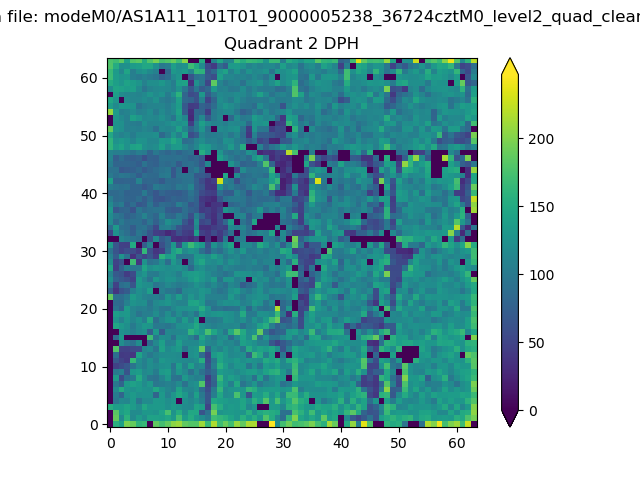
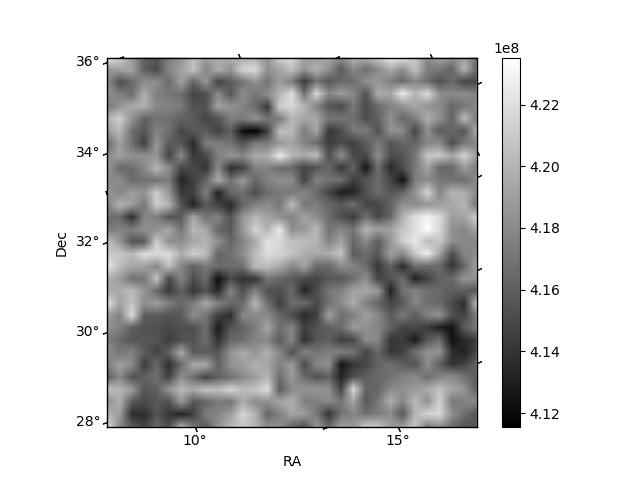
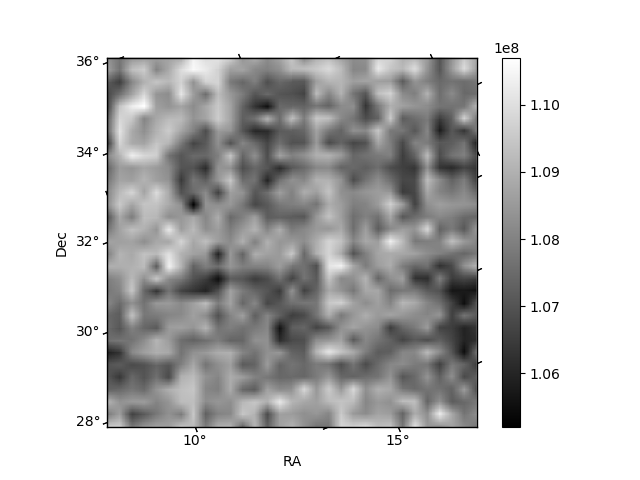
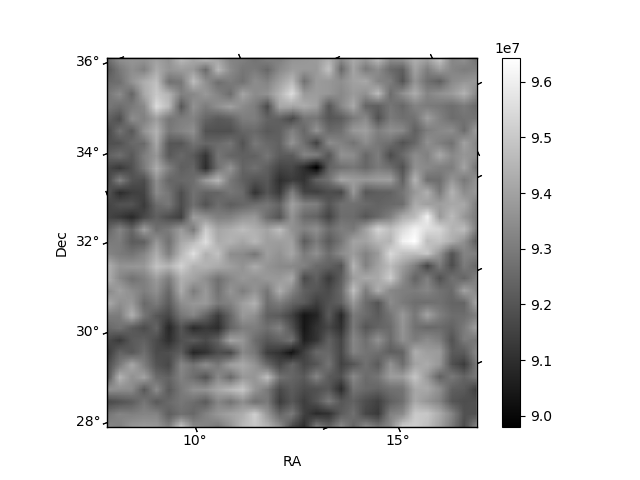
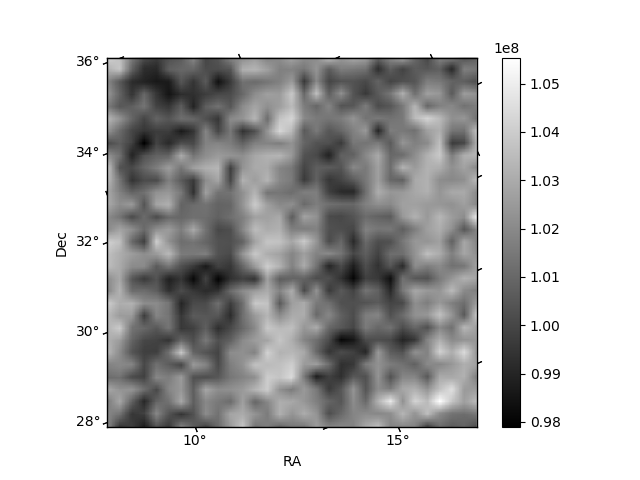
Histogram calculated using DETX and DETY for each event in the final _common_clean file
| Quadrant A | 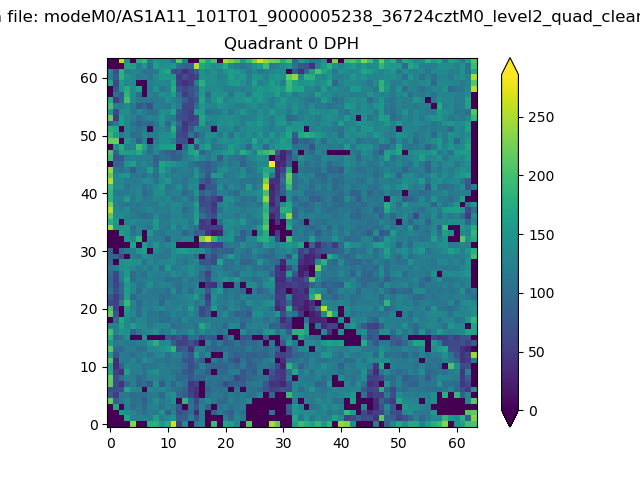 |
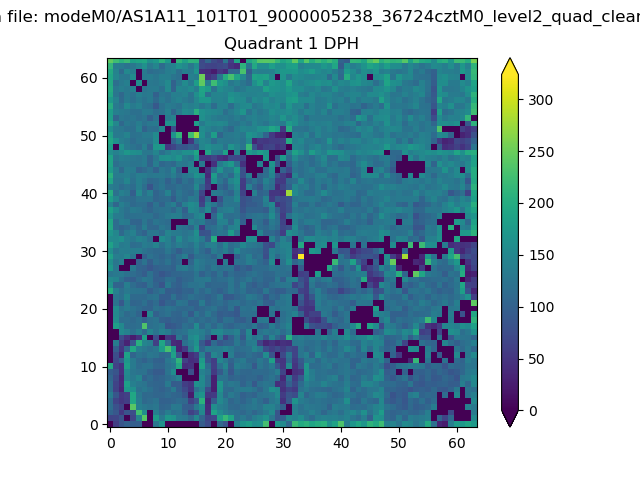 |
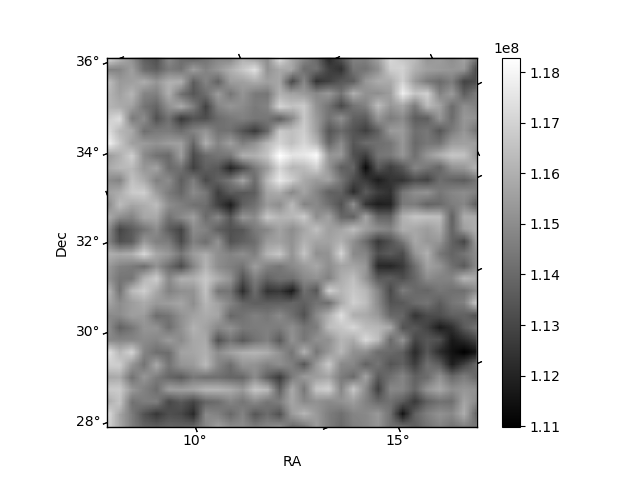
Quadrant B |
|---|---|---|---|
| Quadrant D | 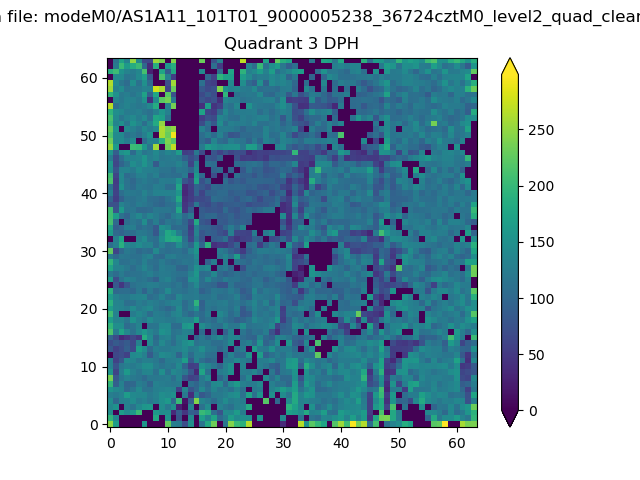 |
 |
Quadrant C |
| Plot type | Count rate plots | Images |
|---|---|---|
| Comparison with Poisson distribution Blue bars denote a histogram of data divided into 1 sec bins. Red curve is a Poisson curve with rate = median count rate of data. |
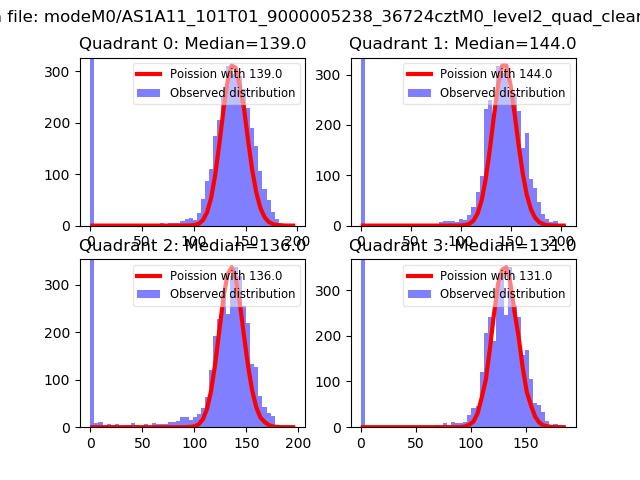 |
 |
| Quadrant-wise count rates Data is divided into 100 sec bins |
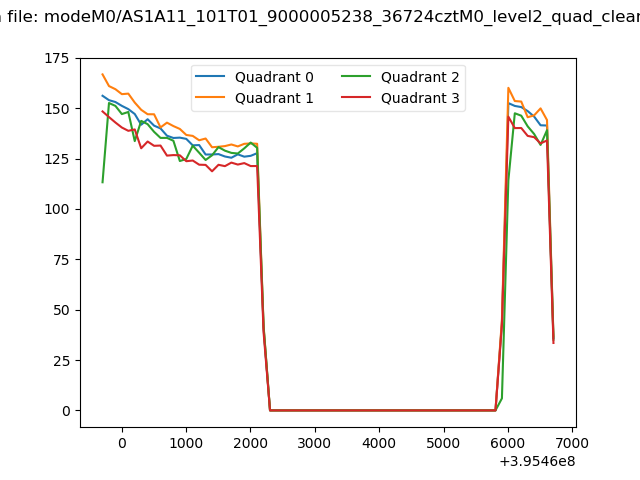 |
|
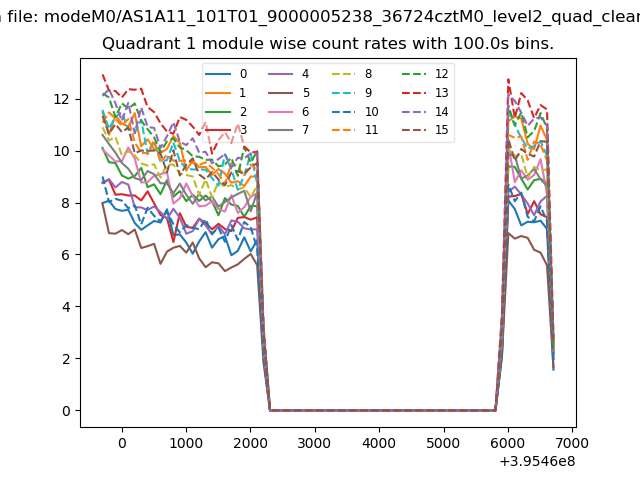
| Module-wise count rates for Quadrant A Data is divided into 100 sec bins |
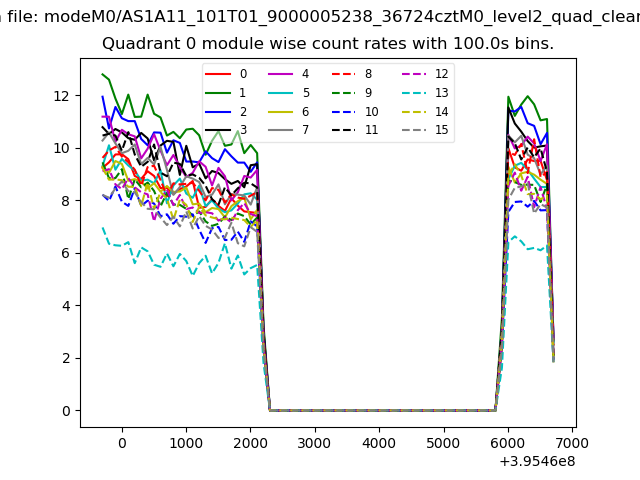 |
 |
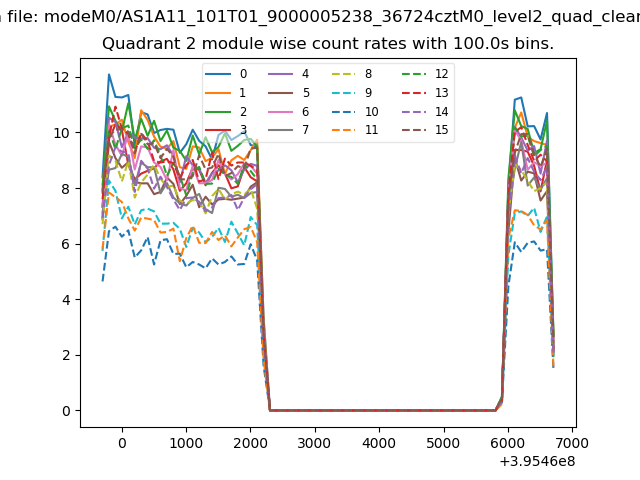
| Module-wise count rates for Quadrant B Data is divided into 100 sec bins |
 |
 |
| Module-wise count rates for Quadrant C Data is divided into 100 sec bins |
 |
 |
| Module-wise count rates for Quadrant D Data is divided into 100 sec bins |
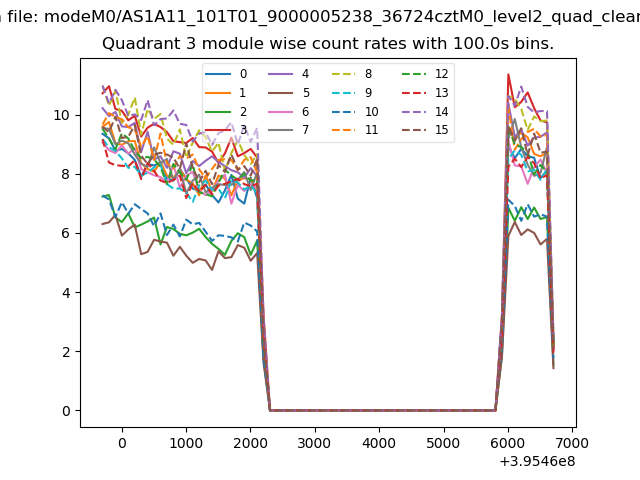 |
 |
| Parameter | Plot |
|---|---|
| CZT HV Monitor | 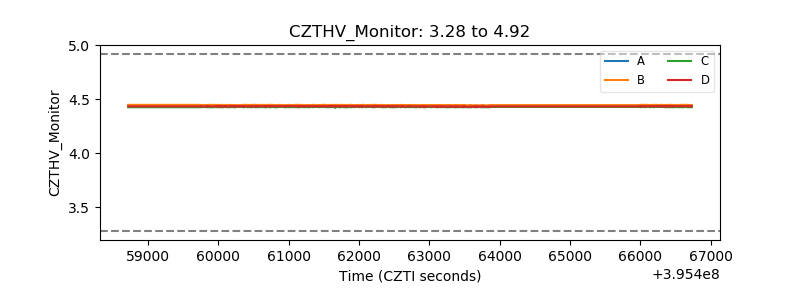 |
| D_VDD | 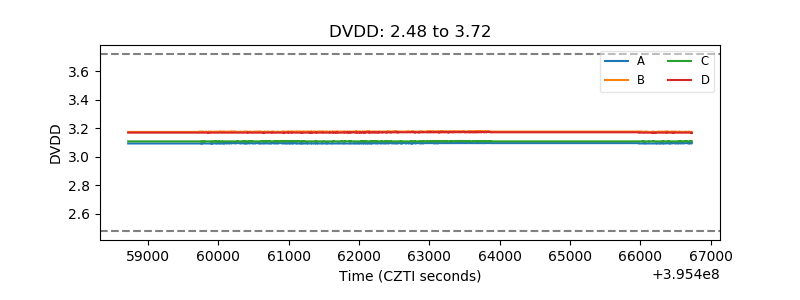 |
| Temperature 1 | 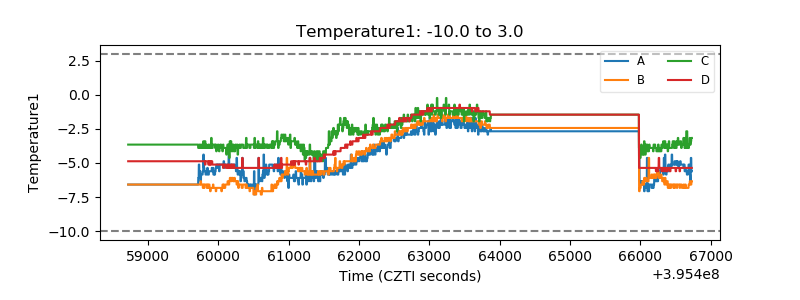 |
| Veto HV Monitor |  |
| Veto LLD | 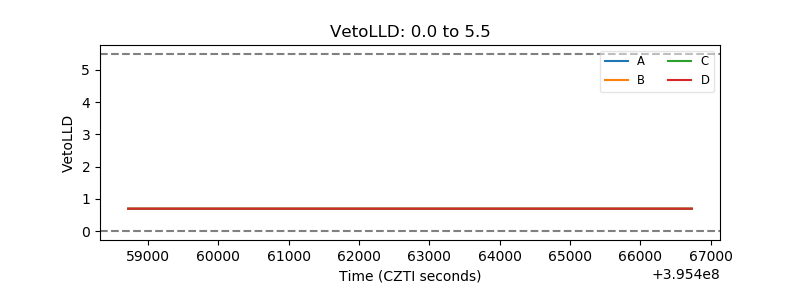 |
| Alpha Counter | 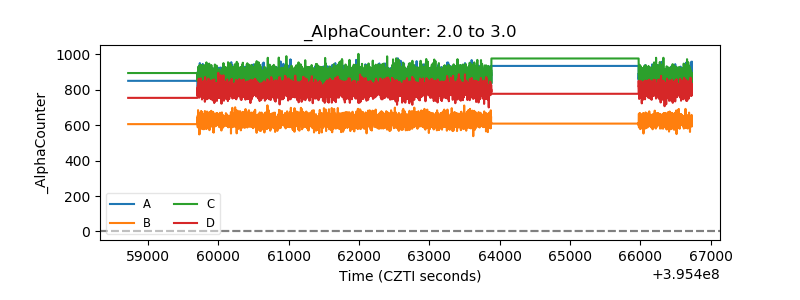 |
| _CPM_Rate | 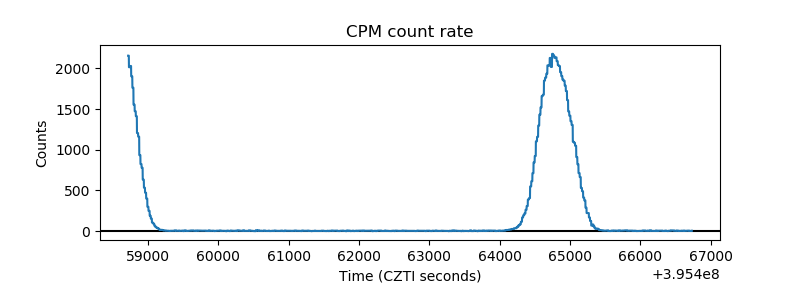 |
| CZT Counter | 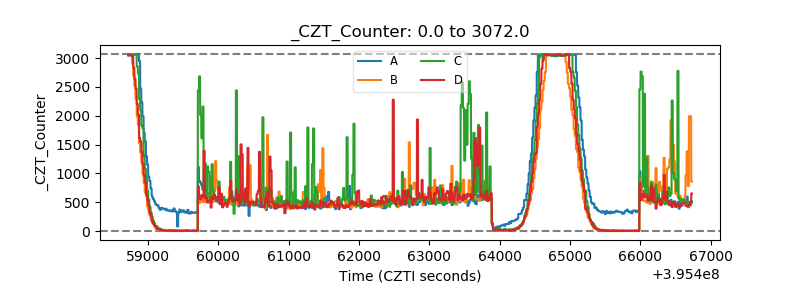 |
| +2.5 Volts monitor | 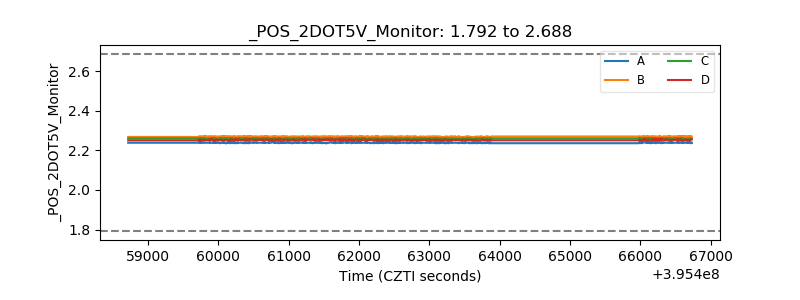 |
| +5 Volts monitor |  |
| _ROLL_ROT | 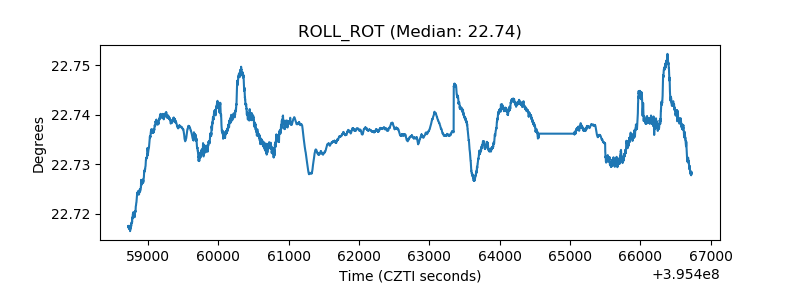 |
| _Roll_DEC | 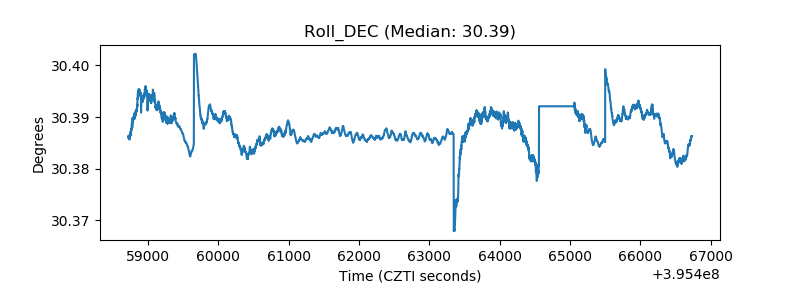 |
| _Roll_RA | 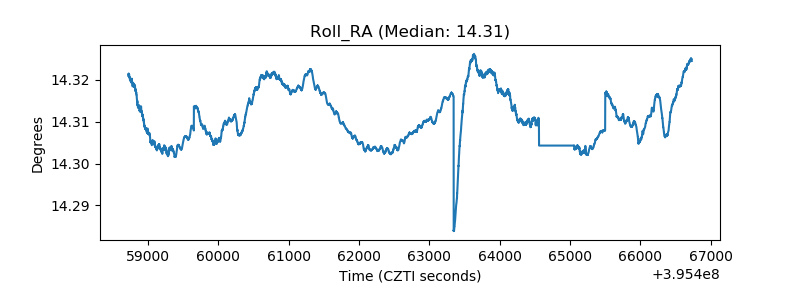 |
| Veto Counter | 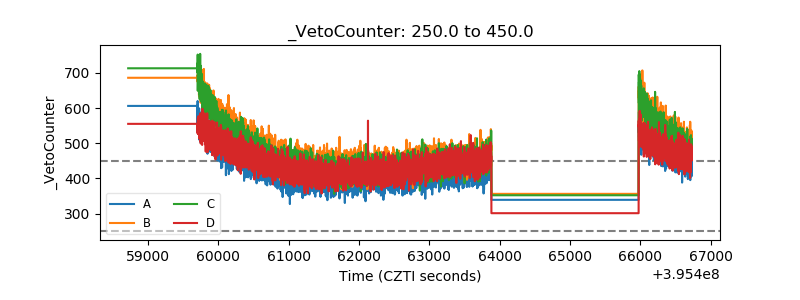 |