| Param | Original file | Final file |
|---|---|---|
| Filename | modeM0/AS1A11_101T01_9000005238_36725cztM0_level2.evt | modeM0/AS1A11_101T01_9000005238_36725cztM0_level2_quad_clean.evt |
| Size (bytes) | 451,258,560 | 69,099,840 |
| Size | 430.4 MB | 65.9 MB |
| Events in quadrant A | 2,665,974 | 439,612 |
| Events in quadrant B | 3,913,156 | 450,221 |
| Events in quadrant C | 3,612,467 | 420,381 |
| Events in quadrant D | 3,118,396 | 414,140 |
| Mode M0 | |||
|---|---|---|---|
| Quadrant | BADHDUFLAG | Total packets | Discarded packets |
| A | 0 | 11081 | 3 |
| B | 0 | 15034 | 2 |
| C | 0 | 13979 | 2 |
| D | 0 | 12619 | 2 |
| Mode SS | |||
|---|---|---|---|
| Quadrant | BADHDUFLAG | Total packets | Discarded packets |
| A | 0 | 106 | 0 |
| B | 0 | 106 | 0 |
| C | 0 | 106 | 0 |
| D | 0 | 106 | 0 |
| Mode M9 | |||
|---|---|---|---|
| Quadrant | BADHDUFLAG | Total packets | Discarded packets |
| A | 0 | 30 | 0 |
| B | 0 | 30 | 0 |
| C | 0 | 30 | 0 |
| D | 0 | 31 | 0 |
| Quadrant | Total seconds | Saturated seconds | Saturation percentage |
|---|---|---|---|
| A | 5256 | 6 | 0.114155% |
| B | 5256 | 267 | 5.079909% |
| C | 5256 | 214 | 4.071537% |
| D | 5256 | 126 | 2.397260% |
Noise dominated data is calculated using 1-second bins in cleaned event files. If a bin has >2000 counts, and if more than 50% of those come from <1% of pixels, then it is considered to be noise-dominated and hence unusable.
| Quadrant | # 1 sec bins | Bins with >0 counts | Bins with >2000 counts | High rate bins dominated by noise | Noise dominated (total time) | Noise dominated (detector-on time) | Marked lightcurve |
|---|---|---|---|---|---|---|---|
| A | 7409 | 5257 | 6 | 6 | 0.08% | 0.11% | 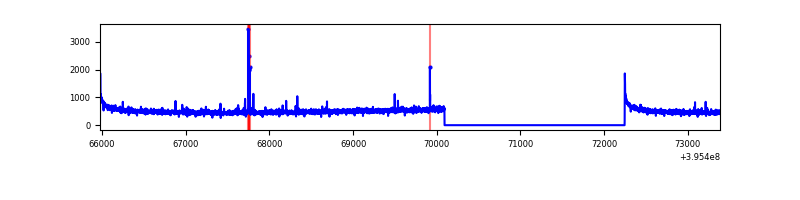 |
| B | 7409 | 5257 | 206 | 206 | 2.78% | 3.92% |  |
| C | 7409 | 5257 | 180 | 180 | 2.43% | 3.42% | 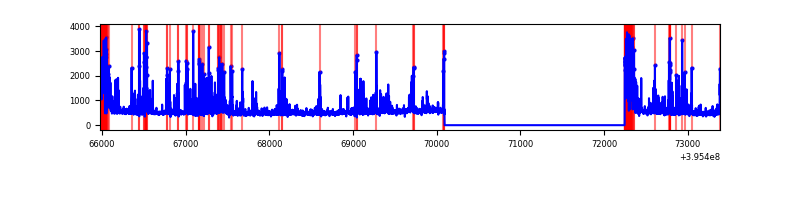 |
| D | 7409 | 5257 | 116 | 116 | 1.57% | 2.21% | 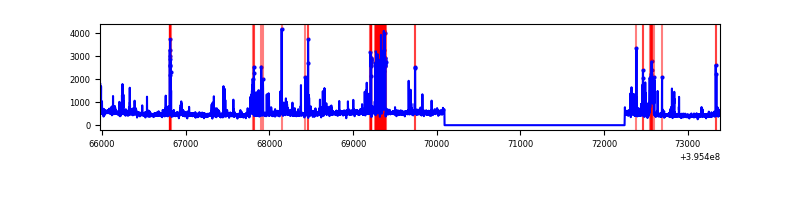 |
Top three noisy pixels from each quadrant. If the there are fewer than three noisy pixels in the level2.evt file, extra rows are filled as -1
| Pixel properties | Quadrant properties | ||||||
|---|---|---|---|---|---|---|---|
| Quadrant | DetID | PixID | Counts | Sigma | Mean | Median | Sigma |
| A | 10 | 83 | 217594 | 1754.6 | 621 | 610 | 123.7 |
| A | 2 | 247 | 27388 | 216.54 | 621 | 610 | 123.7 |
| A | 9 | 143 | 13432 | 103.68 | 621 | 610 | 123.7 |
| B | 4 | 171 | 1210635 | 10456.14 | 611 | 597 | 115.7 |
| B | 5 | 255 | 70898 | 607.48 | 611 | 597 | 115.7 |
| B | 5 | 172 | 59706 | 510.77 | 611 | 597 | 115.7 |
| C | 14 | 254 | 625829 | 4659.84 | 585 | 590 | 134.2 |
| C | 0 | 10 | 419071 | 3118.89 | 585 | 590 | 134.2 |
| C | 15 | 214 | 235318 | 1749.4 | 585 | 590 | 134.2 |
| D | 13 | 249 | 344610 | 2384.49 | 591 | 576 | 144.3 |
| D | 2 | 250 | 142335 | 982.53 | 591 | 576 | 144.3 |
| D | 7 | 223 | 127218 | 877.75 | 591 | 576 | 144.3 |
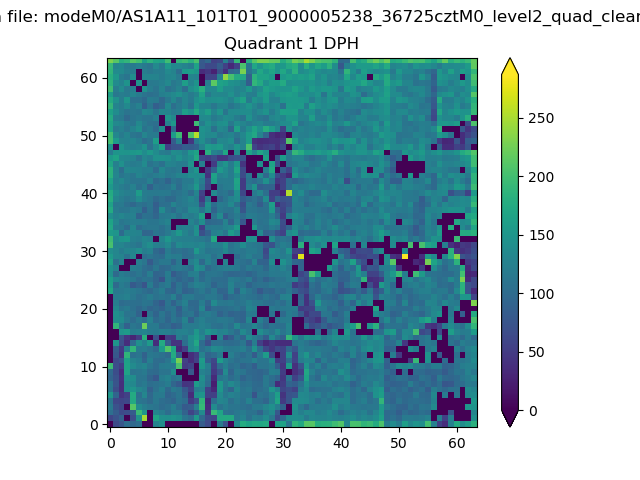
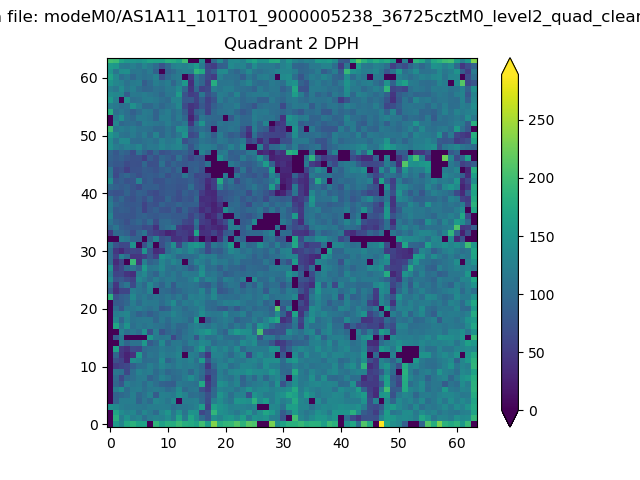
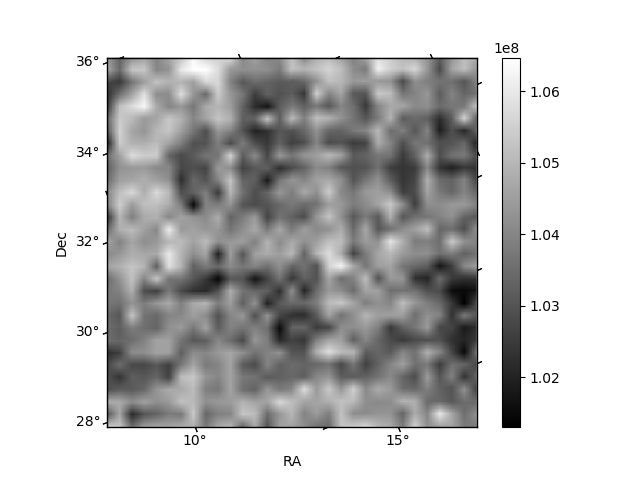
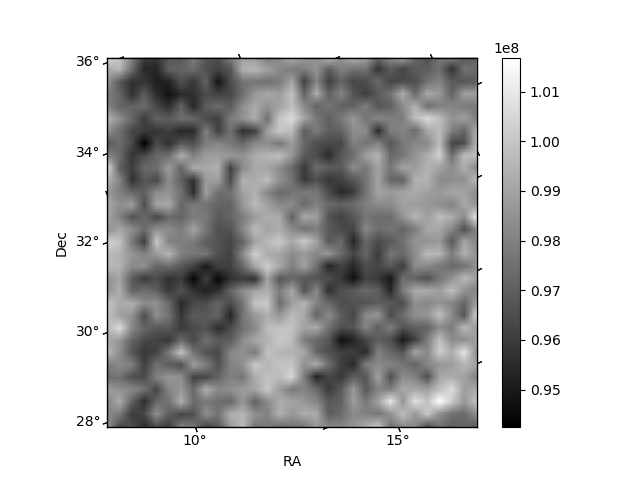
Histogram calculated using DETX and DETY for each event in the final _common_clean file
| Quadrant A | 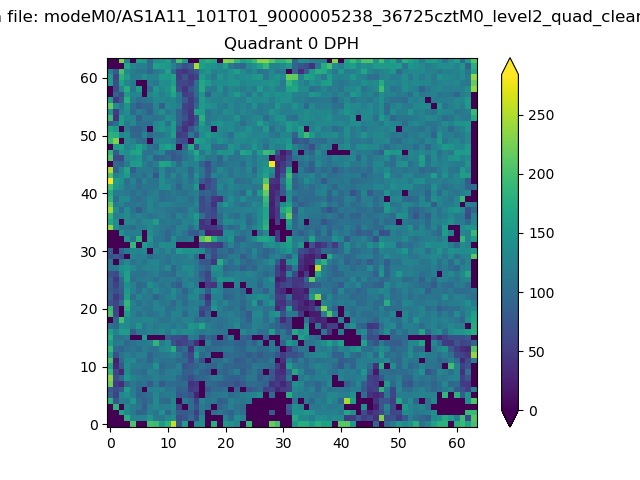 |
 |
Quadrant B |
|---|---|---|---|
| Quadrant D |  |
 |
Quadrant C |
| Plot type | Count rate plots | Images |
|---|---|---|
| Comparison with Poisson distribution Blue bars denote a histogram of data divided into 1 sec bins. Red curve is a Poisson curve with rate = median count rate of data. |
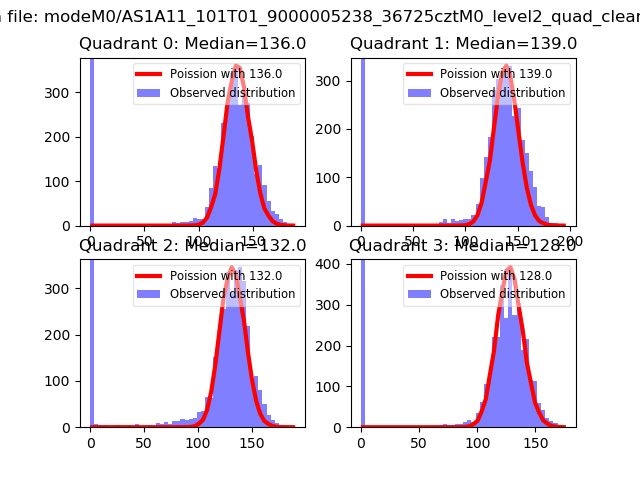 |
 |
| Quadrant-wise count rates Data is divided into 100 sec bins |
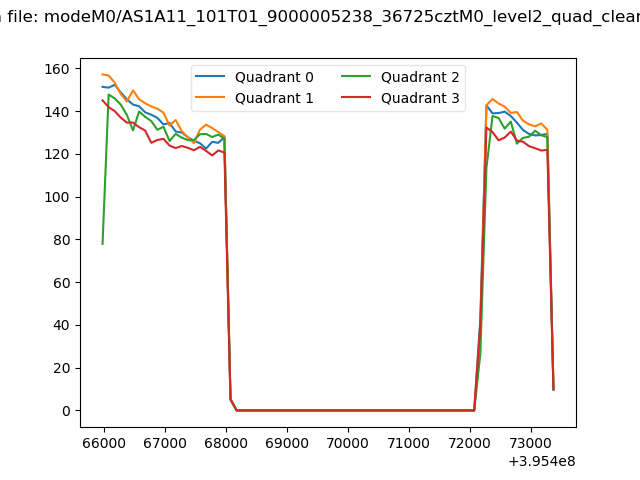 |
|
| Module-wise count rates for Quadrant A Data is divided into 100 sec bins |
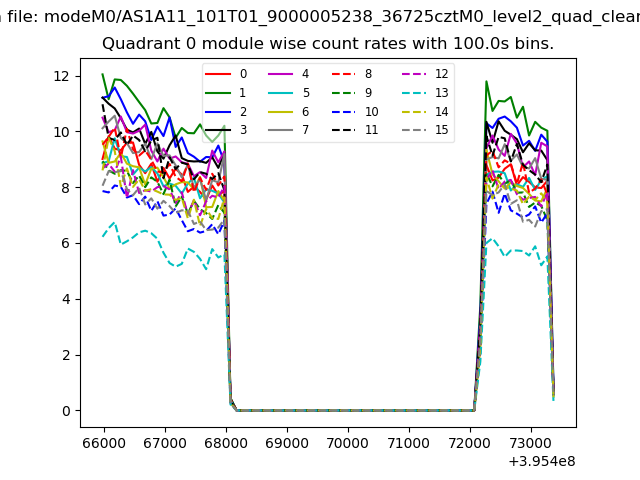 |
 |
| Module-wise count rates for Quadrant B Data is divided into 100 sec bins |
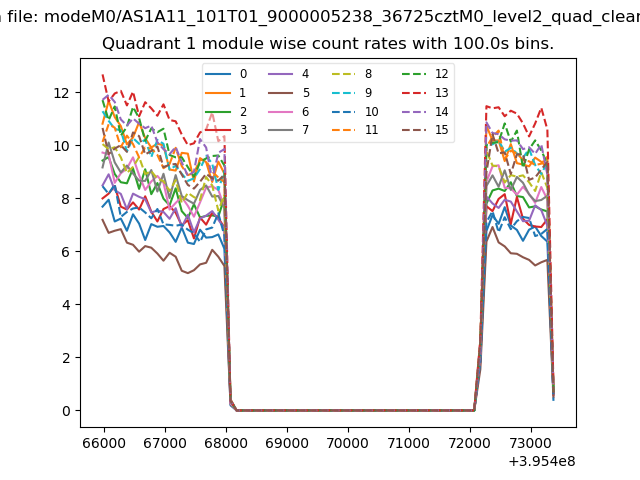 |
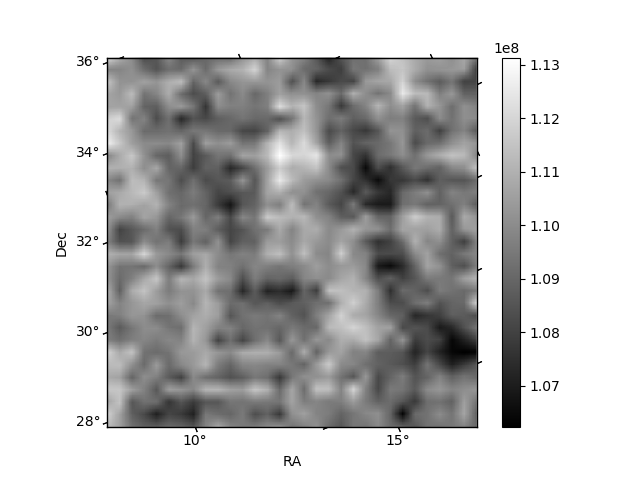 |
| Module-wise count rates for Quadrant C Data is divided into 100 sec bins |
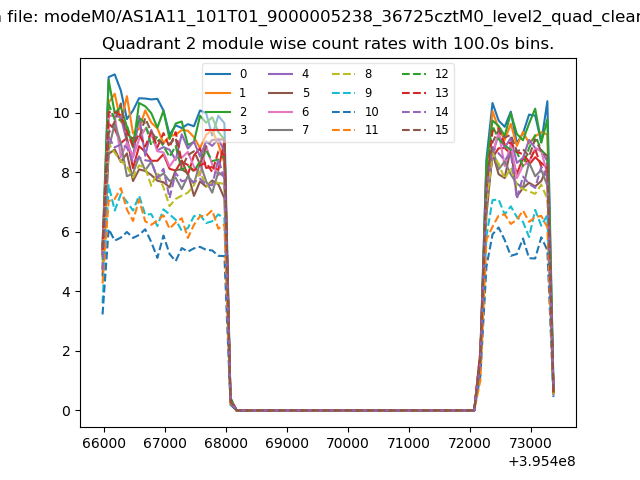 |
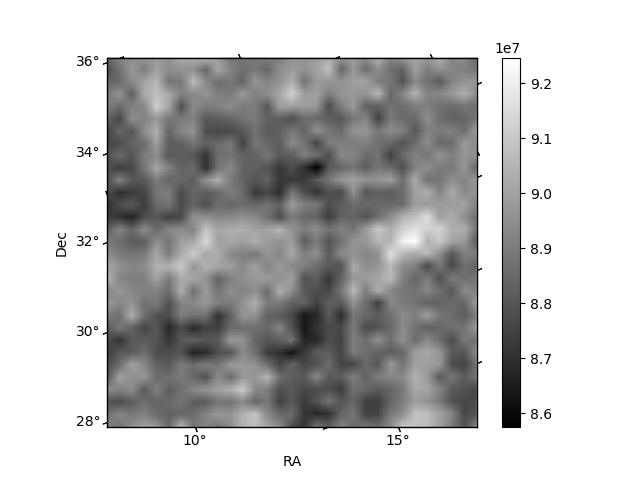 |
| Module-wise count rates for Quadrant D Data is divided into 100 sec bins |
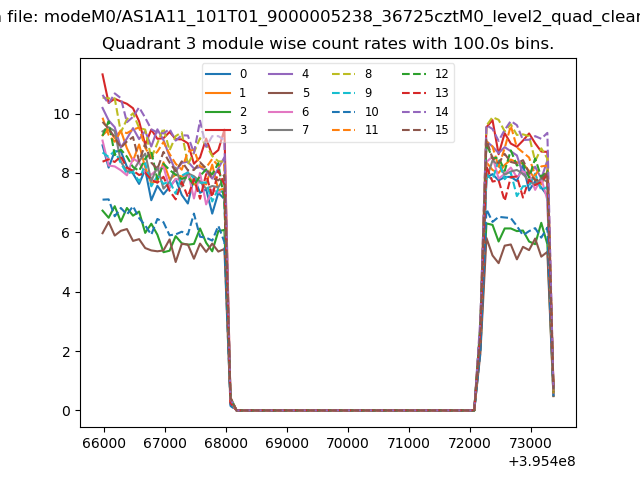 |
 |
| Parameter | Plot |
|---|---|
| CZT HV Monitor | 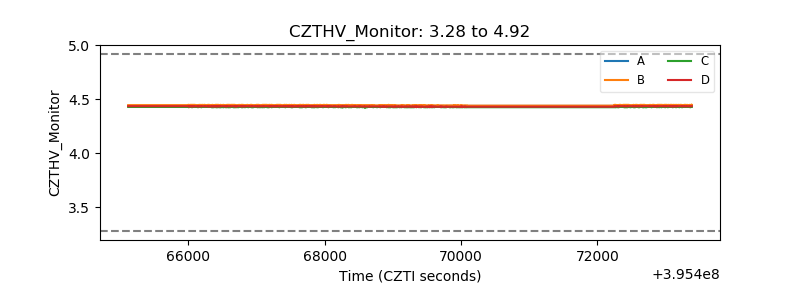 |
| D_VDD | 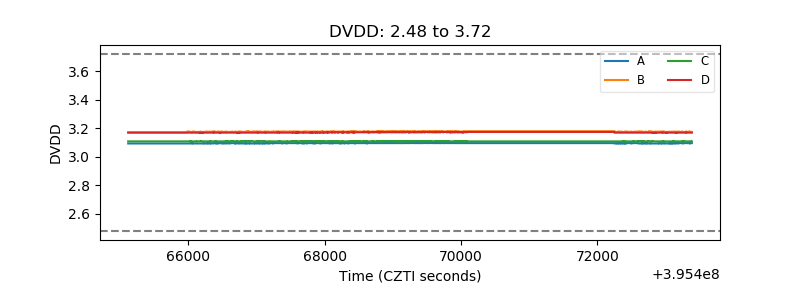 |
| Temperature 1 | 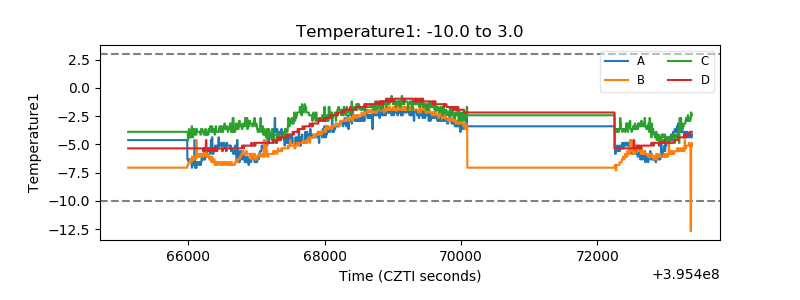 |
| Veto HV Monitor | 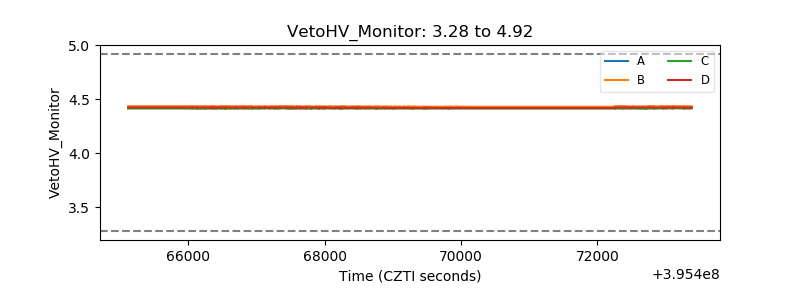 |
| Veto LLD | 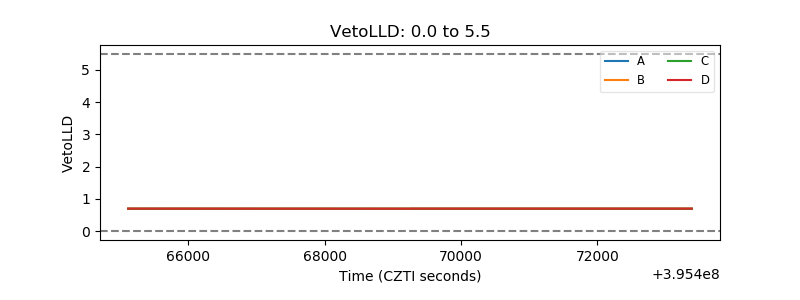 |
| Alpha Counter | 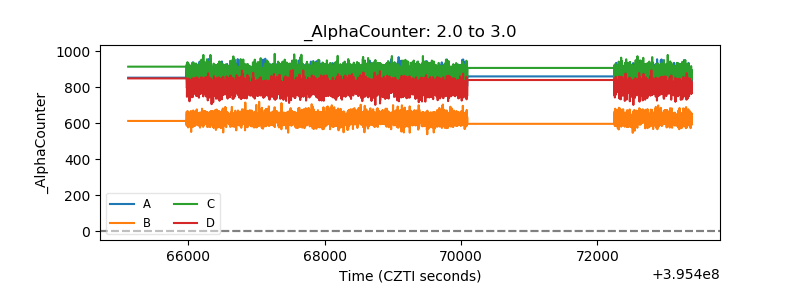 |
| _CPM_Rate |  |
| CZT Counter | 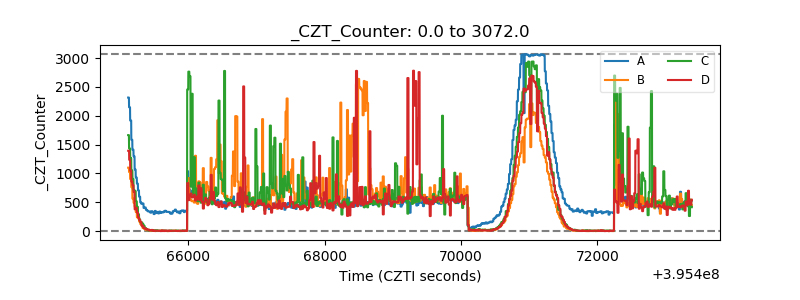 |
| +2.5 Volts monitor | 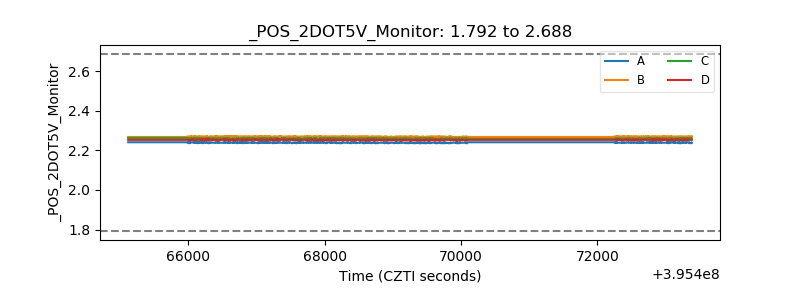 |
| +5 Volts monitor | 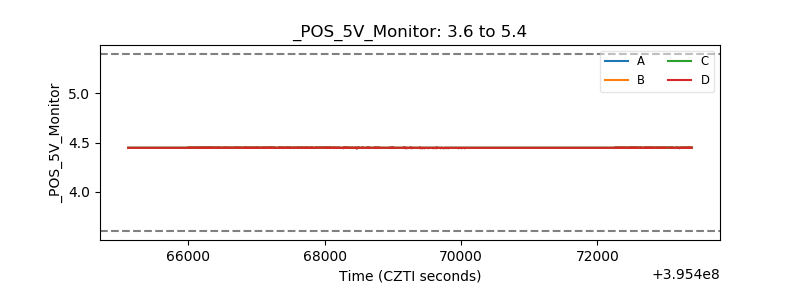 |
| _ROLL_ROT | 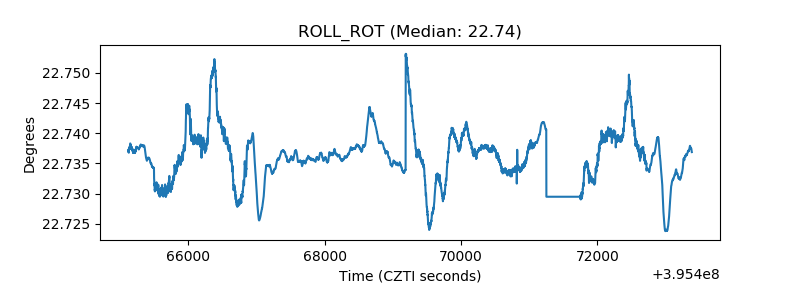 |
| _Roll_DEC | 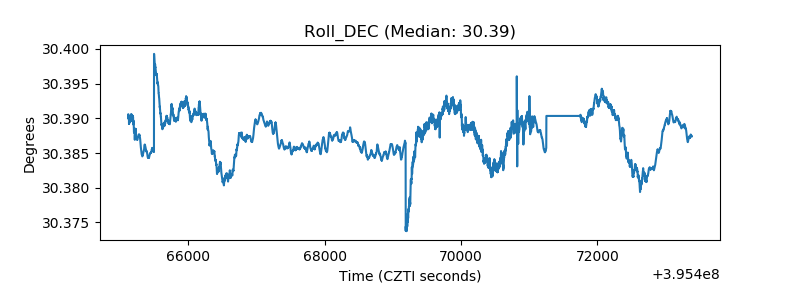 |
| _Roll_RA | 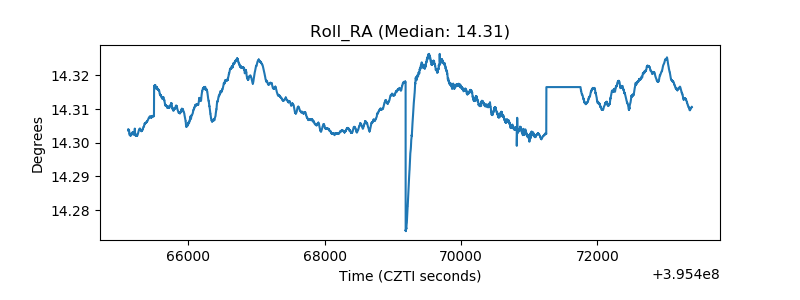 |
| Veto Counter | 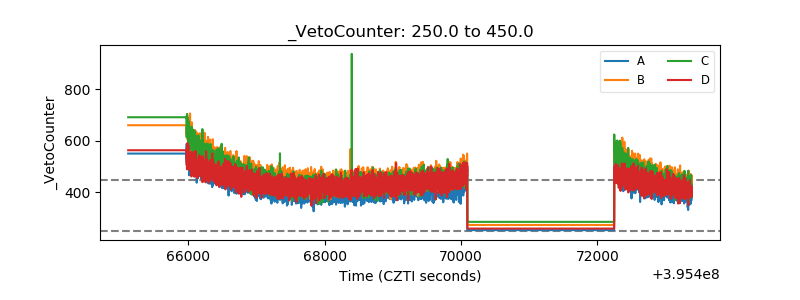 |