| Param | Original file | Final file |
|---|---|---|
| Filename | modeM0/AS1A11_101T01_9000005238_36726cztM0_level2.evt | modeM0/AS1A11_101T01_9000005238_36726cztM0_level2_quad_clean.evt |
| Size (bytes) | 464,569,920 | 61,047,360 |
| Size | 443.0 MB | 58.2 MB |
| Events in quadrant A | 2,537,697 | 386,591 |
| Events in quadrant B | 2,764,265 | 398,243 |
| Events in quadrant C | 3,451,589 | 372,642 |
| Events in quadrant D | 4,969,356 | 332,587 |
| Mode M0 | |||
|---|---|---|---|
| Quadrant | BADHDUFLAG | Total packets | Discarded packets |
| A | 0 | 10785 | 156 |
| B | 0 | 11666 | 180 |
| C | 0 | 13579 | 162 |
| D | 0 | 18580 | 281 |
| Mode SS | |||
|---|---|---|---|
| Quadrant | BADHDUFLAG | Total packets | Discarded packets |
| A | 0 | 107 | 2 |
| B | 0 | 108 | 2 |
| C | 0 | 108 | 0 |
| D | 0 | 108 | 2 |
| Mode M9 | |||
|---|---|---|---|
| Quadrant | BADHDUFLAG | Total packets | Discarded packets |
| A | 0 | 24 | 0 |
| B | 0 | 24 | 0 |
| C | 0 | 24 | 0 |
| D | 0 | 25 | 0 |
| Quadrant | Total seconds | Saturated seconds | Saturation percentage |
|---|---|---|---|
| A | 5106 | 8 | 0.156678% |
| B | 5099 | 41 | 0.804079% |
| C | 5103 | 236 | 4.624731% |
| D | 5088 | 773 | 15.192610% |
Noise dominated data is calculated using 1-second bins in cleaned event files. If a bin has >2000 counts, and if more than 50% of those come from <1% of pixels, then it is considered to be noise-dominated and hence unusable.
| Quadrant | # 1 sec bins | Bins with >0 counts | Bins with >2000 counts | High rate bins dominated by noise | Noise dominated (total time) | Noise dominated (detector-on time) | Marked lightcurve |
|---|---|---|---|---|---|---|---|
| A | 7293 | 5158 | 0 | 0 | 0.00% | 0.00% | 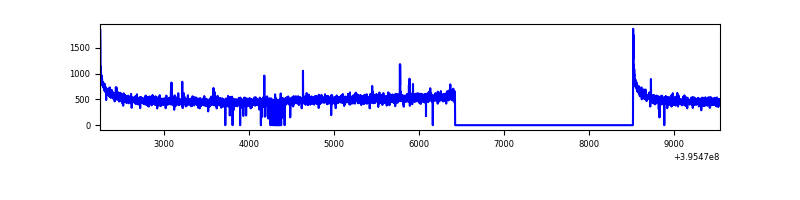 |
| B | 7293 | 5144 | 19 | 19 | 0.26% | 0.37% | 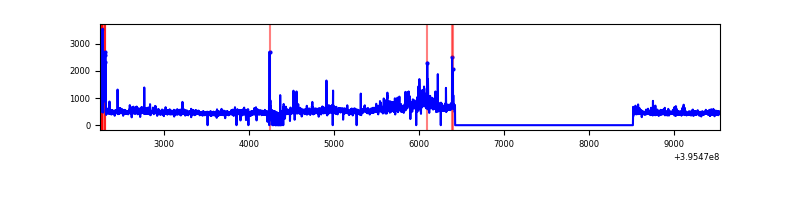 |
| C | 7293 | 5150 | 196 | 196 | 2.69% | 3.81% | 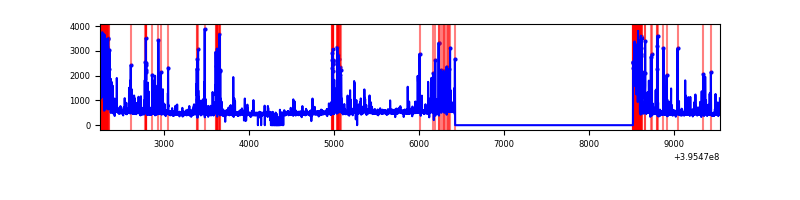 |
| D | 7293 | 5138 | 838 | 838 | 11.49% | 16.31% | 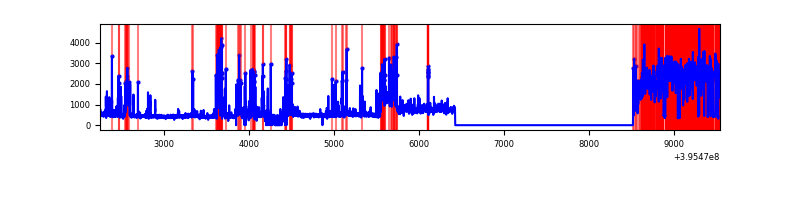 |
Top three noisy pixels from each quadrant. If the there are fewer than three noisy pixels in the level2.evt file, extra rows are filled as -1
| Pixel properties | Quadrant properties | ||||||
|---|---|---|---|---|---|---|---|
| Quadrant | DetID | PixID | Counts | Sigma | Mean | Median | Sigma |
| A | 10 | 83 | 217796 | 1805.91 | 596 | 586 | 120.3 |
| A | 13 | 254 | 8920 | 69.29 | 596 | 586 | 120.3 |
| A | 3 | 137 | 5883 | 44.04 | 596 | 586 | 120.3 |
| B | 4 | 171 | 140230 | 1220.26 | 589 | 576 | 114.4 |
| B | 0 | 189 | 99391 | 863.42 | 589 | 576 | 114.4 |
| B | 0 | 221 | 79509 | 689.7 | 589 | 576 | 114.4 |
| C | 14 | 254 | 567961 | 4361.78 | 562 | 565 | 130.1 |
| C | 0 | 10 | 460269 | 3533.91 | 562 | 565 | 130.1 |
| C | 15 | 214 | 227886 | 1747.5 | 562 | 565 | 130.1 |
| D | 1 | 20 | 2142489 | 15995.07 | 546 | 532 | 133.9 |
| D | 2 | 250 | 251796 | 1876.31 | 546 | 532 | 133.9 |
| D | 13 | 249 | 180043 | 1340.5 | 546 | 532 | 133.9 |
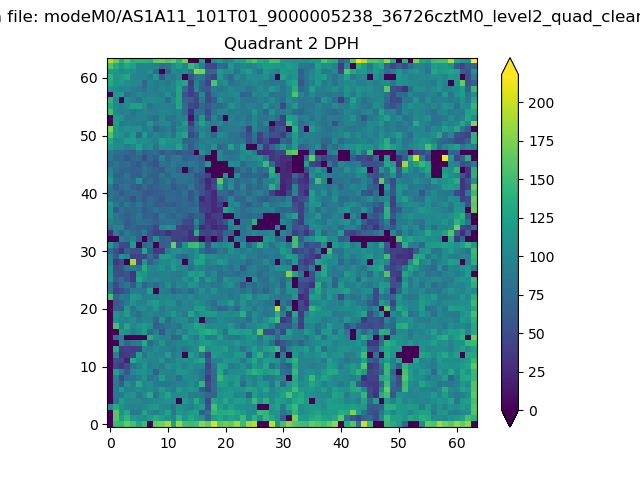
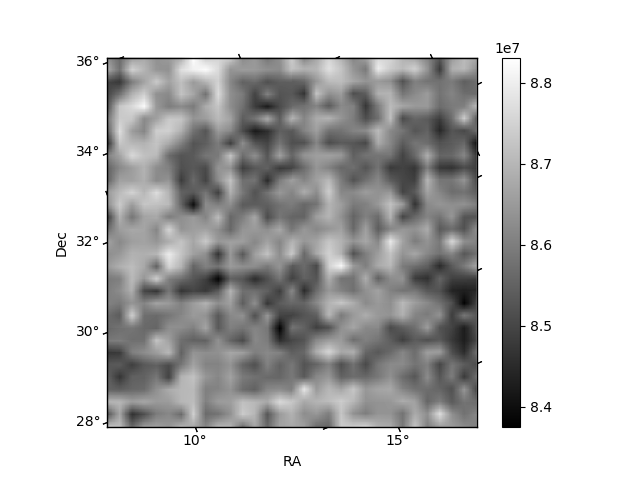
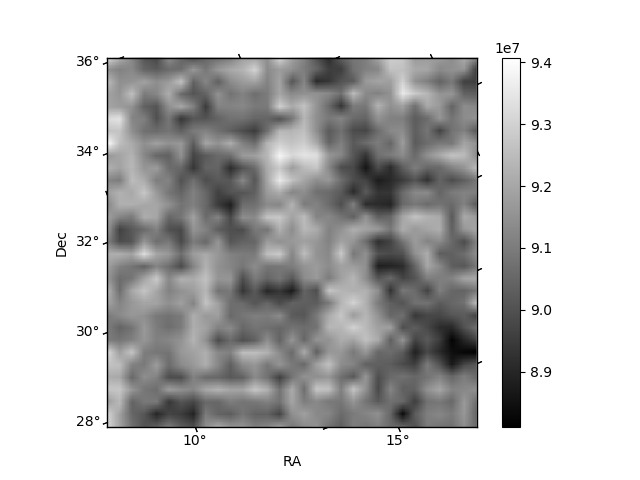
Histogram calculated using DETX and DETY for each event in the final _common_clean file
| Quadrant A | 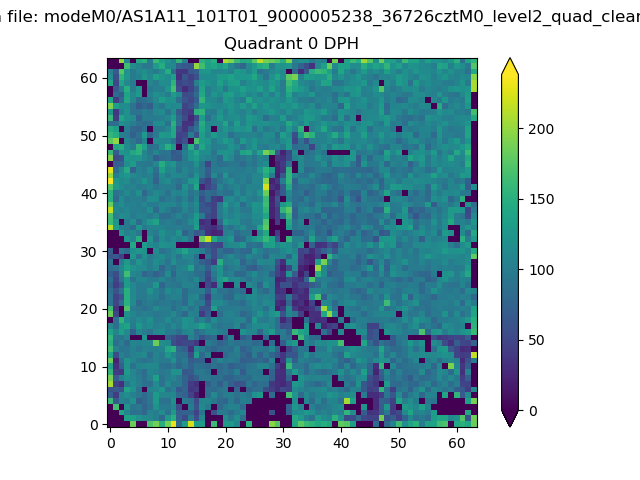 |
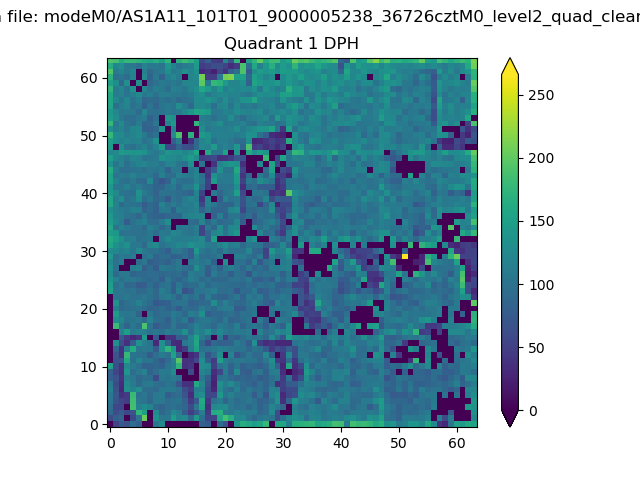 |
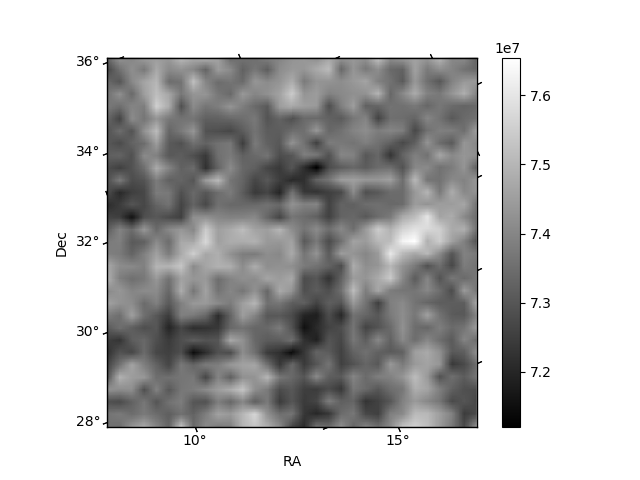
Quadrant B |
|---|---|---|---|
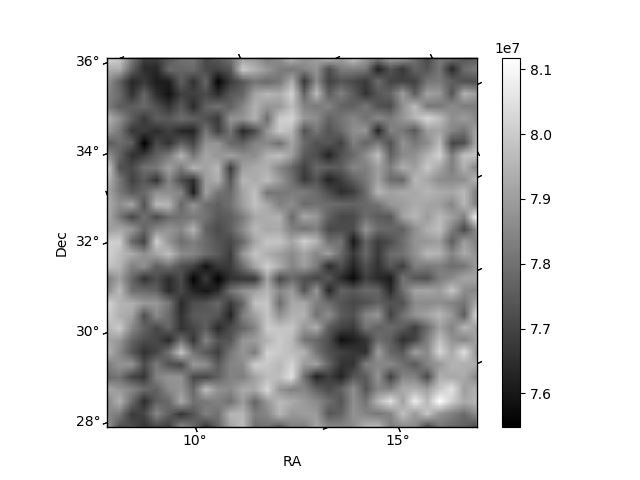
| Quadrant D | 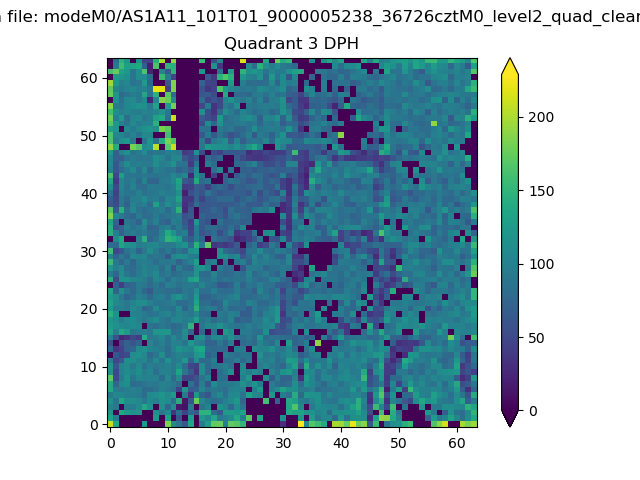 |
 |
Quadrant C |
| Plot type | Count rate plots | Images |
|---|---|---|
| Comparison with Poisson distribution Blue bars denote a histogram of data divided into 1 sec bins. Red curve is a Poisson curve with rate = median count rate of data. |
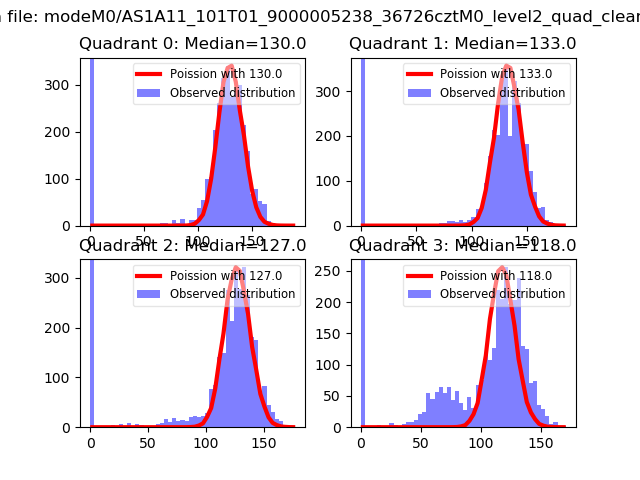 |
 |
| Quadrant-wise count rates Data is divided into 100 sec bins |
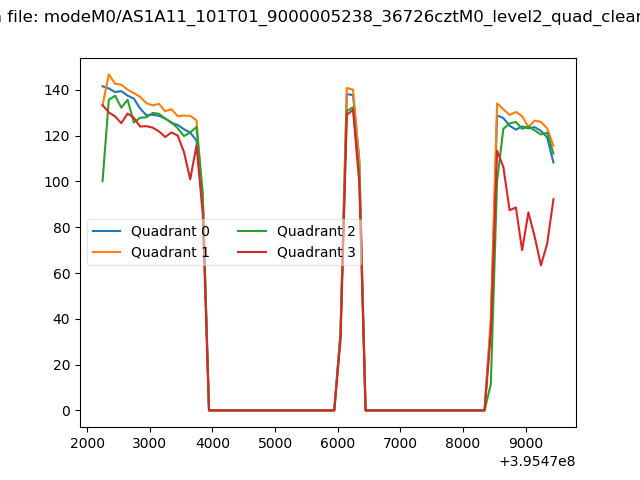 |
|
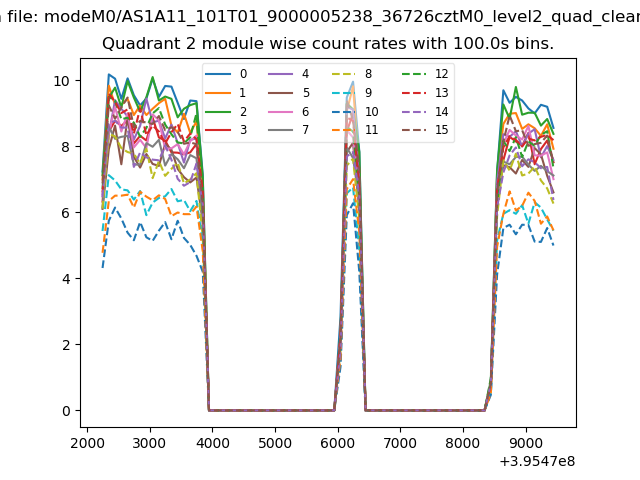
| Module-wise count rates for Quadrant A Data is divided into 100 sec bins |
 |
 |
| Module-wise count rates for Quadrant B Data is divided into 100 sec bins |
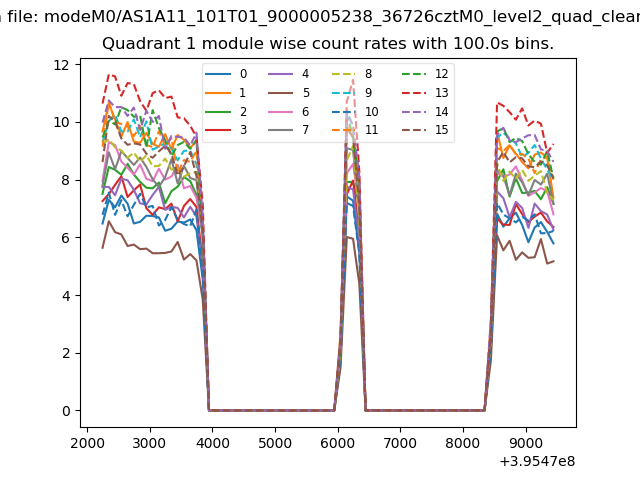 |
 |
| Module-wise count rates for Quadrant C Data is divided into 100 sec bins |
 |
 |
| Module-wise count rates for Quadrant D Data is divided into 100 sec bins |
 |
 |
| Parameter | Plot |
|---|---|
| CZT HV Monitor | 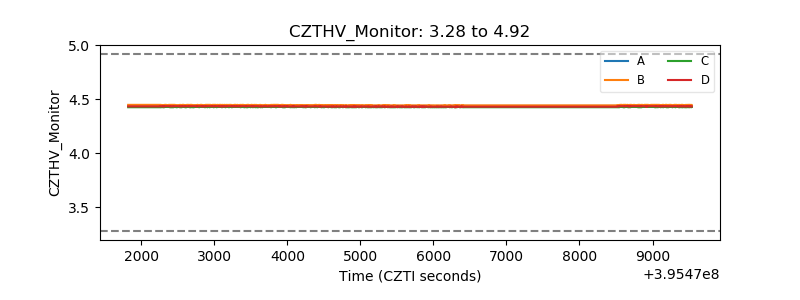 |
| D_VDD | 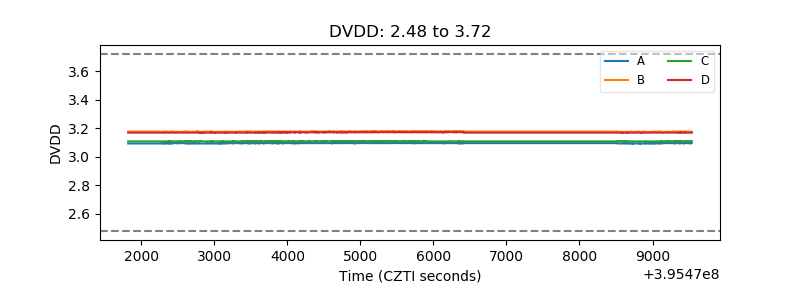 |
| Temperature 1 | 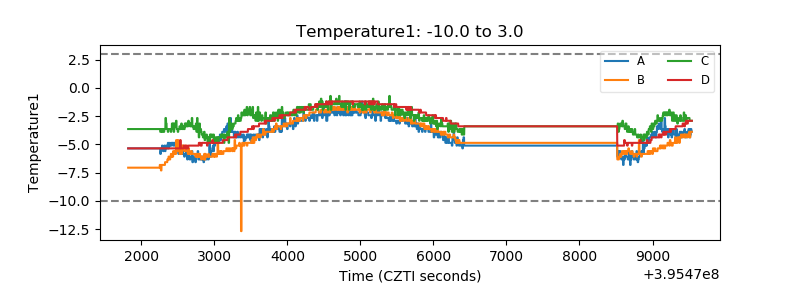 |
| Veto HV Monitor |  |
| Veto LLD | 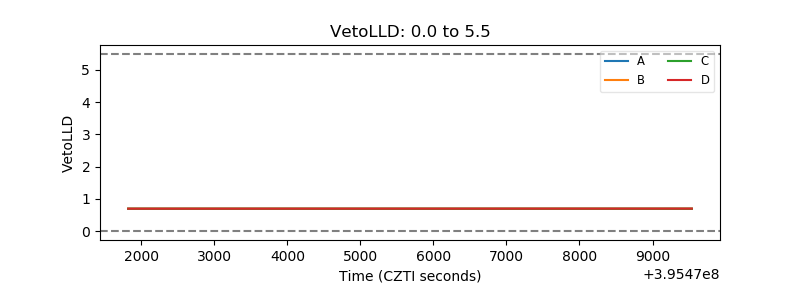 |
| Alpha Counter | 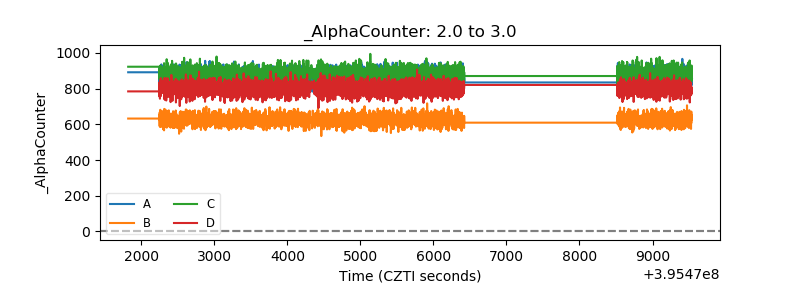 |
| _CPM_Rate | 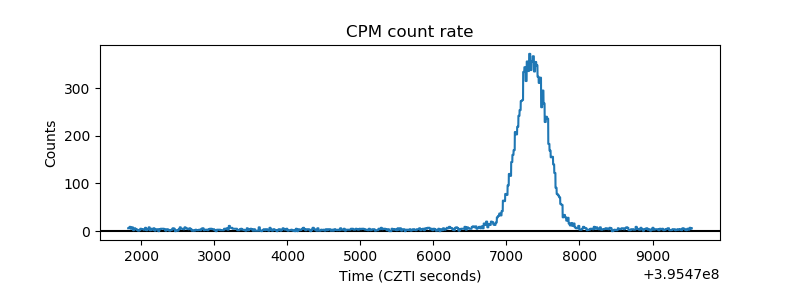 |
| CZT Counter |  |
| +2.5 Volts monitor | 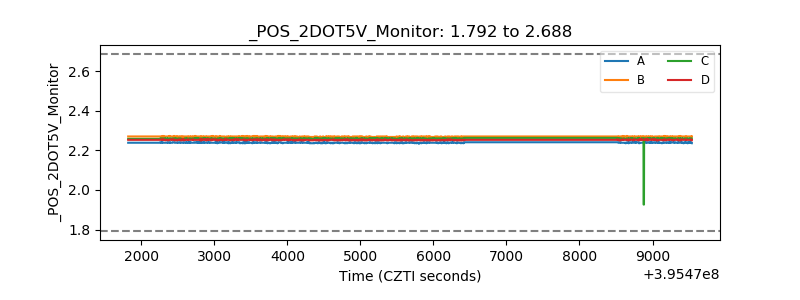 |
| +5 Volts monitor |  |
| _ROLL_ROT | 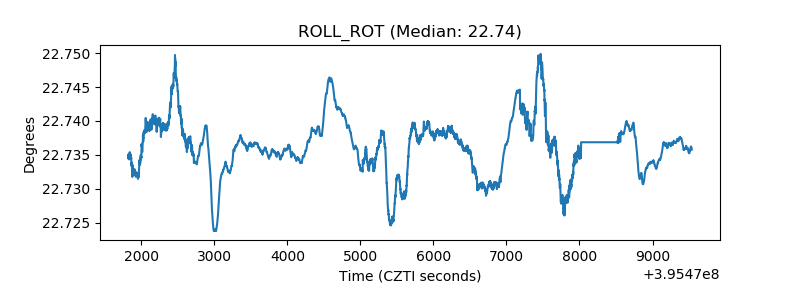 |
| _Roll_DEC | 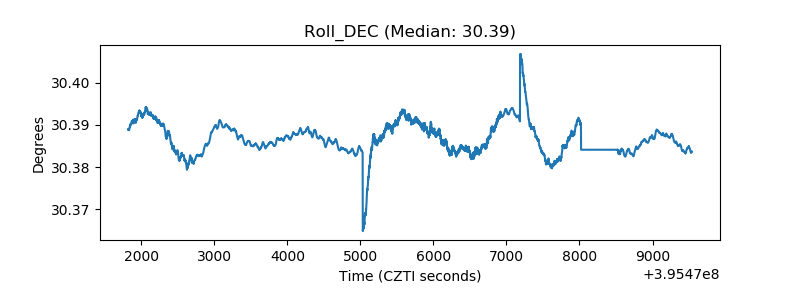 |
| _Roll_RA |  |
| Veto Counter | 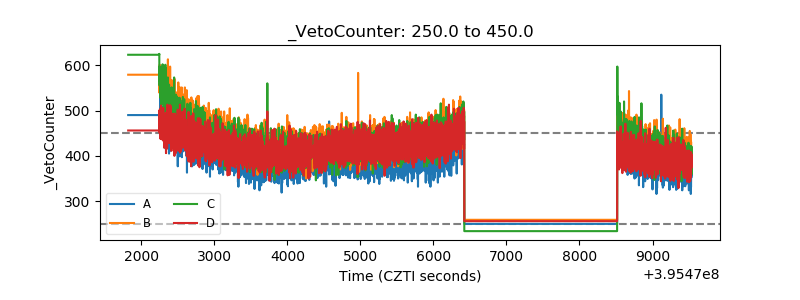 |