| Param | Original file | Final file |
|---|---|---|
| Filename | modeM0/AS1A11_101T01_9000005238_36727cztM0_level2.evt | modeM0/AS1A11_101T01_9000005238_36727cztM0_level2_quad_clean.evt |
| Size (bytes) | 522,388,800 | 59,402,880 |
| Size | 498.2 MB | 56.7 MB |
| Events in quadrant A | 2,658,791 | 371,043 |
| Events in quadrant B | 2,784,371 | 381,215 |
| Events in quadrant C | 3,360,658 | 362,502 |
| Events in quadrant D | 6,646,617 | 301,170 |
| Mode M0 | |||
|---|---|---|---|
| Quadrant | BADHDUFLAG | Total packets | Discarded packets |
| A | 0 | 11249 | 2 |
| B | 0 | 11682 | 1 |
| C | 0 | 13356 | 1 |
| D | 0 | 23493 | 1 |
| Mode SS | |||
|---|---|---|---|
| Quadrant | BADHDUFLAG | Total packets | Discarded packets |
| A | 0 | 110 | 0 |
| B | 0 | 110 | 0 |
| C | 0 | 110 | 0 |
| D | 0 | 110 | 0 |
| Mode M9 | |||
|---|---|---|---|
| Quadrant | BADHDUFLAG | Total packets | Discarded packets |
| A | 0 | 19 | 0 |
| B | 0 | 19 | 0 |
| C | 0 | 19 | 0 |
| D | 0 | 19 | 0 |
| Quadrant | Total seconds | Saturated seconds | Saturation percentage |
|---|---|---|---|
| A | 5461 | 5 | 0.091558% |
| B | 5461 | 7 | 0.128182% |
| C | 5461 | 145 | 2.655191% |
| D | 5461 | 1161 | 21.259843% |
Noise dominated data is calculated using 1-second bins in cleaned event files. If a bin has >2000 counts, and if more than 50% of those come from <1% of pixels, then it is considered to be noise-dominated and hence unusable.
| Quadrant | # 1 sec bins | Bins with >0 counts | Bins with >2000 counts | High rate bins dominated by noise | Noise dominated (total time) | Noise dominated (detector-on time) | Marked lightcurve |
|---|---|---|---|---|---|---|---|
| A | 7375 | 5462 | 0 | 0 | 0.00% | 0.00% | 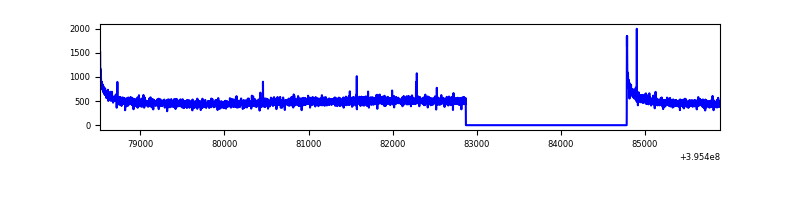 |
| B | 7375 | 5462 | 0 | 0 | 0.00% | 0.00% | 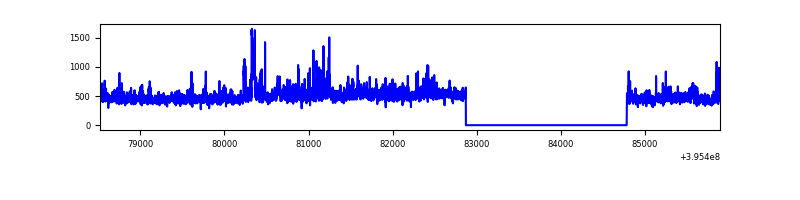 |
| C | 7375 | 5462 | 139 | 139 | 1.88% | 2.54% | 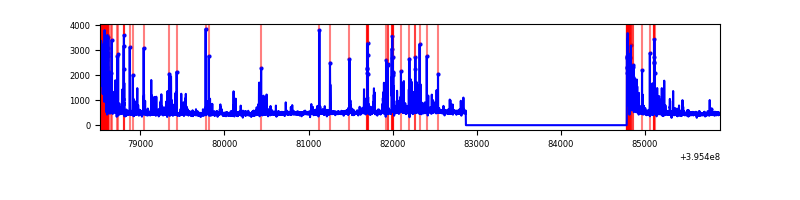 |
| D | 7375 | 5462 | 1277 | 1277 | 17.32% | 23.38% | 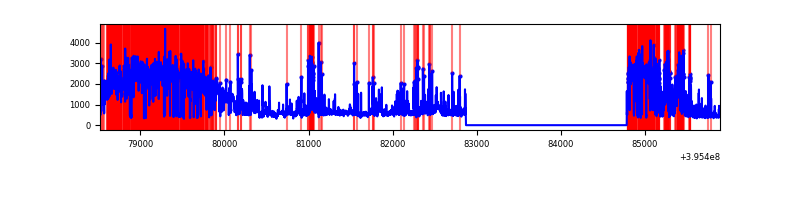 |
Top three noisy pixels from each quadrant. If the there are fewer than three noisy pixels in the level2.evt file, extra rows are filled as -1
| Pixel properties | Quadrant properties | ||||||
|---|---|---|---|---|---|---|---|
| Quadrant | DetID | PixID | Counts | Sigma | Mean | Median | Sigma |
| A | 10 | 83 | 225959 | 1787.11 | 625 | 613 | 126.1 |
| A | 13 | 254 | 8964 | 66.23 | 625 | 613 | 126.1 |
| A | 13 | 6 | 6947 | 50.23 | 625 | 613 | 126.1 |
| B | 0 | 221 | 119861 | 995.55 | 619 | 603 | 119.8 |
| B | 0 | 189 | 81693 | 676.93 | 619 | 603 | 119.8 |
| B | 4 | 232 | 44057 | 362.75 | 619 | 603 | 119.8 |
| C | 14 | 254 | 442003 | 3195.21 | 595 | 597 | 138.1 |
| C | 0 | 10 | 343606 | 2482.94 | 595 | 597 | 138.1 |
| C | 15 | 214 | 247554 | 1787.65 | 595 | 597 | 138.1 |
| D | 1 | 20 | 3441611 | 24302.34 | 569 | 552 | 141.6 |
| D | 12 | 17 | 190802 | 1343.63 | 569 | 552 | 141.6 |
| D | 12 | 227 | 181701 | 1279.36 | 569 | 552 | 141.6 |
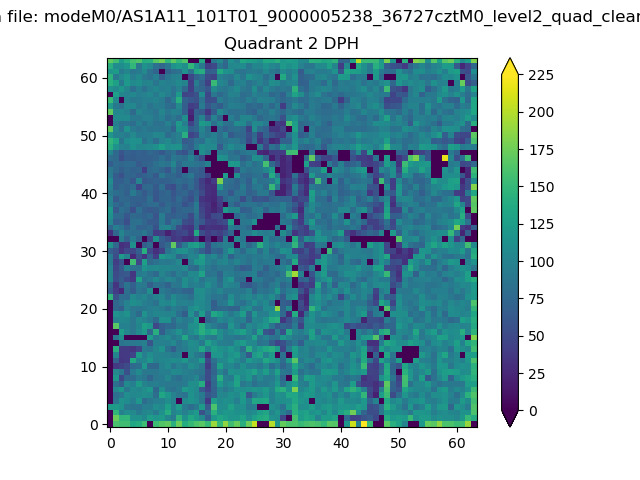
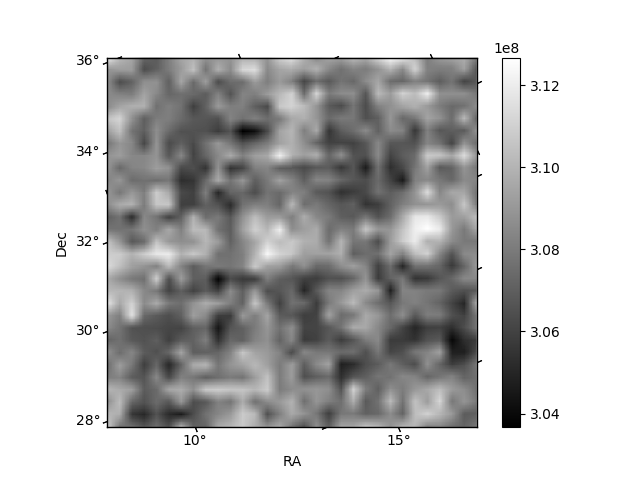
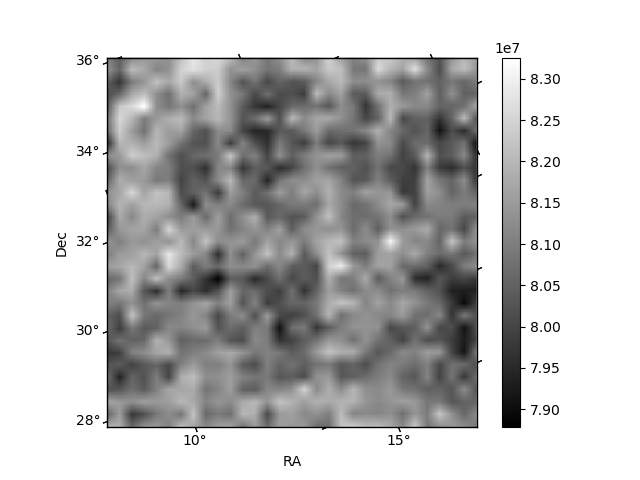
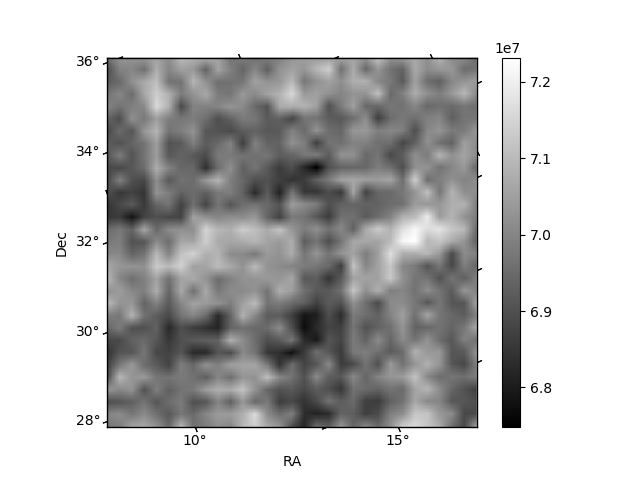
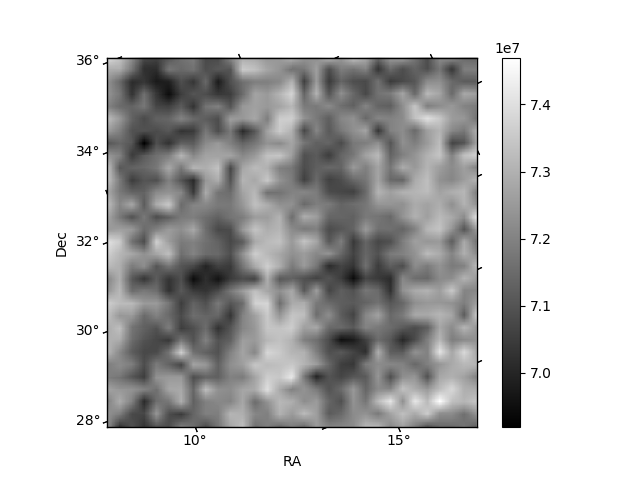
Histogram calculated using DETX and DETY for each event in the final _common_clean file
| Quadrant A | 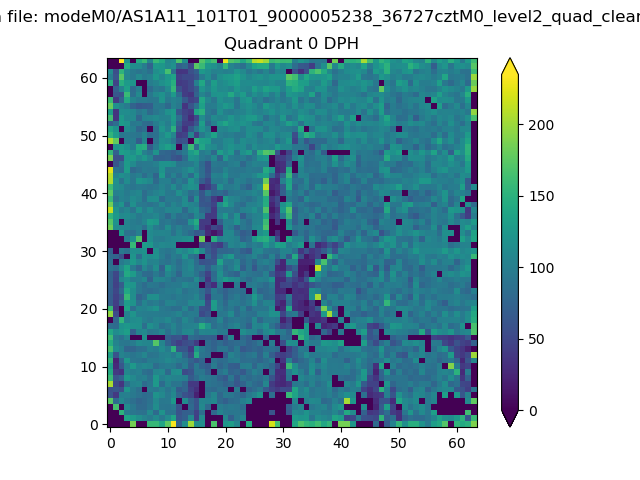 |
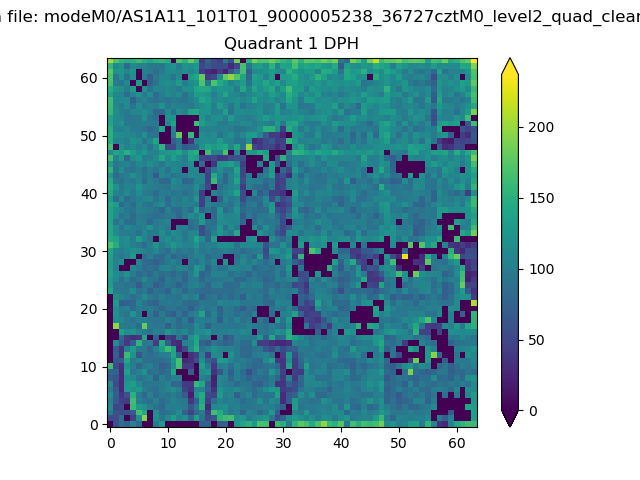 |
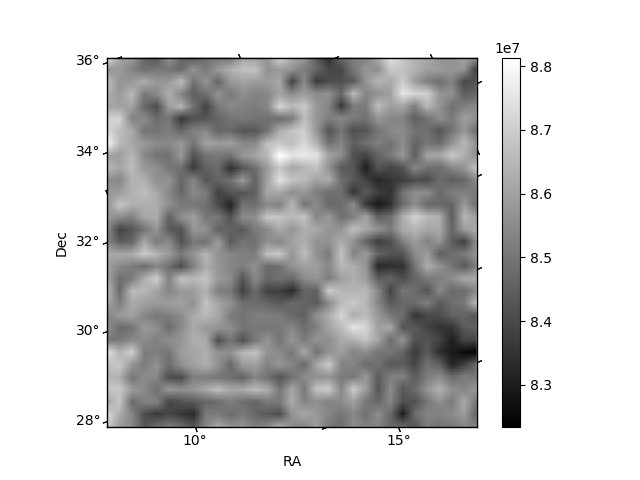
Quadrant B |
|---|---|---|---|
| Quadrant D | 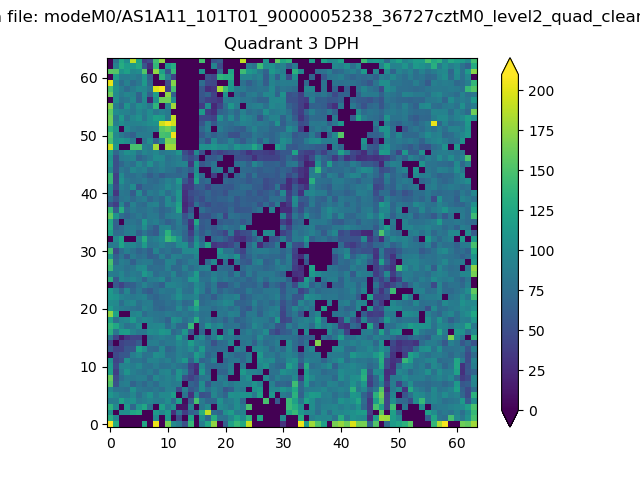 |
 |
Quadrant C |
| Plot type | Count rate plots | Images |
|---|---|---|
| Comparison with Poisson distribution Blue bars denote a histogram of data divided into 1 sec bins. Red curve is a Poisson curve with rate = median count rate of data. |
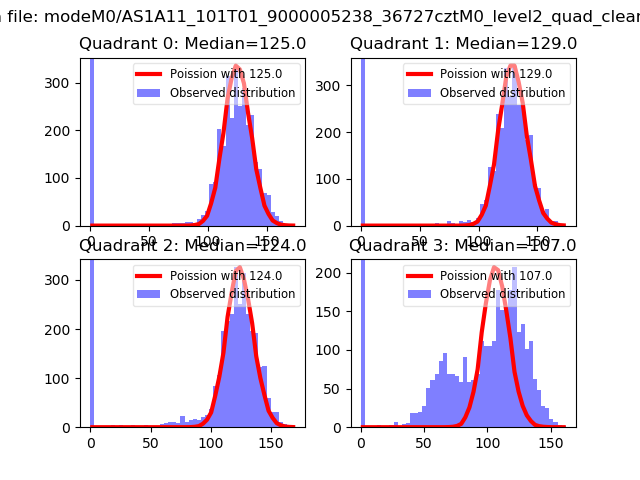 |
 |
| Quadrant-wise count rates Data is divided into 100 sec bins |
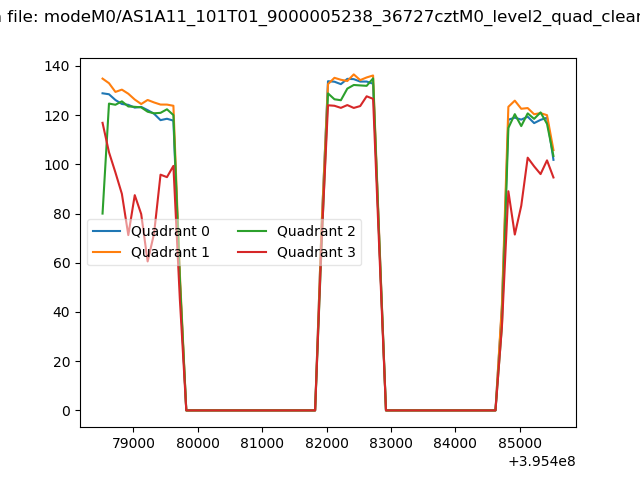 |
|
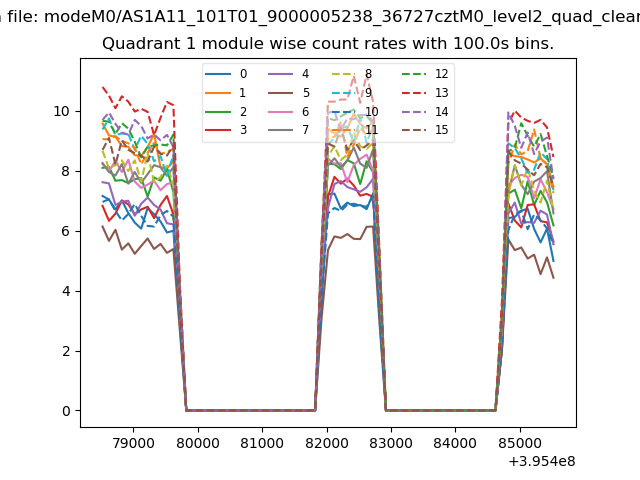
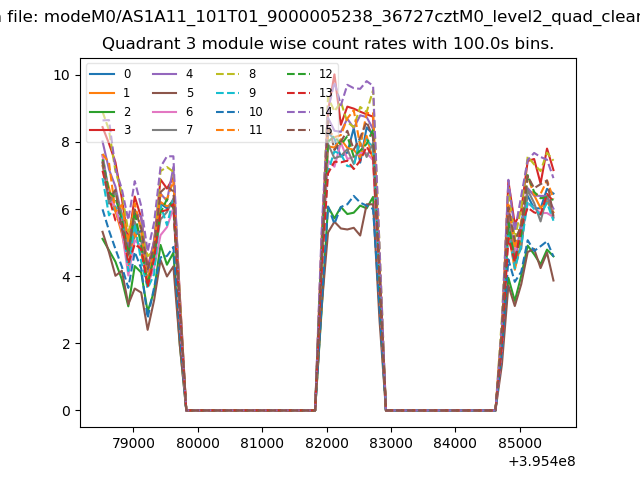
| Module-wise count rates for Quadrant A Data is divided into 100 sec bins |
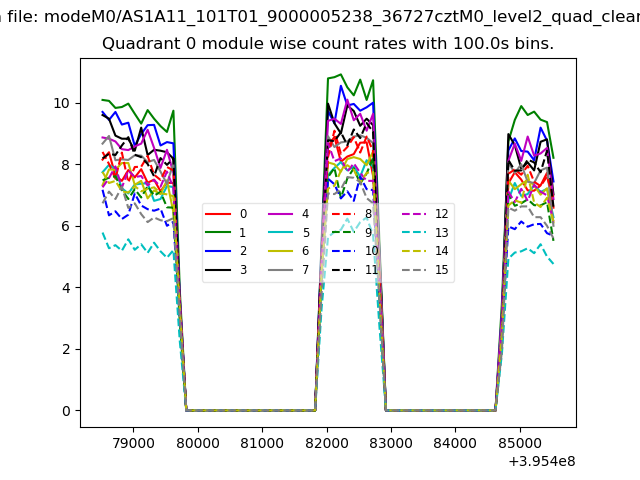 |
 |
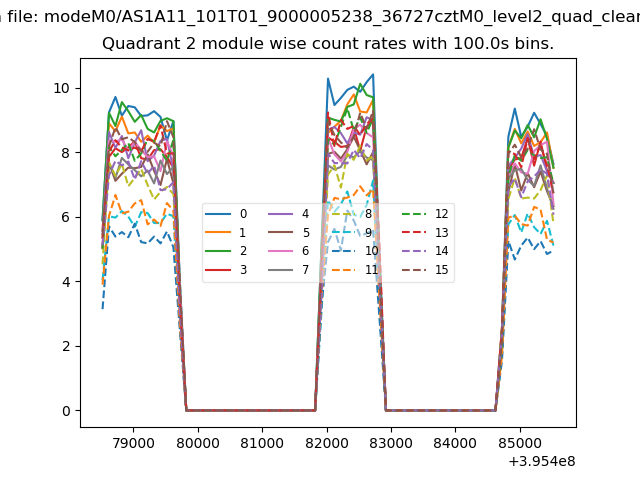
| Module-wise count rates for Quadrant B Data is divided into 100 sec bins |
 |
 |
| Module-wise count rates for Quadrant C Data is divided into 100 sec bins |
 |
 |
| Module-wise count rates for Quadrant D Data is divided into 100 sec bins |
 |
 |
| Parameter | Plot |
|---|---|
| CZT HV Monitor | 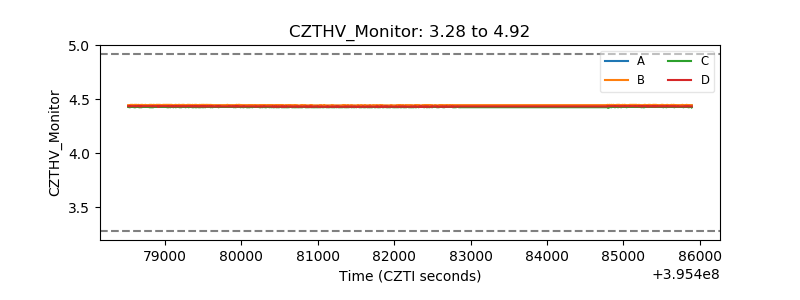 |
| D_VDD | 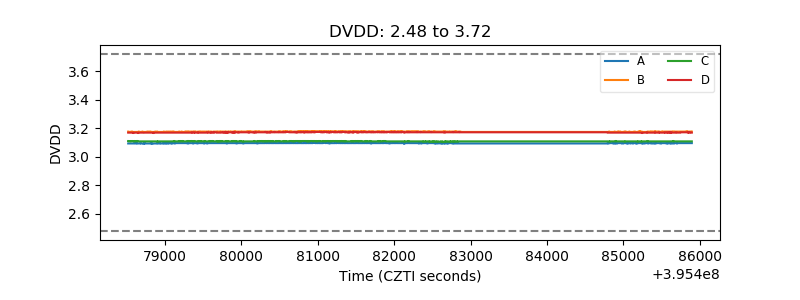 |
| Temperature 1 | 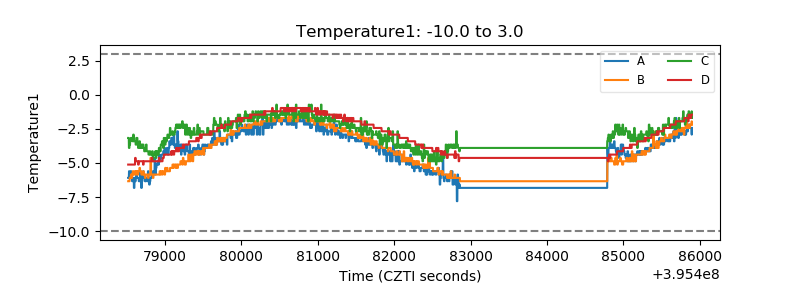 |
| Veto HV Monitor | 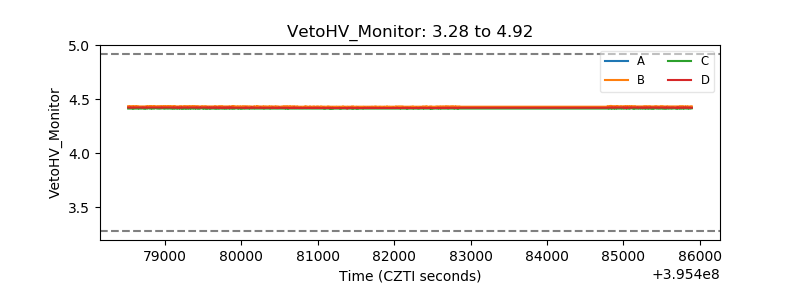 |
| Veto LLD | 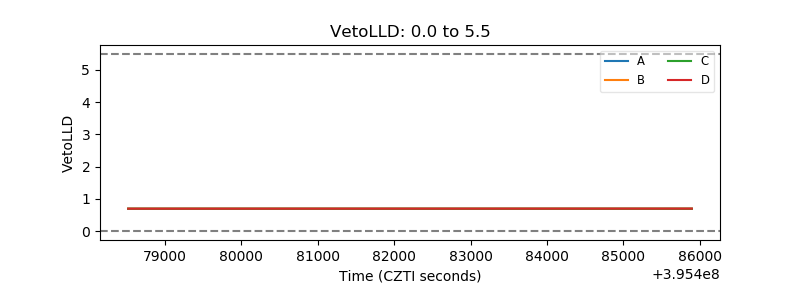 |
| Alpha Counter | 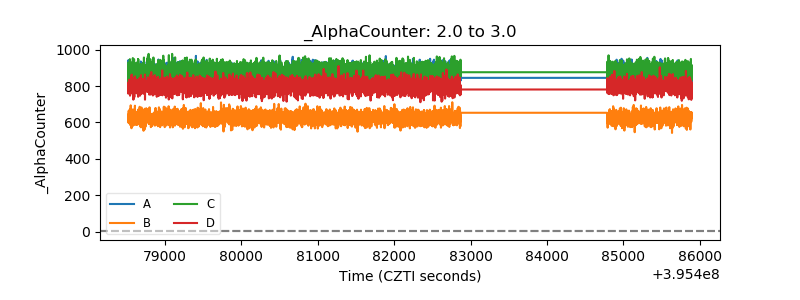 |
| _CPM_Rate | 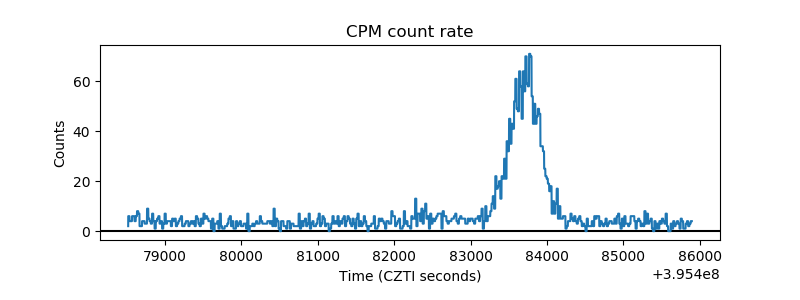 |
| CZT Counter | 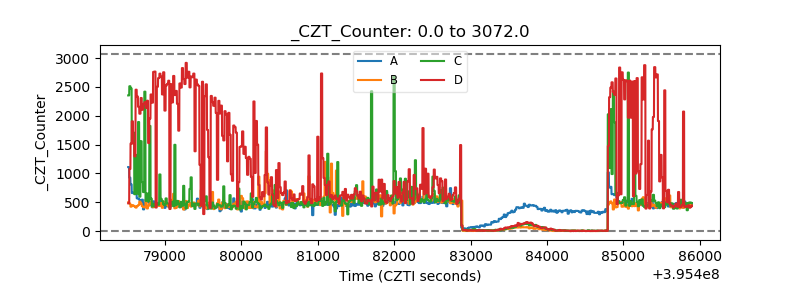 |
| +2.5 Volts monitor | 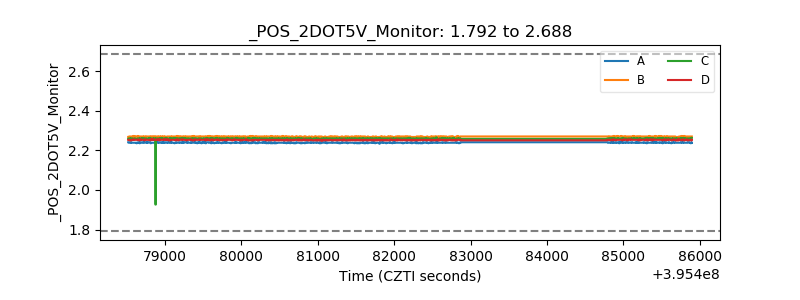 |
| +5 Volts monitor | 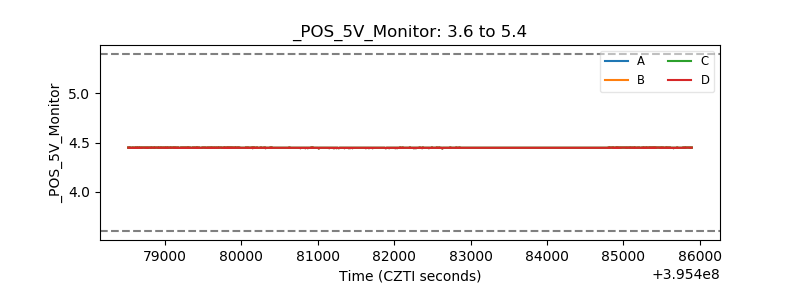 |
| _ROLL_ROT | 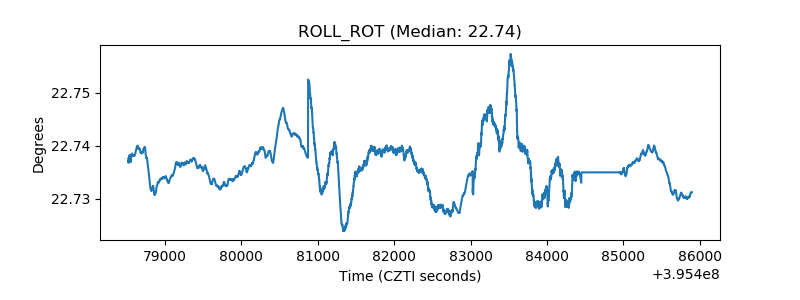 |
| _Roll_DEC |  |
| _Roll_RA | 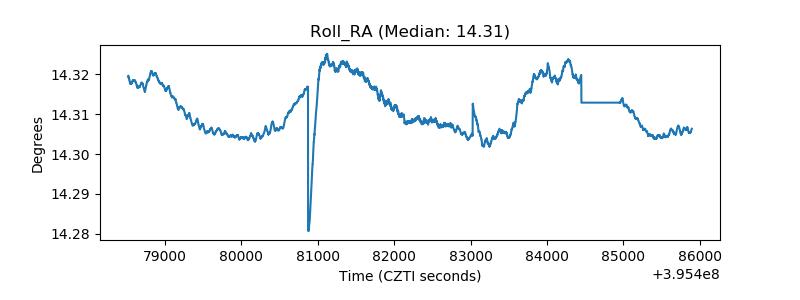 |
| Veto Counter | 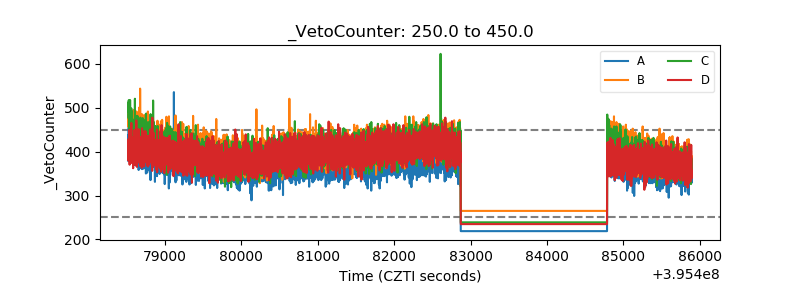 |