| Param | Original file | Final file |
|---|---|---|
| Filename | modeM0/AS1A11_101T01_9000005238_36728cztM0_level2.evt | modeM0/AS1A11_101T01_9000005238_36728cztM0_level2_quad_clean.evt |
| Size (bytes) | 474,022,080 | 56,240,640 |
| Size | 452.1 MB | 53.6 MB |
| Events in quadrant A | 2,677,620 | 337,830 |
| Events in quadrant B | 3,067,916 | 344,114 |
| Events in quadrant C | 3,560,978 | 326,307 |
| Events in quadrant D | 4,669,374 | 302,753 |
| Mode M0 | |||
|---|---|---|---|
| Quadrant | BADHDUFLAG | Total packets | Discarded packets |
| A | 0 | 11392 | 2 |
| B | 0 | 12630 | 1 |
| C | 0 | 13997 | 1 |
| D | 0 | 17664 | 1 |
| Mode SS | |||
|---|---|---|---|
| Quadrant | BADHDUFLAG | Total packets | Discarded packets |
| A | 0 | 114 | 0 |
| B | 0 | 114 | 0 |
| C | 0 | 114 | 0 |
| D | 0 | 114 | 0 |
| Mode M9 | |||
|---|---|---|---|
| Quadrant | BADHDUFLAG | Total packets | Discarded packets |
| A | 0 | 16 | 0 |
| B | 0 | 16 | 0 |
| C | 0 | 16 | 0 |
| D | 0 | 16 | 0 |
| Quadrant | Total seconds | Saturated seconds | Saturation percentage |
|---|---|---|---|
| A | 5598 | 6 | 0.107181% |
| B | 5598 | 56 | 1.000357% |
| C | 5598 | 210 | 3.751340% |
| D | 5598 | 353 | 6.305824% |
Noise dominated data is calculated using 1-second bins in cleaned event files. If a bin has >2000 counts, and if more than 50% of those come from <1% of pixels, then it is considered to be noise-dominated and hence unusable.
| Quadrant | # 1 sec bins | Bins with >0 counts | Bins with >2000 counts | High rate bins dominated by noise | Noise dominated (total time) | Noise dominated (detector-on time) | Marked lightcurve |
|---|---|---|---|---|---|---|---|
| A | 7181 | 5599 | 1 | 1 | 0.01% | 0.02% | 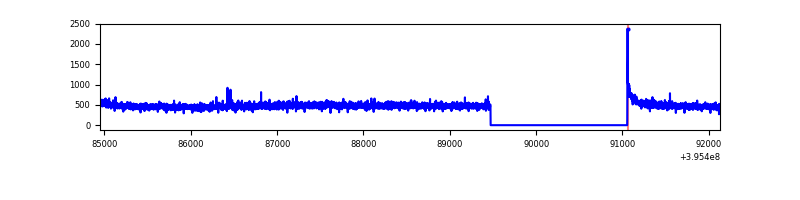 |
| B | 7181 | 5599 | 40 | 40 | 0.56% | 0.71% | 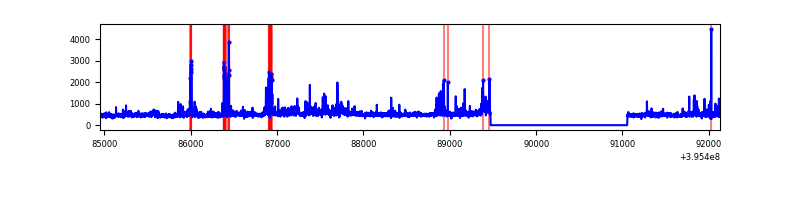 |
| C | 7181 | 5599 | 165 | 165 | 2.30% | 2.95% | 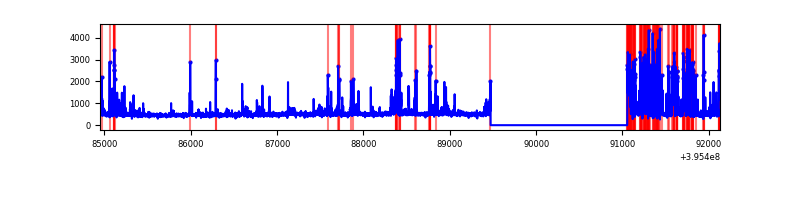 |
| D | 7181 | 5599 | 357 | 357 | 4.97% | 6.38% | 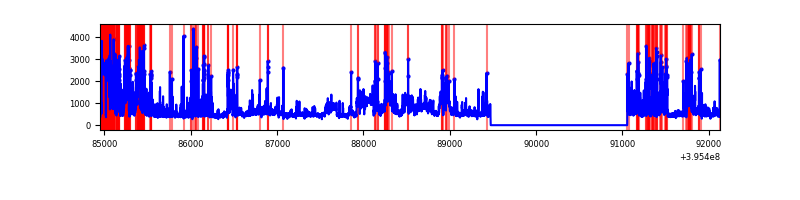 |
Top three noisy pixels from each quadrant. If the there are fewer than three noisy pixels in the level2.evt file, extra rows are filled as -1
| Pixel properties | Quadrant properties | ||||||
|---|---|---|---|---|---|---|---|
| Quadrant | DetID | PixID | Counts | Sigma | Mean | Median | Sigma |
| A | 10 | 83 | 192686 | 1487.52 | 639 | 627 | 129.1 |
| A | 13 | 254 | 11823 | 86.71 | 639 | 627 | 129.1 |
| A | 9 | 143 | 9546 | 69.08 | 639 | 627 | 129.1 |
| B | 0 | 189 | 134503 | 1090.48 | 632 | 615 | 122.8 |
| B | 0 | 221 | 91187 | 737.69 | 632 | 615 | 122.8 |
| B | 5 | 172 | 81234 | 656.62 | 632 | 615 | 122.8 |
| C | 14 | 254 | 569800 | 4031.79 | 605 | 608 | 141.2 |
| C | 0 | 10 | 361511 | 2556.4 | 605 | 608 | 141.2 |
| C | 15 | 214 | 244971 | 1730.91 | 605 | 608 | 141.2 |
| D | 1 | 20 | 1012824 | 6877.97 | 603 | 586 | 147.2 |
| D | 12 | 233 | 290156 | 1967.57 | 603 | 586 | 147.2 |
| D | 12 | 17 | 205755 | 1394.09 | 603 | 586 | 147.2 |
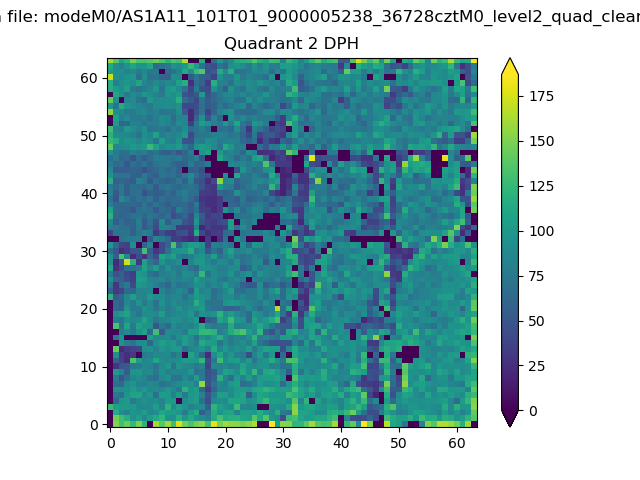
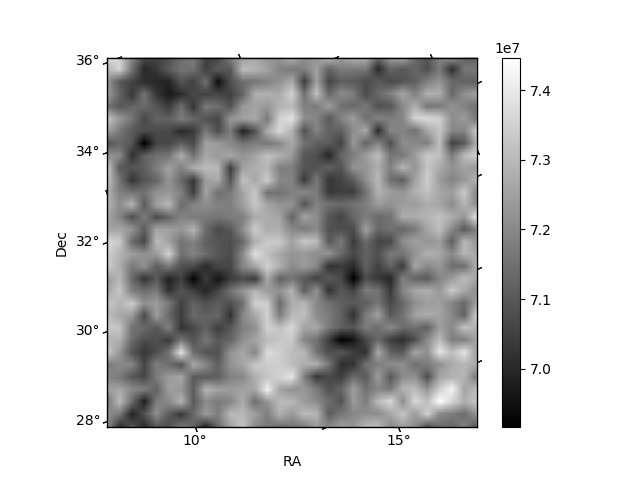
Histogram calculated using DETX and DETY for each event in the final _common_clean file
| Quadrant A | 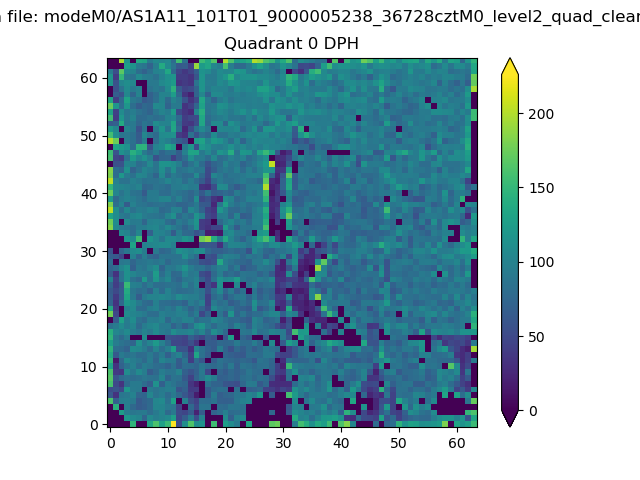 |
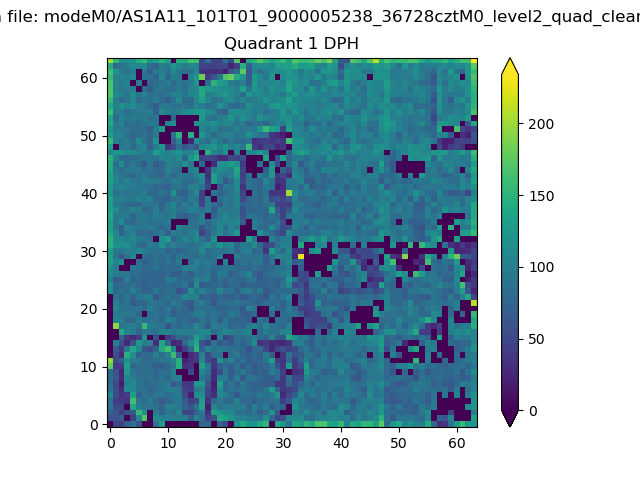 |
Quadrant B |
|---|---|---|---|
| Quadrant D | 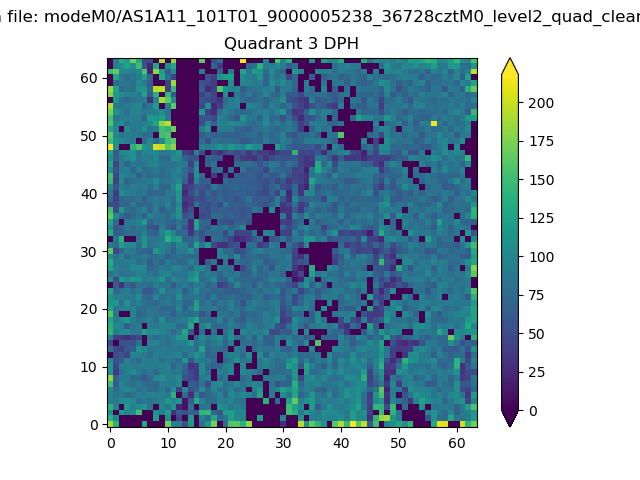 |
 |
Quadrant C |
| Plot type | Count rate plots | Images |
|---|---|---|
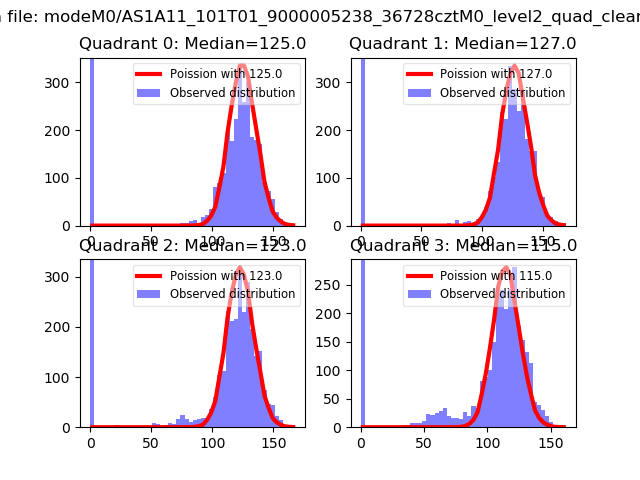
| Comparison with Poisson distribution Blue bars denote a histogram of data divided into 1 sec bins. Red curve is a Poisson curve with rate = median count rate of data. |
 |
 |
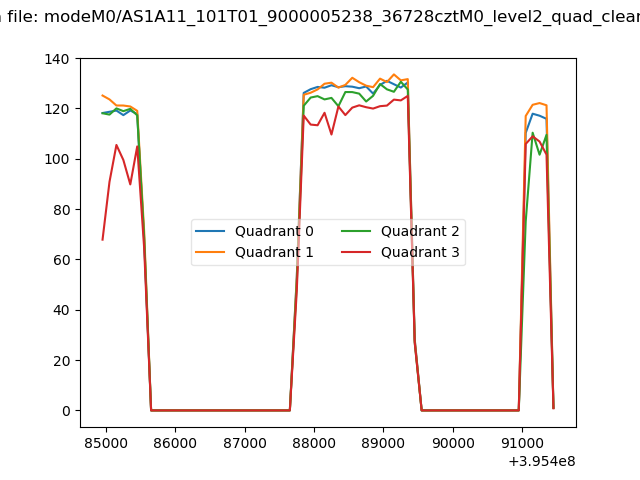
| Quadrant-wise count rates Data is divided into 100 sec bins |
 |
|
| Module-wise count rates for Quadrant A Data is divided into 100 sec bins |
 |
 |
| Module-wise count rates for Quadrant B Data is divided into 100 sec bins |
 |
 |
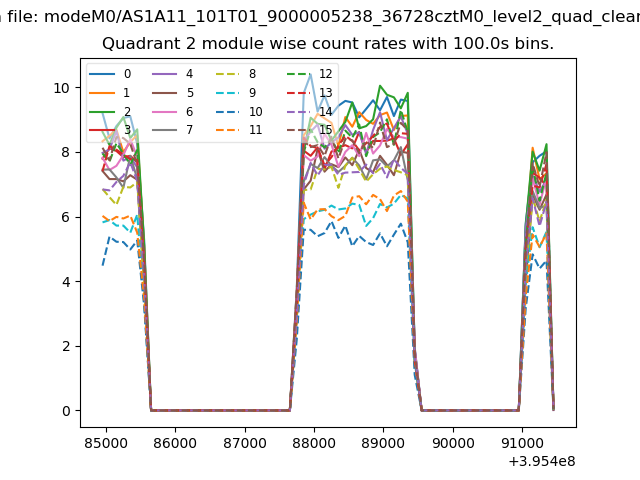
| Module-wise count rates for Quadrant C Data is divided into 100 sec bins |
 |
 |
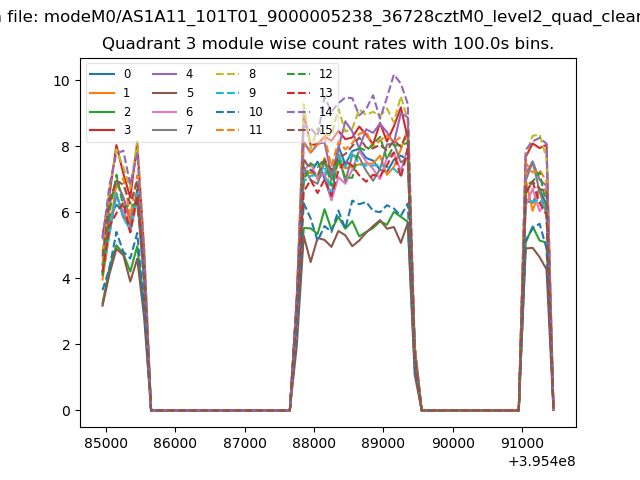
| Module-wise count rates for Quadrant D Data is divided into 100 sec bins |
 |
 |
| Parameter | Plot |
|---|---|
| CZT HV Monitor |  |
| D_VDD | 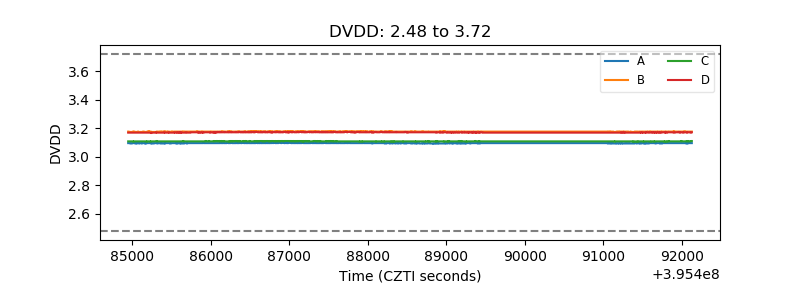 |
| Temperature 1 | 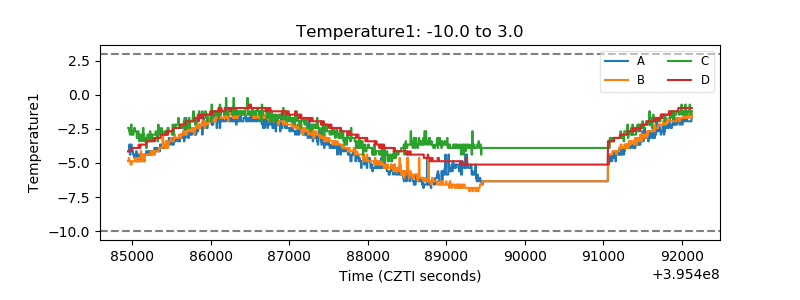 |
| Veto HV Monitor |  |
| Veto LLD |  |
| Alpha Counter | 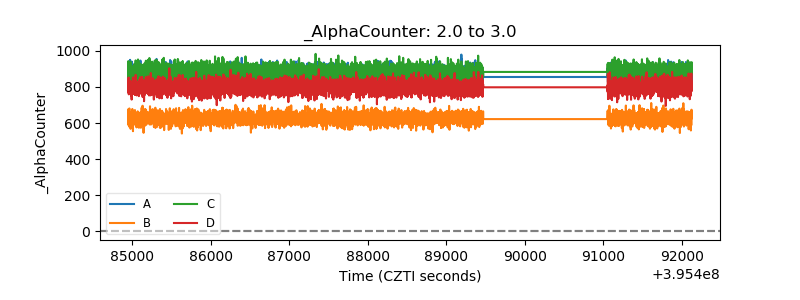 |
| _CPM_Rate | 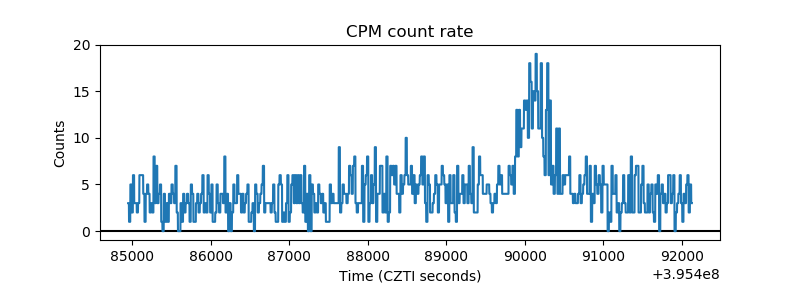 |
| CZT Counter | 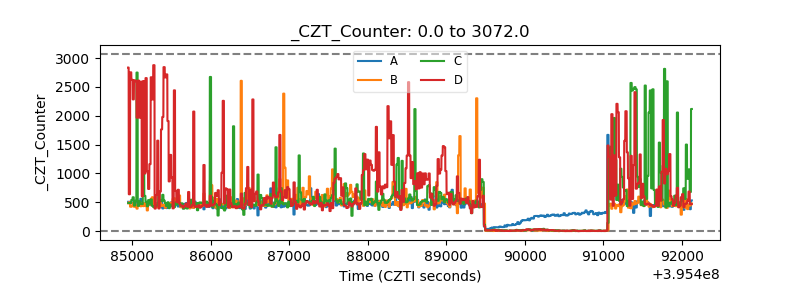 |
| +2.5 Volts monitor | 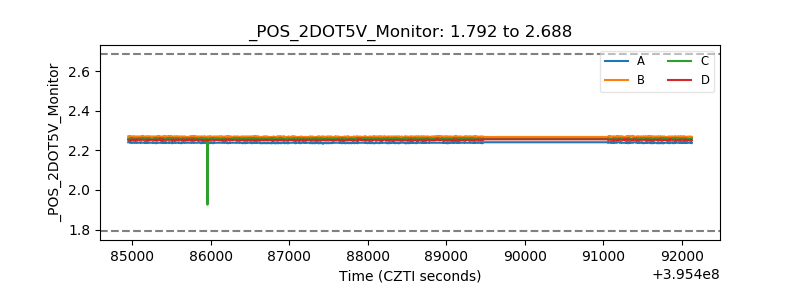 |
| +5 Volts monitor |  |
| _ROLL_ROT |  |
| _Roll_DEC | 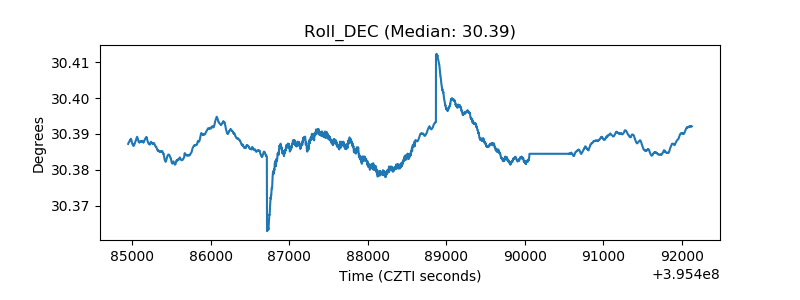 |
| _Roll_RA | 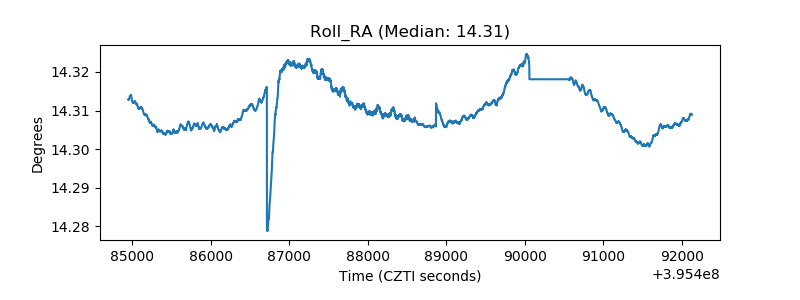 |
| Veto Counter |  |