| Param | Original file | Final file |
|---|---|---|
| Filename | modeM0/AS1A11_101T01_9000005238_36729cztM0_level2.evt | modeM0/AS1A11_101T01_9000005238_36729cztM0_level2_quad_clean.evt |
| Size (bytes) | 530,210,880 | 56,756,160 |
| Size | 505.6 MB | 54.1 MB |
| Events in quadrant A | 2,961,001 | 337,966 |
| Events in quadrant B | 3,192,512 | 342,373 |
| Events in quadrant C | 3,940,415 | 325,617 |
| Events in quadrant D | 5,560,503 | 296,431 |
| Mode M0 | |||
|---|---|---|---|
| Quadrant | BADHDUFLAG | Total packets | Discarded packets |
| A | 0 | 12515 | 3 |
| B | 0 | 13166 | 2 |
| C | 0 | 15318 | 2 |
| D | 0 | 20580 | 2 |
| Mode SS | |||
|---|---|---|---|
| Quadrant | BADHDUFLAG | Total packets | Discarded packets |
| A | 0 | 120 | 0 |
| B | 0 | 120 | 0 |
| C | 0 | 120 | 0 |
| D | 0 | 120 | 0 |
| Mode M9 | |||
|---|---|---|---|
| Quadrant | BADHDUFLAG | Total packets | Discarded packets |
| A | 0 | 18 | 0 |
| B | 0 | 18 | 0 |
| C | 0 | 18 | 0 |
| D | 0 | 19 | 0 |
| Quadrant | Total seconds | Saturated seconds | Saturation percentage |
|---|---|---|---|
| A | 5951 | 24 | 0.403294% |
| B | 5951 | 35 | 0.588136% |
| C | 5951 | 283 | 4.755503% |
| D | 5951 | 492 | 8.267518% |
Noise dominated data is calculated using 1-second bins in cleaned event files. If a bin has >2000 counts, and if more than 50% of those come from <1% of pixels, then it is considered to be noise-dominated and hence unusable.
| Quadrant | # 1 sec bins | Bins with >0 counts | Bins with >2000 counts | High rate bins dominated by noise | Noise dominated (total time) | Noise dominated (detector-on time) | Marked lightcurve |
|---|---|---|---|---|---|---|---|
| A | 7293 | 5952 | 14 | 14 | 0.19% | 0.24% | 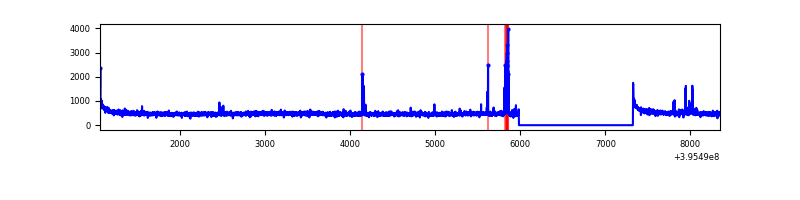 |
| B | 7293 | 5952 | 19 | 19 | 0.26% | 0.32% | 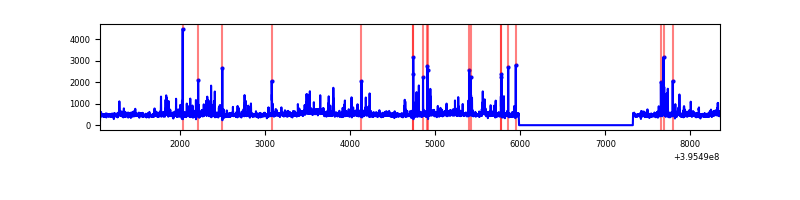 |
| C | 7293 | 5952 | 222 | 222 | 3.04% | 3.73% | 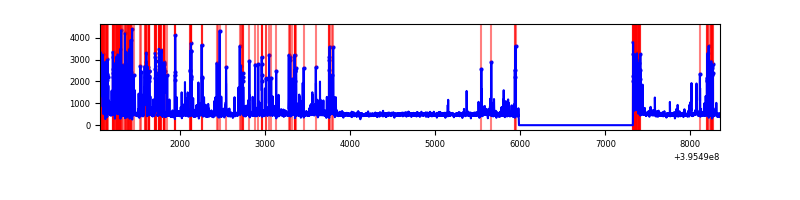 |
| D | 7293 | 5952 | 477 | 477 | 6.54% | 8.01% | 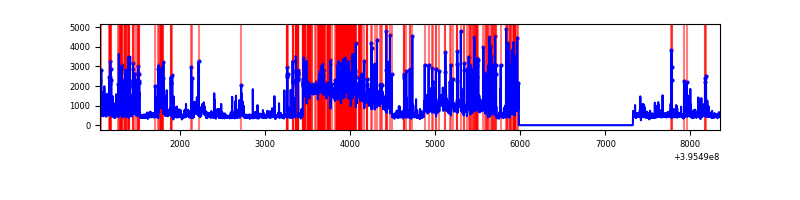 |
Top three noisy pixels from each quadrant. If the there are fewer than three noisy pixels in the level2.evt file, extra rows are filled as -1
| Pixel properties | Quadrant properties | ||||||
|---|---|---|---|---|---|---|---|
| Quadrant | DetID | PixID | Counts | Sigma | Mean | Median | Sigma |
| A | 10 | 83 | 234515 | 1702.02 | 676 | 661 | 137.4 |
| A | 9 | 143 | 81490 | 588.29 | 676 | 661 | 137.4 |
| A | 7 | 3 | 21617 | 152.52 | 676 | 661 | 137.4 |
| B | 5 | 255 | 139144 | 1066.3 | 671 | 652 | 129.9 |
| B | 0 | 189 | 98067 | 750.04 | 671 | 652 | 129.9 |
| B | 0 | 229 | 69184 | 527.65 | 671 | 652 | 129.9 |
| C | 14 | 254 | 701280 | 4694.68 | 637 | 641 | 149.2 |
| C | 0 | 10 | 450896 | 3016.96 | 637 | 641 | 149.2 |
| C | 15 | 214 | 262705 | 1755.98 | 637 | 641 | 149.2 |
| D | 1 | 20 | 1902080 | 12126.84 | 637 | 616 | 156.8 |
| D | 12 | 233 | 412895 | 2629.36 | 637 | 616 | 156.8 |
| D | 2 | 153 | 159180 | 1011.26 | 637 | 616 | 156.8 |
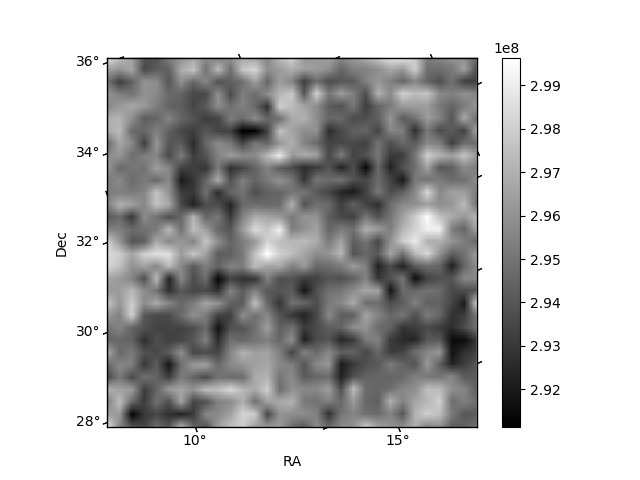
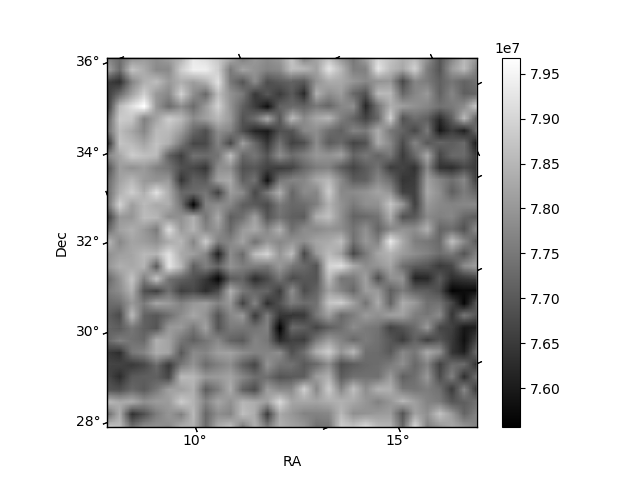
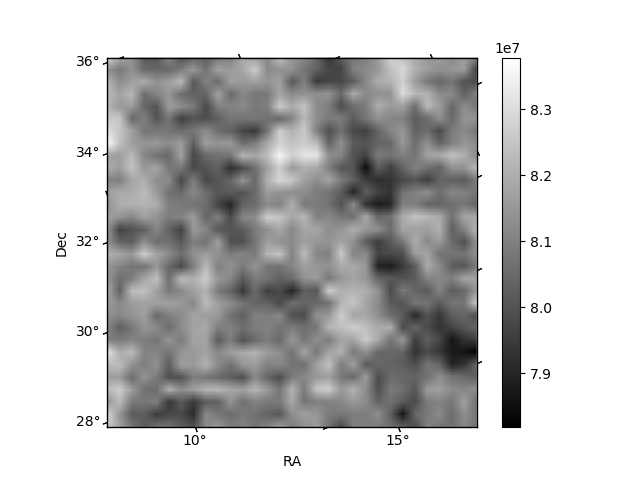
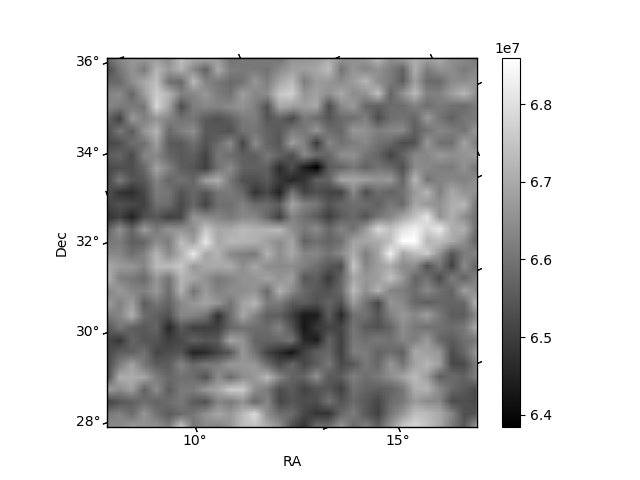
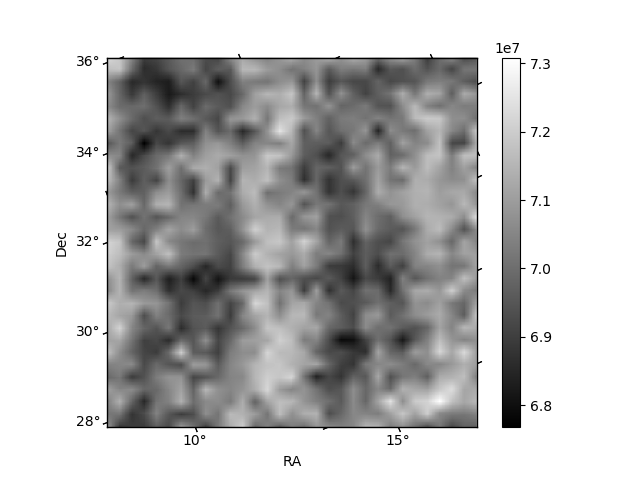
Histogram calculated using DETX and DETY for each event in the final _common_clean file
| Quadrant A | 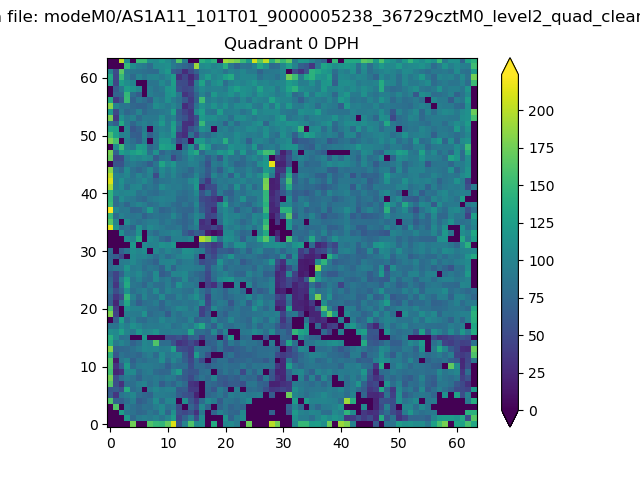 |
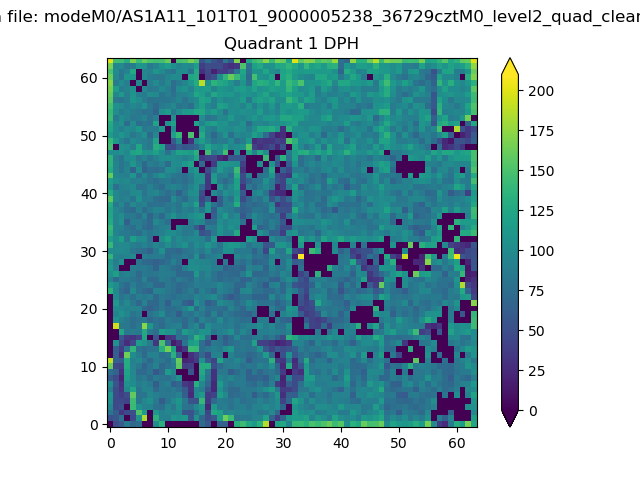 |
Quadrant B |
|---|---|---|---|
| Quadrant D | 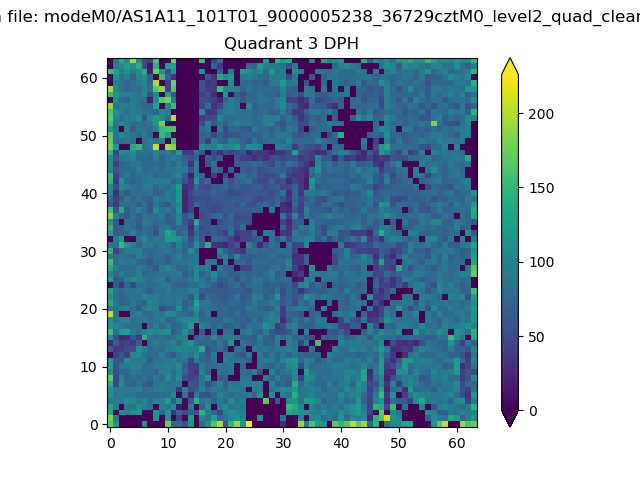 |
 |
Quadrant C |
| Plot type | Count rate plots | Images |
|---|---|---|
| Comparison with Poisson distribution Blue bars denote a histogram of data divided into 1 sec bins. Red curve is a Poisson curve with rate = median count rate of data. |
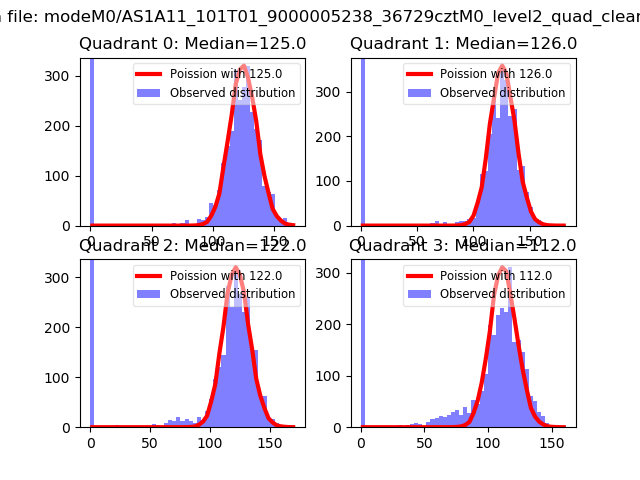 |
 |
| Quadrant-wise count rates Data is divided into 100 sec bins |
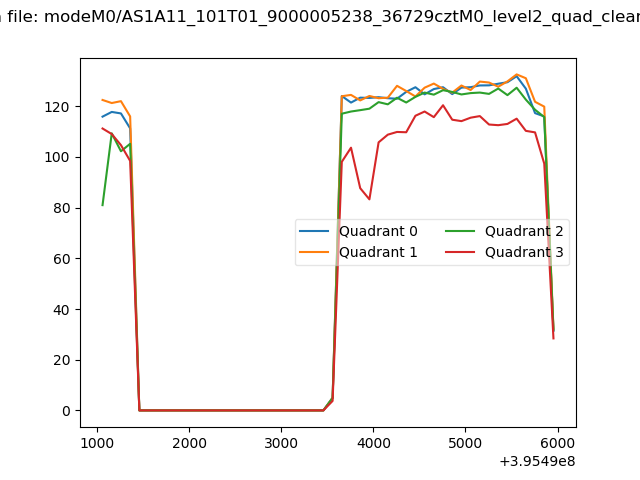 |
|
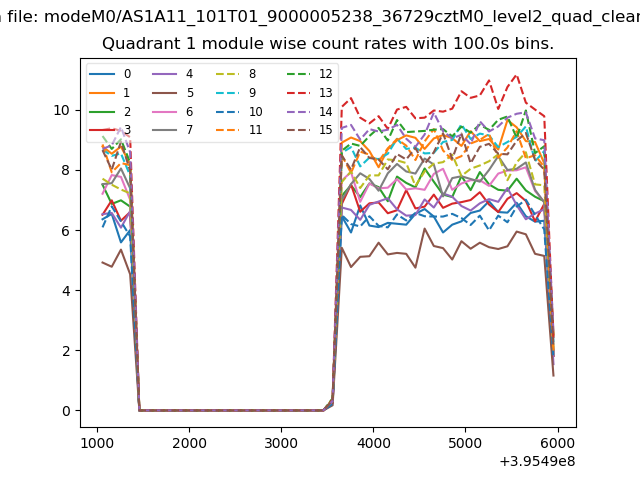
| Module-wise count rates for Quadrant A Data is divided into 100 sec bins |
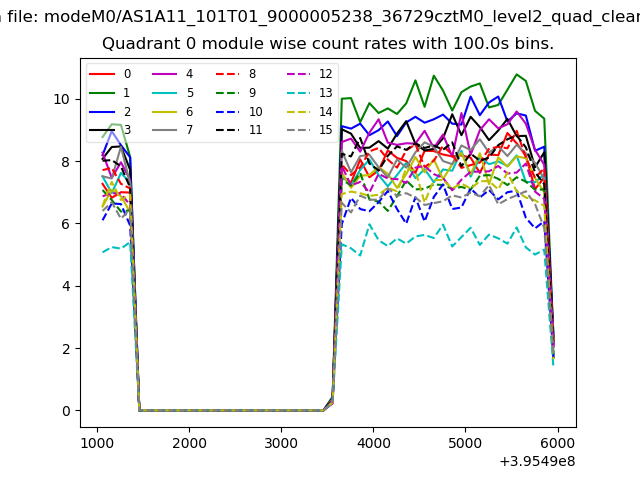 |
 |
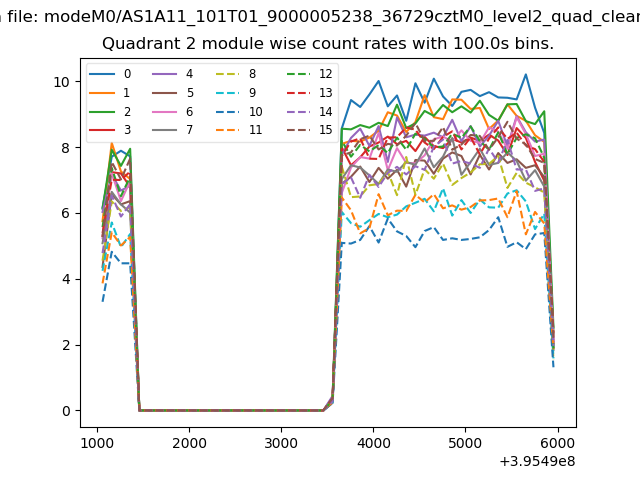
| Module-wise count rates for Quadrant B Data is divided into 100 sec bins |
 |
 |
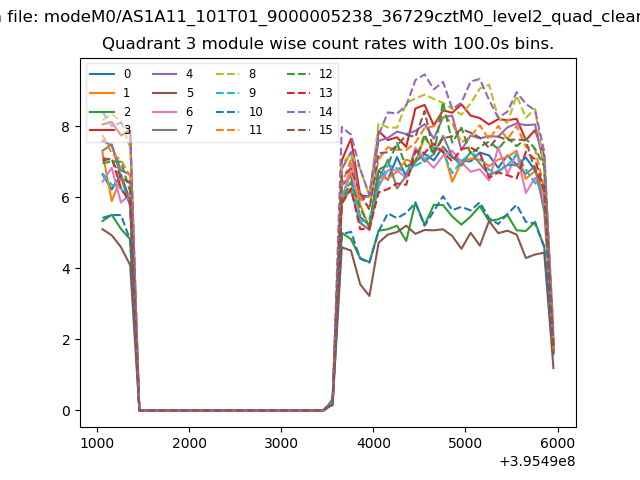
| Module-wise count rates for Quadrant C Data is divided into 100 sec bins |
 |
 |
| Module-wise count rates for Quadrant D Data is divided into 100 sec bins |
 |
 |
| Parameter | Plot |
|---|---|
| CZT HV Monitor | 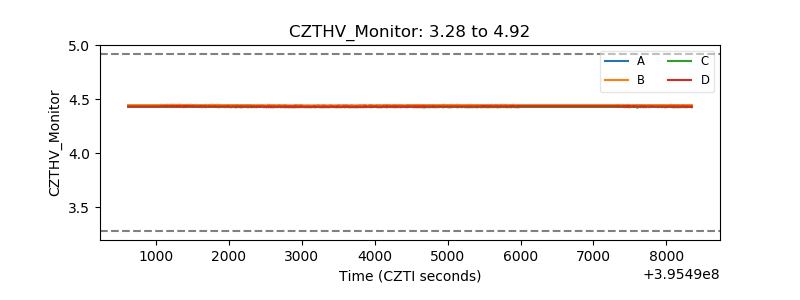 |
| D_VDD | 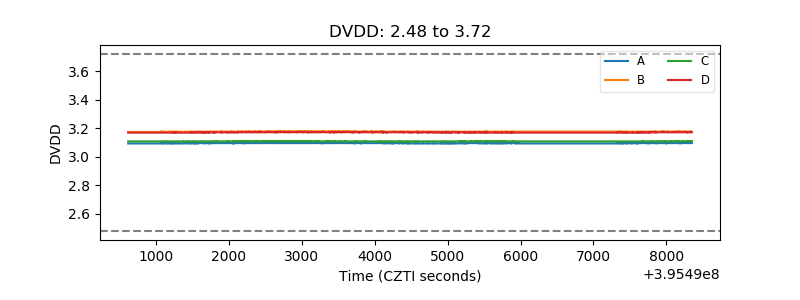 |
| Temperature 1 | 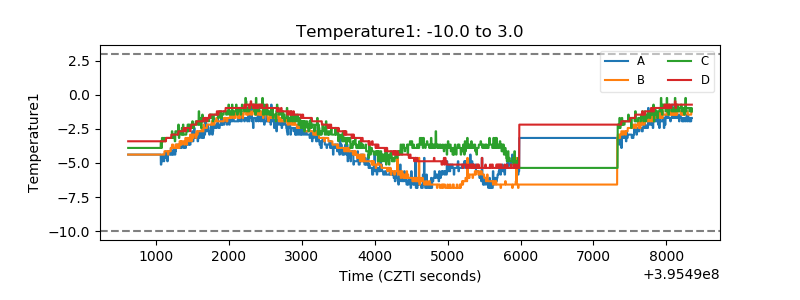 |
| Veto HV Monitor |  |
| Veto LLD | 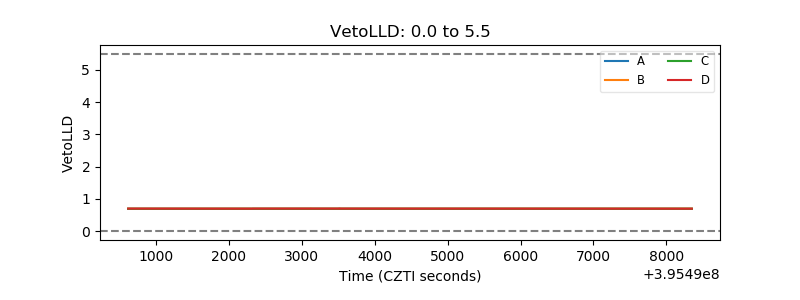 |
| Alpha Counter | 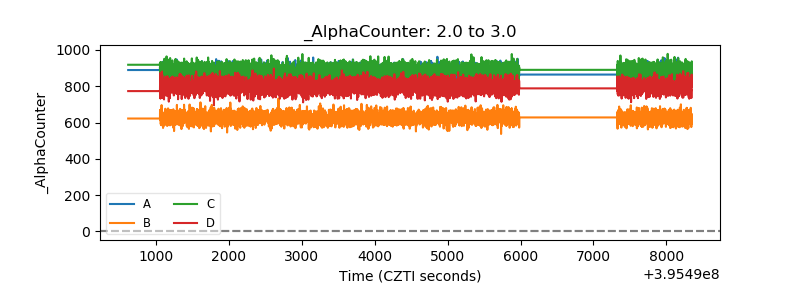 |
| _CPM_Rate | 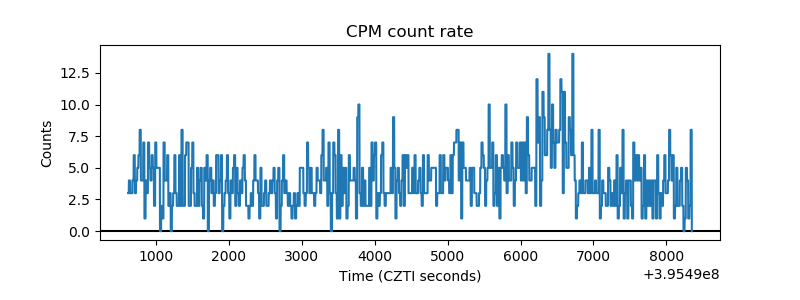 |
| CZT Counter | 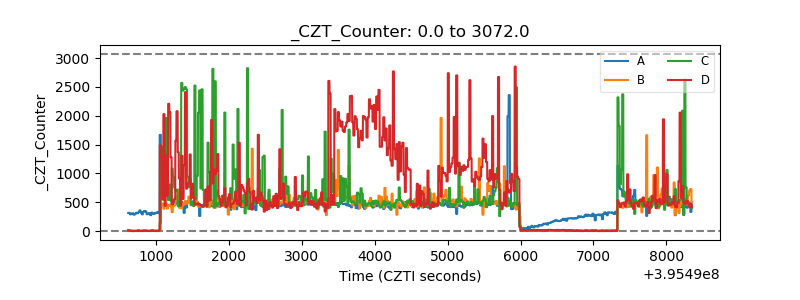 |
| +2.5 Volts monitor |  |
| +5 Volts monitor | 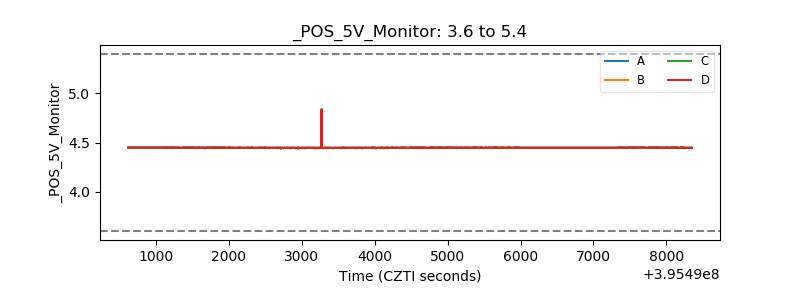 |
| _ROLL_ROT | 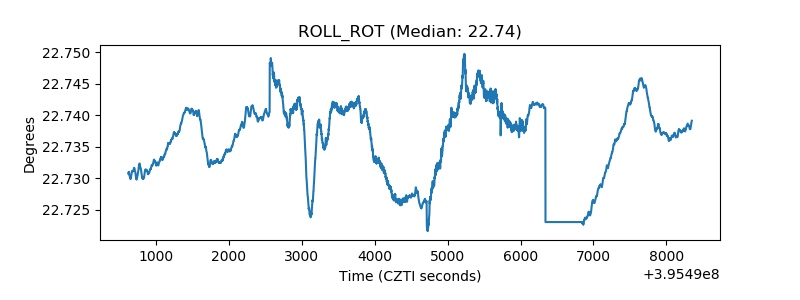 |
| _Roll_DEC |  |
| _Roll_RA | 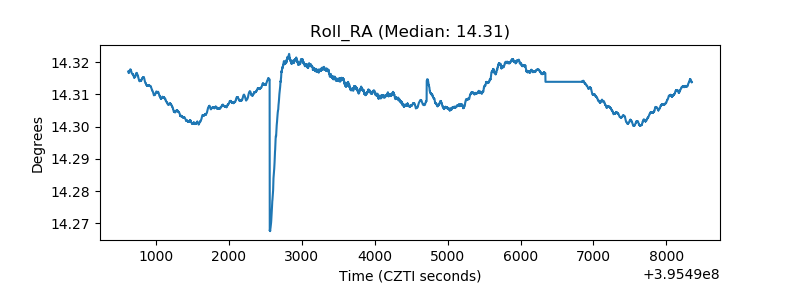 |
| Veto Counter | 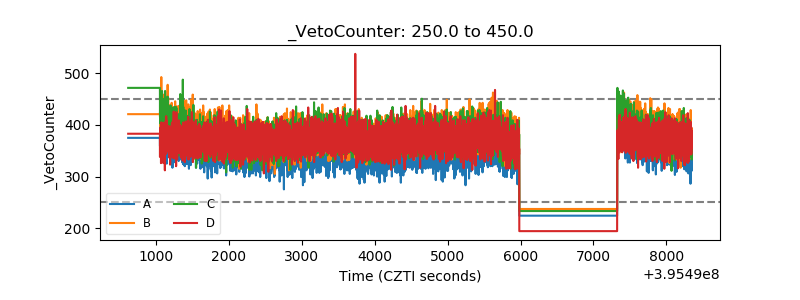 |