| Param | Original file | Final file |
|---|---|---|
| Filename | modeM0/AS1A11_101T01_9000005238_36730cztM0_level2.evt | modeM0/AS1A11_101T01_9000005238_36730cztM0_level2_quad_clean.evt |
| Size (bytes) | 449,441,280 | 58,383,360 |
| Size | 428.6 MB | 55.7 MB |
| Events in quadrant A | 2,965,940 | 345,004 |
| Events in quadrant B | 3,226,800 | 346,432 |
| Events in quadrant C | 3,569,418 | 336,335 |
| Events in quadrant D | 3,443,875 | 322,987 |
| Mode M0 | |||
|---|---|---|---|
| Quadrant | BADHDUFLAG | Total packets | Discarded packets |
| A | 0 | 12549 | 3 |
| B | 0 | 13355 | 2 |
| C | 0 | 14154 | 2 |
| D | 0 | 14077 | 2 |
| Mode SS | |||
|---|---|---|---|
| Quadrant | BADHDUFLAG | Total packets | Discarded packets |
| A | 0 | 120 | 0 |
| B | 0 | 120 | 0 |
| C | 0 | 120 | 0 |
| D | 0 | 120 | 0 |
| Mode M9 | |||
|---|---|---|---|
| Quadrant | BADHDUFLAG | Total packets | Discarded packets |
| A | 0 | 17 | 0 |
| B | 0 | 17 | 0 |
| C | 0 | 17 | 0 |
| D | 0 | 18 | 0 |
| Quadrant | Total seconds | Saturated seconds | Saturation percentage |
|---|---|---|---|
| A | 5970 | 17 | 0.284757% |
| B | 5970 | 59 | 0.988275% |
| C | 5970 | 176 | 2.948074% |
| D | 5970 | 138 | 2.311558% |
Noise dominated data is calculated using 1-second bins in cleaned event files. If a bin has >2000 counts, and if more than 50% of those come from <1% of pixels, then it is considered to be noise-dominated and hence unusable.
| Quadrant | # 1 sec bins | Bins with >0 counts | Bins with >2000 counts | High rate bins dominated by noise | Noise dominated (total time) | Noise dominated (detector-on time) | Marked lightcurve |
|---|---|---|---|---|---|---|---|
| A | 7282 | 5971 | 8 | 8 | 0.11% | 0.13% | 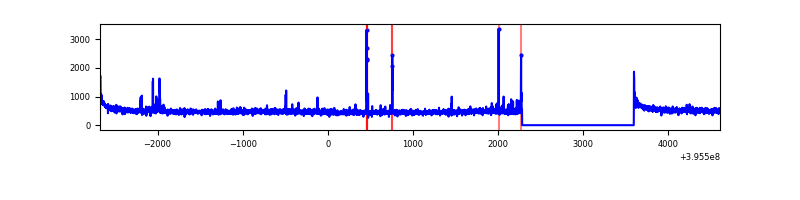 |
| B | 7282 | 5970 | 39 | 39 | 0.54% | 0.65% | 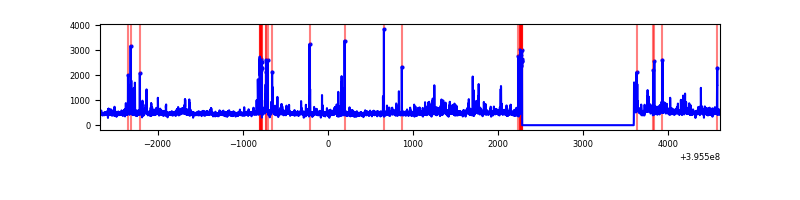 |
| C | 7282 | 5971 | 142 | 142 | 1.95% | 2.38% | 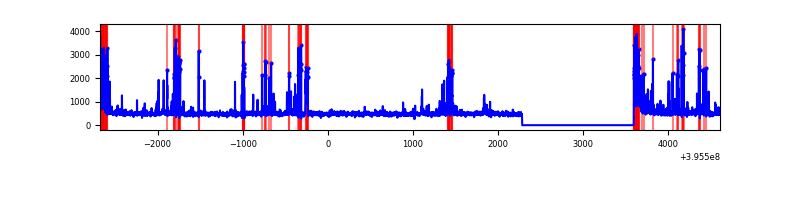 |
| D | 7282 | 5971 | 121 | 121 | 1.66% | 2.03% | 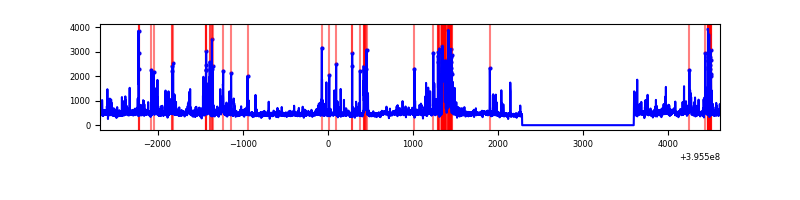 |
Top three noisy pixels from each quadrant. If the there are fewer than three noisy pixels in the level2.evt file, extra rows are filled as -1
| Pixel properties | Quadrant properties | ||||||
|---|---|---|---|---|---|---|---|
| Quadrant | DetID | PixID | Counts | Sigma | Mean | Median | Sigma |
| A | 10 | 83 | 240187 | 1734.03 | 679 | 665 | 138.1 |
| A | 9 | 143 | 44204 | 315.2 | 679 | 665 | 138.1 |
| A | 7 | 3 | 38815 | 276.19 | 679 | 665 | 138.1 |
| B | 0 | 213 | 128892 | 983.32 | 674 | 655 | 130.4 |
| B | 5 | 255 | 112239 | 855.62 | 674 | 655 | 130.4 |
| B | 0 | 189 | 108830 | 829.48 | 674 | 655 | 130.4 |
| C | 14 | 254 | 416469 | 2726.73 | 648 | 653 | 152.5 |
| C | 0 | 10 | 328829 | 2152.03 | 648 | 653 | 152.5 |
| C | 15 | 214 | 254280 | 1663.17 | 648 | 653 | 152.5 |
| D | 13 | 171 | 372281 | 2289.58 | 652 | 632 | 162.3 |
| D | 7 | 223 | 128803 | 789.61 | 652 | 632 | 162.3 |
| D | 2 | 250 | 115684 | 708.79 | 652 | 632 | 162.3 |
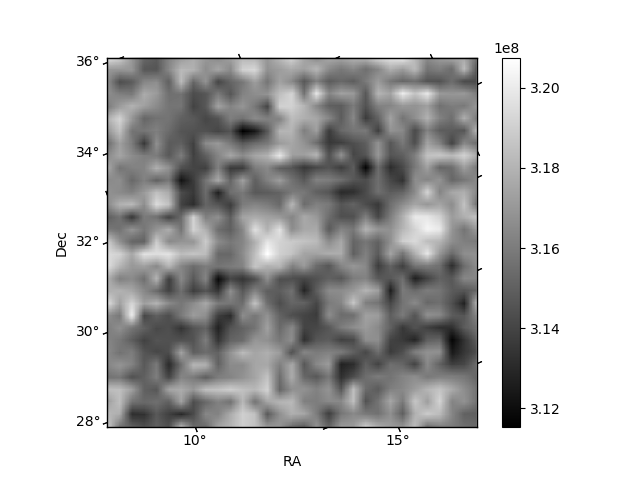
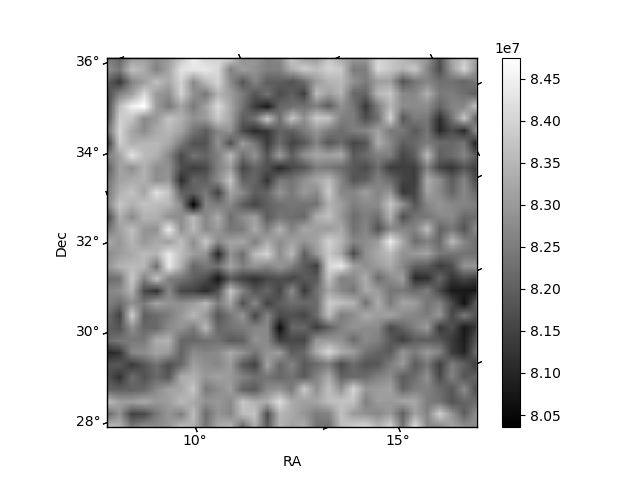
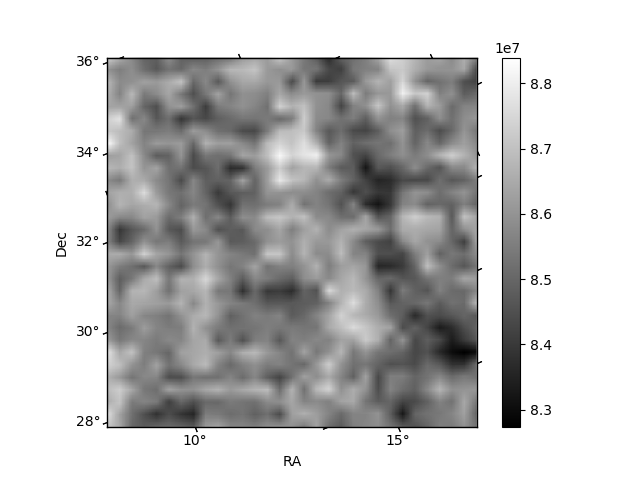
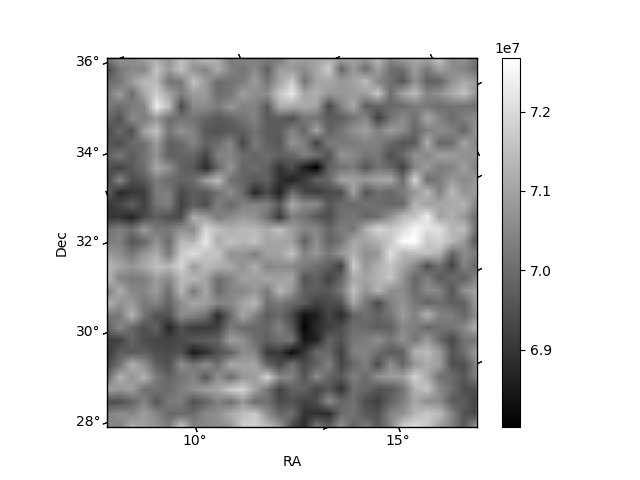
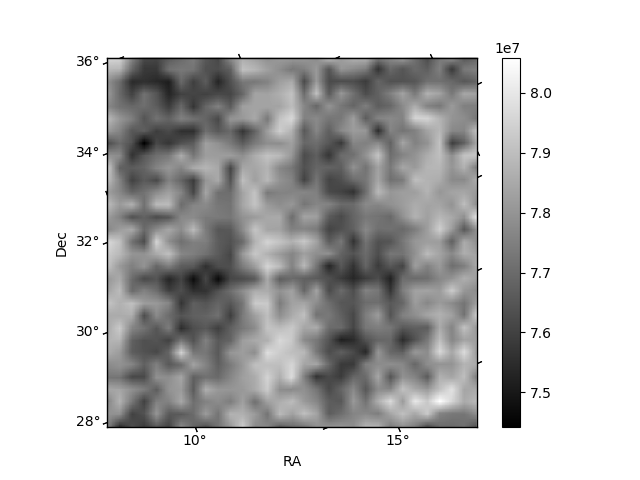
Histogram calculated using DETX and DETY for each event in the final _common_clean file
| Quadrant A | 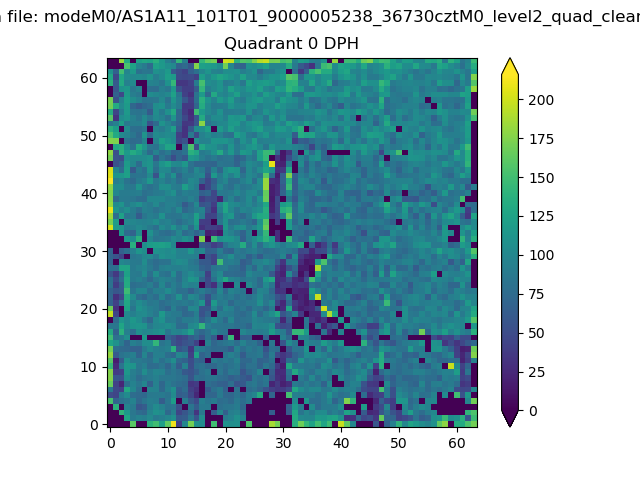 |
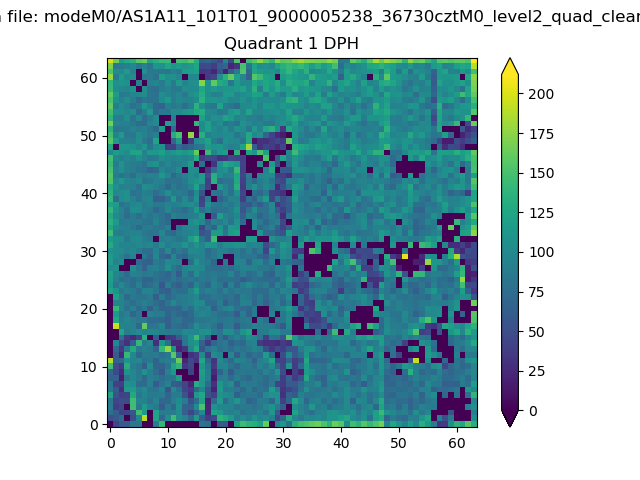 |
Quadrant B |
|---|---|---|---|
| Quadrant D | 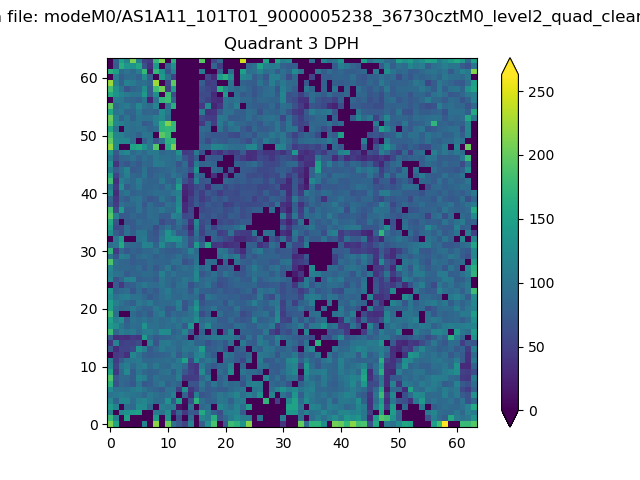 |
 |
Quadrant C |
| Plot type | Count rate plots | Images |
|---|---|---|
| Comparison with Poisson distribution Blue bars denote a histogram of data divided into 1 sec bins. Red curve is a Poisson curve with rate = median count rate of data. |
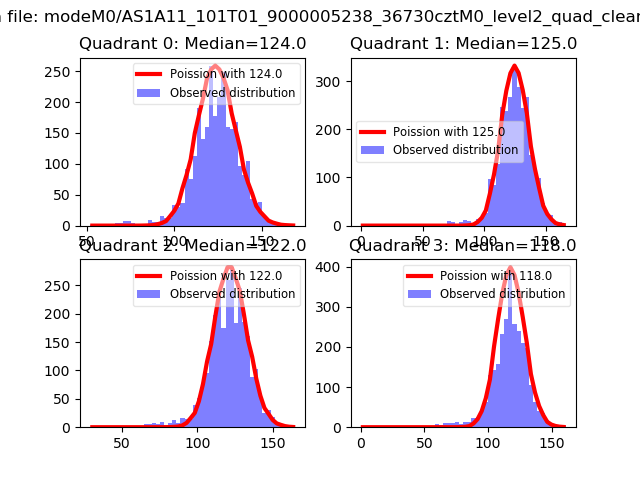 |
 |
| Quadrant-wise count rates Data is divided into 100 sec bins |
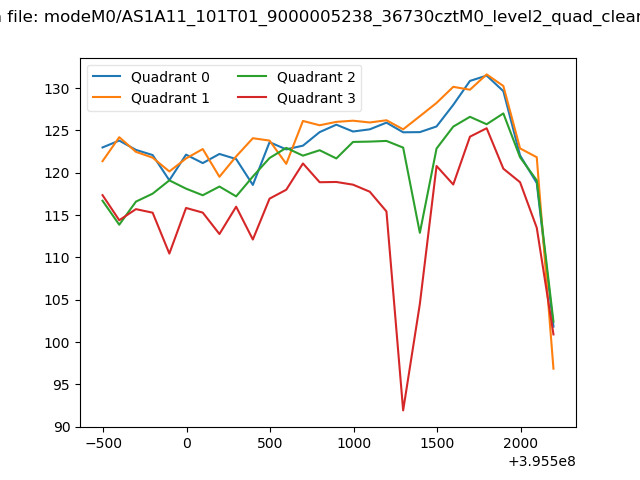 |
|
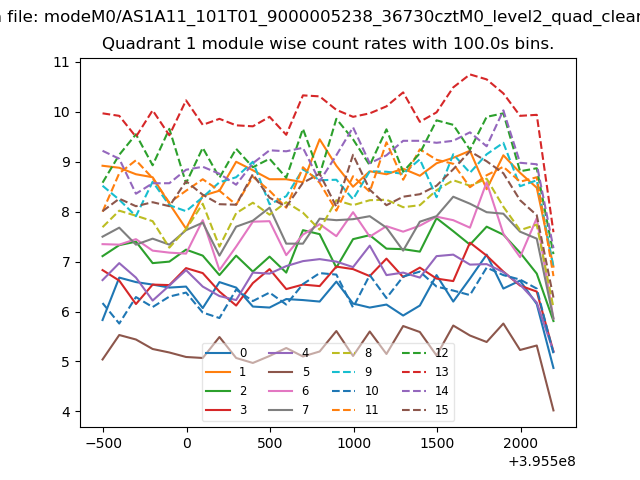
| Module-wise count rates for Quadrant A Data is divided into 100 sec bins |
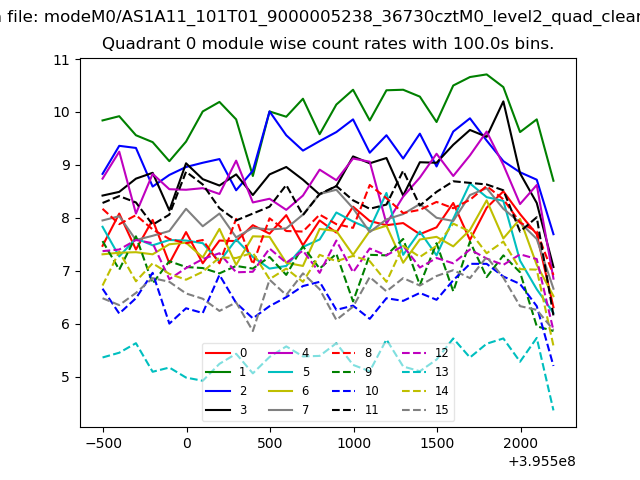 |
 |
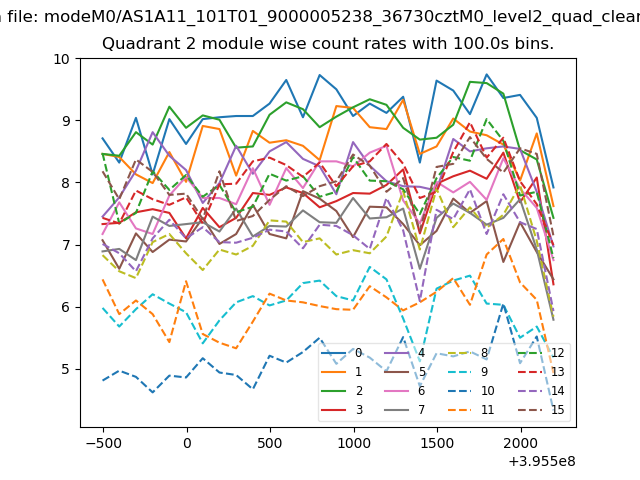
| Module-wise count rates for Quadrant B Data is divided into 100 sec bins |
 |
 |
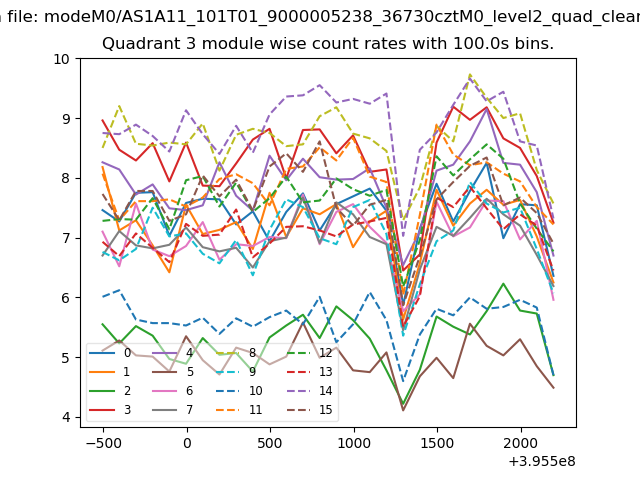
| Module-wise count rates for Quadrant C Data is divided into 100 sec bins |
 |
 |
| Module-wise count rates for Quadrant D Data is divided into 100 sec bins |
 |
 |
| Parameter | Plot |
|---|---|
| CZT HV Monitor | 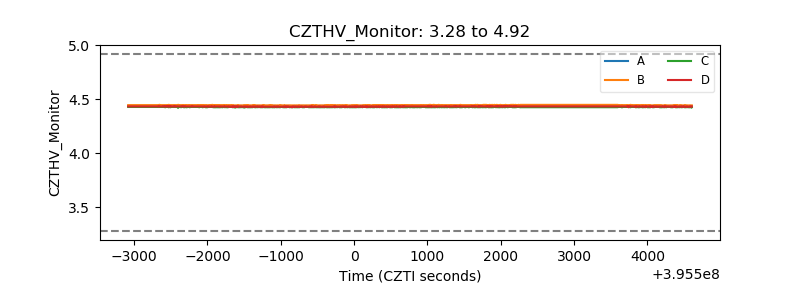 |
| D_VDD | 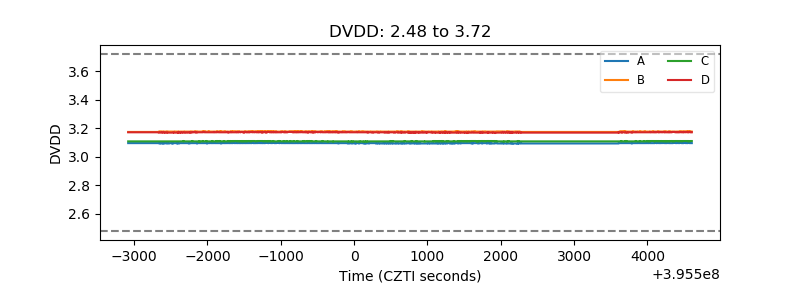 |
| Temperature 1 | 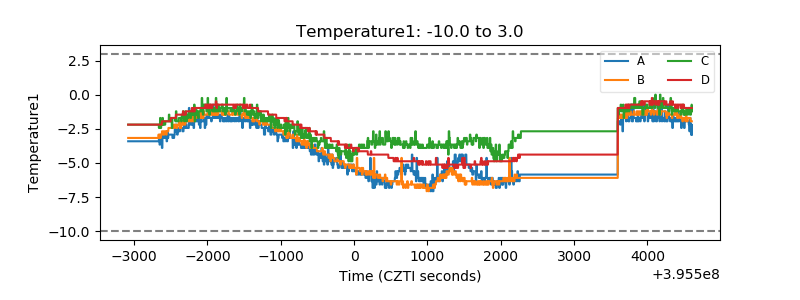 |
| Veto HV Monitor | 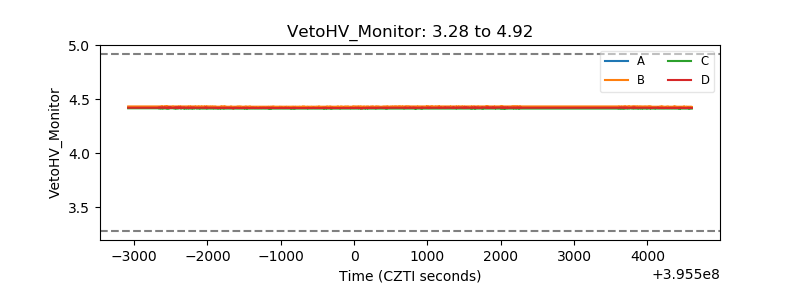 |
| Veto LLD | 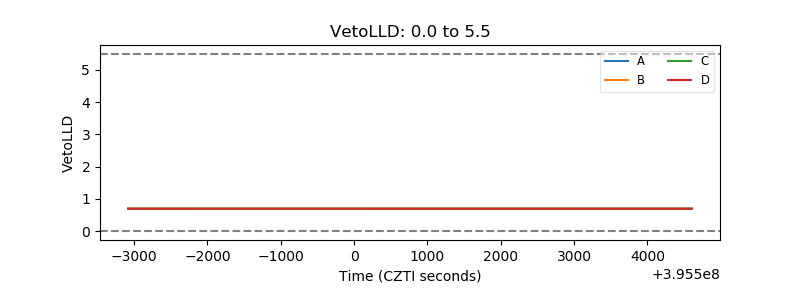 |
| Alpha Counter | 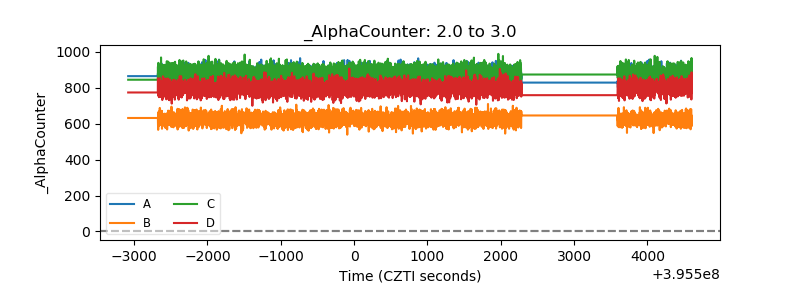 |
| _CPM_Rate | 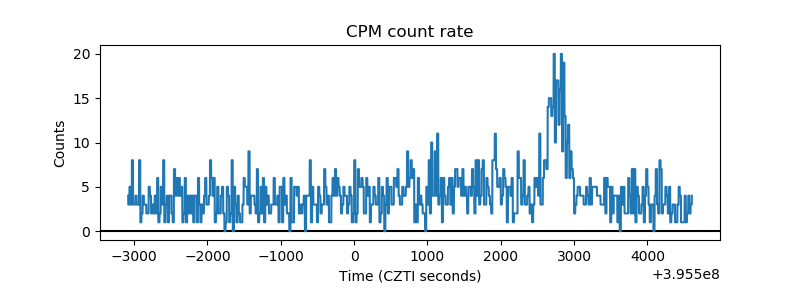 |
| CZT Counter | 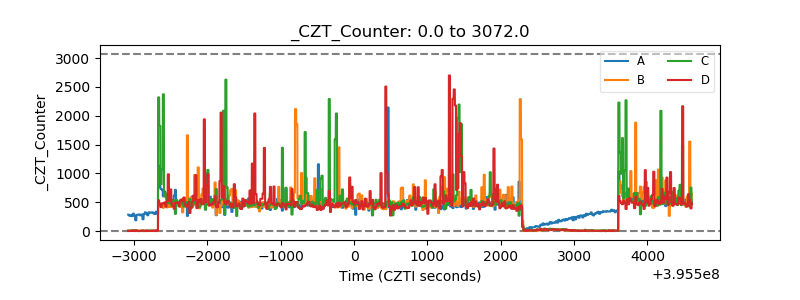 |
| +2.5 Volts monitor | 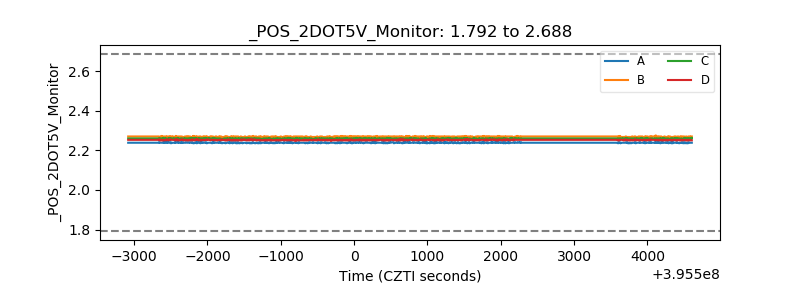 |
| +5 Volts monitor | 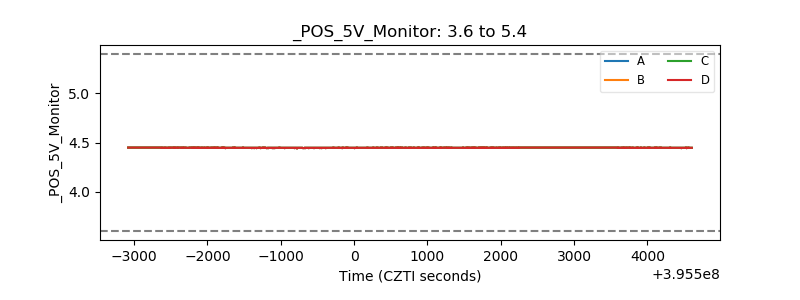 |
| _ROLL_ROT | 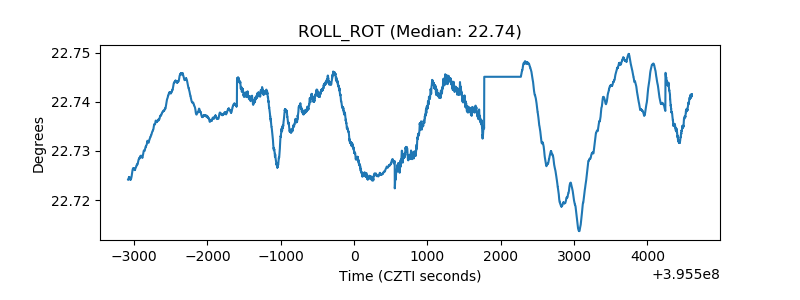 |
| _Roll_DEC |  |
| _Roll_RA | 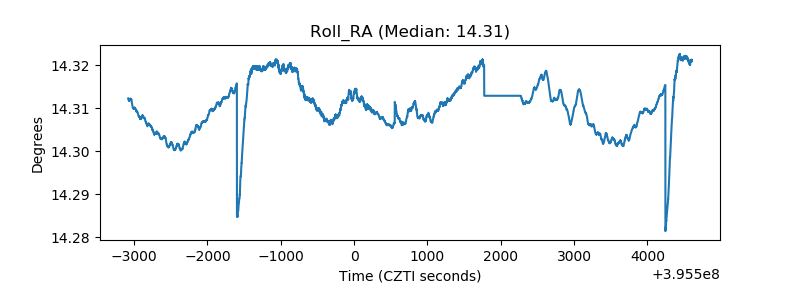 |
| Veto Counter | 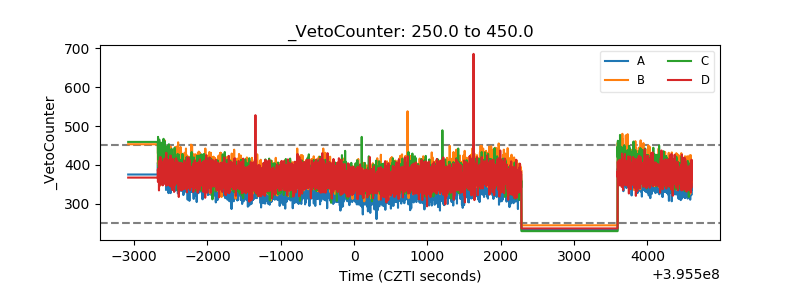 |