| Param | Original file | Final file |
|---|---|---|
| Filename | modeM0/AS1A11_101T01_9000005238_36732cztM0_level2.evt | modeM0/AS1A11_101T01_9000005238_36732cztM0_level2_quad_clean.evt |
| Size (bytes) | 888,935,040 | 132,048,000 |
| Size | 847.8 MB | 125.9 MB |
| Events in quadrant A | 5,220,031 | 837,321 |
| Events in quadrant B | 5,708,007 | 841,651 |
| Events in quadrant C | 8,610,487 | 789,744 |
| Events in quadrant D | 6,650,673 | 779,857 |
| Mode M0 | |||
|---|---|---|---|
| Quadrant | BADHDUFLAG | Total packets | Discarded packets |
| A | 0 | 22521 | 4 |
| B | 0 | 23780 | 3 |
| C | 0 | 32498 | 3 |
| D | 0 | 26972 | 3 |
| Mode SS | |||
|---|---|---|---|
| Quadrant | BADHDUFLAG | Total packets | Discarded packets |
| A | 0 | 222 | 0 |
| B | 0 | 222 | 0 |
| C | 0 | 222 | 0 |
| D | 0 | 222 | 0 |
| Mode M9 | |||
|---|---|---|---|
| Quadrant | BADHDUFLAG | Total packets | Discarded packets |
| A | 0 | 41 | 0 |
| B | 0 | 41 | 0 |
| C | 0 | 41 | 0 |
| D | 0 | 41 | 0 |
| Quadrant | Total seconds | Saturated seconds | Saturation percentage |
|---|---|---|---|
| A | 10838 | 24 | 0.221443% |
| B | 10838 | 44 | 0.405979% |
| C | 10838 | 902 | 8.322569% |
| D | 10838 | 359 | 3.312419% |
Noise dominated data is calculated using 1-second bins in cleaned event files. If a bin has >2000 counts, and if more than 50% of those come from <1% of pixels, then it is considered to be noise-dominated and hence unusable.
| Quadrant | # 1 sec bins | Bins with >0 counts | Bins with >2000 counts | High rate bins dominated by noise | Noise dominated (total time) | Noise dominated (detector-on time) | Marked lightcurve |
|---|---|---|---|---|---|---|---|
| A | 14924 | 10841 | 2 | 2 | 0.01% | 0.02% | 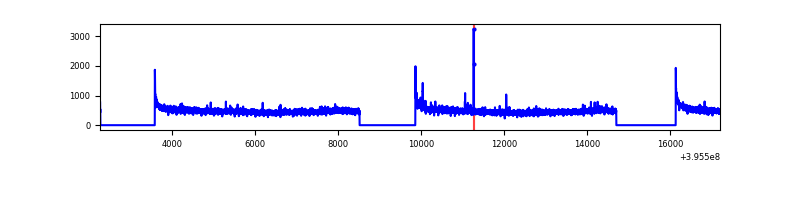 |
| B | 14924 | 10840 | 21 | 21 | 0.14% | 0.19% | 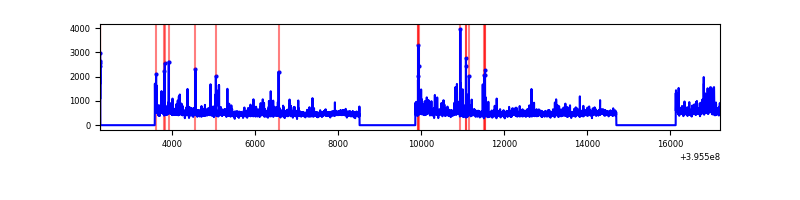 |
| C | 14924 | 10841 | 662 | 662 | 4.44% | 6.11% | 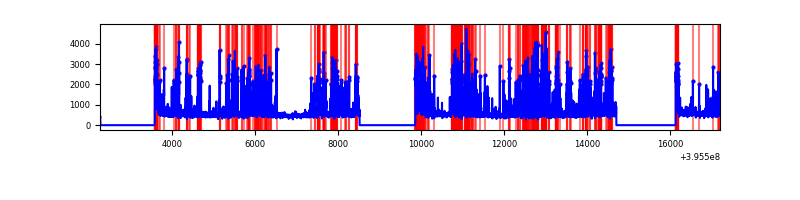 |
| D | 14924 | 10841 | 308 | 308 | 2.06% | 2.84% | 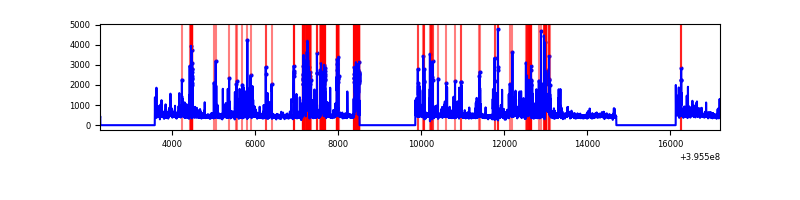 |
Top three noisy pixels from each quadrant. If the there are fewer than three noisy pixels in the level2.evt file, extra rows are filled as -1
| Pixel properties | Quadrant properties | ||||||
|---|---|---|---|---|---|---|---|
| Quadrant | DetID | PixID | Counts | Sigma | Mean | Median | Sigma |
| A | 10 | 83 | 407503 | 1637.45 | 1228 | 1204 | 248.1 |
| A | 13 | 6 | 31583 | 122.43 | 1228 | 1204 | 248.1 |
| A | 13 | 254 | 19274 | 72.82 | 1228 | 1204 | 248.1 |
| B | 0 | 213 | 214737 | 903.05 | 1223 | 1193 | 236.5 |
| B | 0 | 189 | 177385 | 745.1 | 1223 | 1193 | 236.5 |
| B | 5 | 255 | 127465 | 533.99 | 1223 | 1193 | 236.5 |
| C | 14 | 254 | 3068877 | 11408.7 | 1152 | 1159 | 268.9 |
| C | 0 | 10 | 524342 | 1945.69 | 1152 | 1159 | 268.9 |
| C | 15 | 214 | 440721 | 1634.71 | 1152 | 1159 | 268.9 |
| D | 13 | 171 | 926400 | 3188.83 | 1180 | 1148 | 290.2 |
| D | 12 | 17 | 368912 | 1267.48 | 1180 | 1148 | 290.2 |
| D | 13 | 249 | 261949 | 898.84 | 1180 | 1148 | 290.2 |
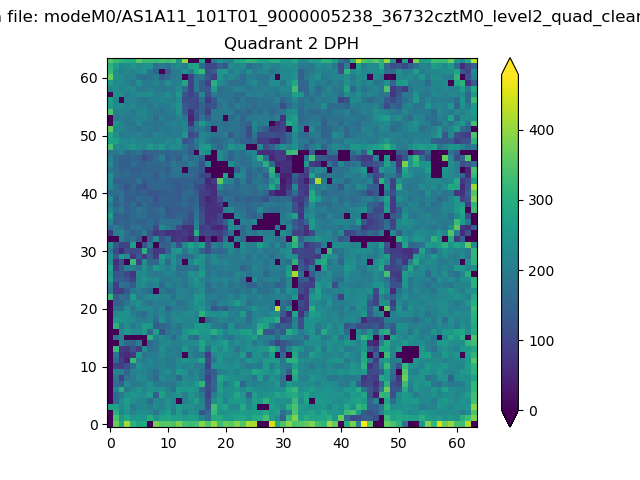
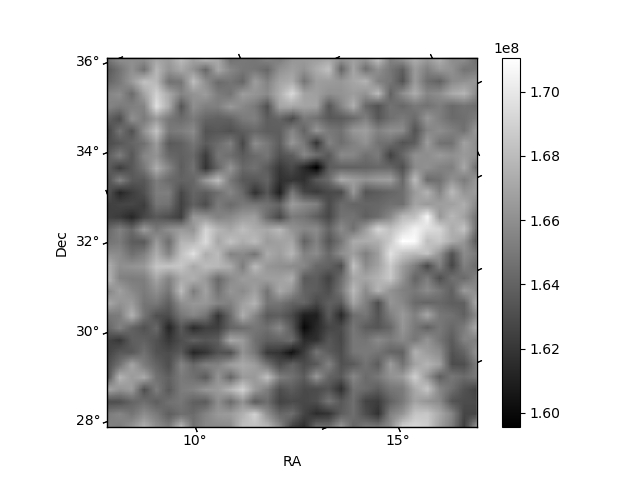
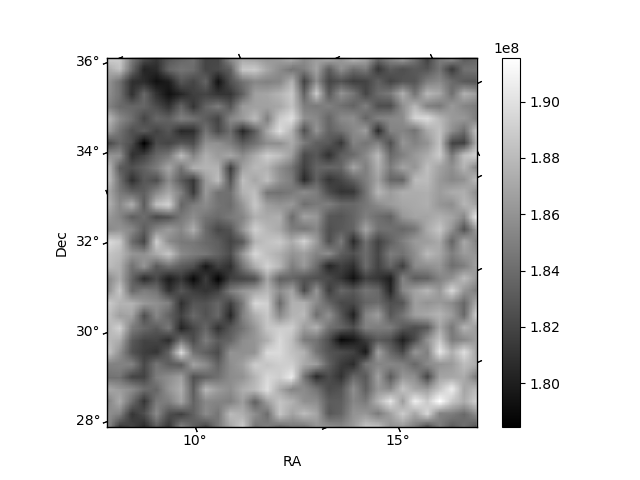
Histogram calculated using DETX and DETY for each event in the final _common_clean file
| Quadrant A | 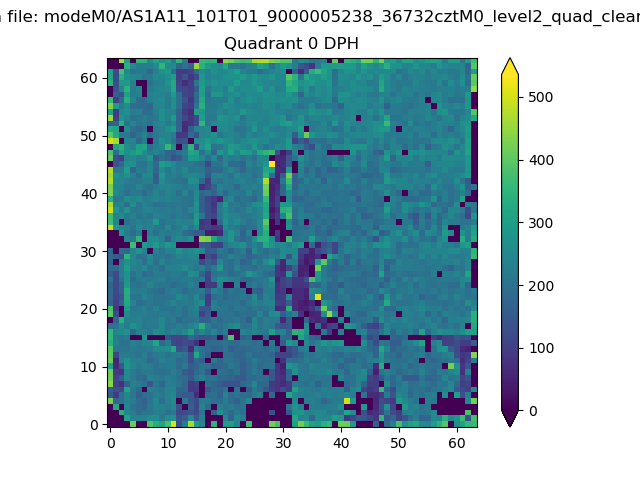 |
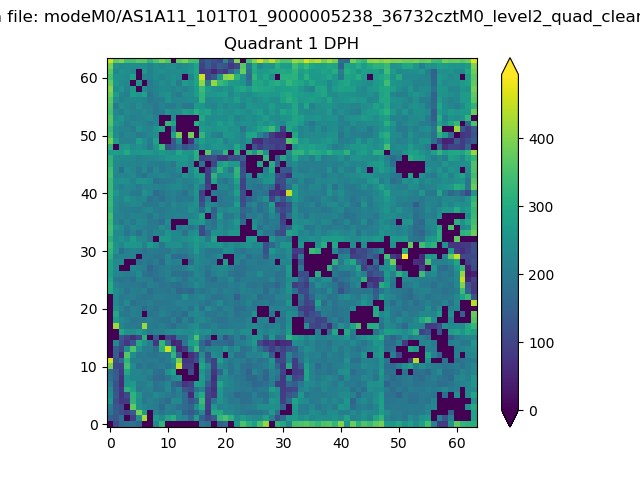 |
Quadrant B |
|---|---|---|---|
| Quadrant D | 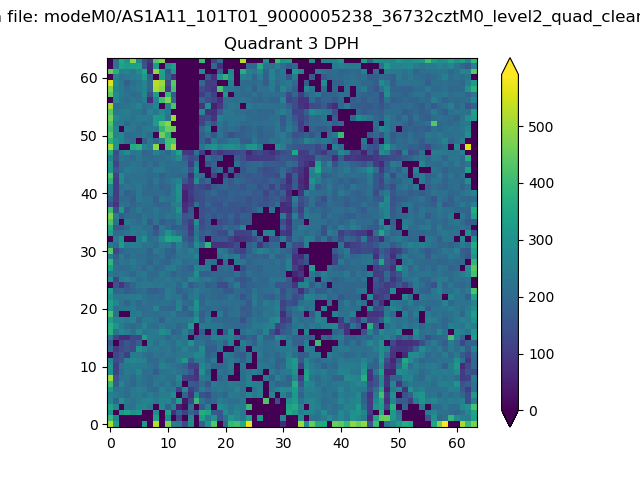 |
 |
Quadrant C |
| Plot type | Count rate plots | Images |
|---|---|---|
| Comparison with Poisson distribution Blue bars denote a histogram of data divided into 1 sec bins. Red curve is a Poisson curve with rate = median count rate of data. |
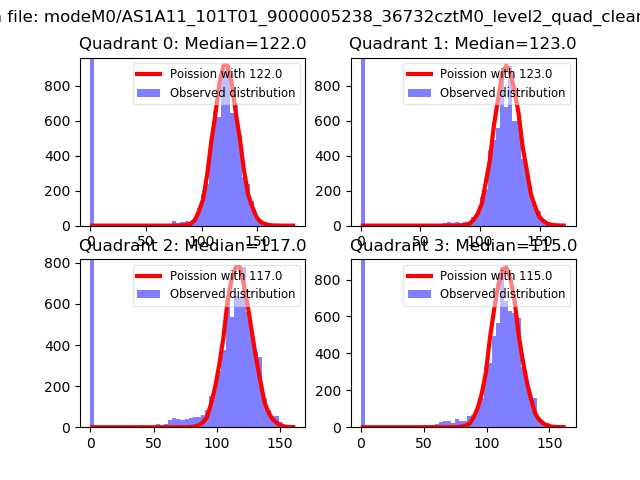 |
 |
| Quadrant-wise count rates Data is divided into 100 sec bins |
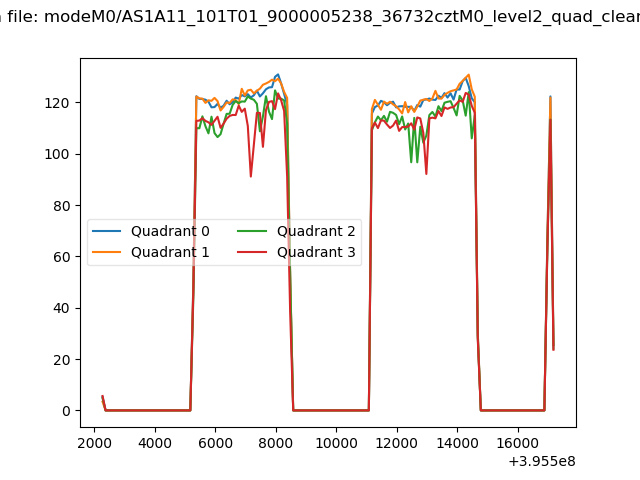 |
|
| Module-wise count rates for Quadrant A Data is divided into 100 sec bins |
 |
 |
| Module-wise count rates for Quadrant B Data is divided into 100 sec bins |
 |
 |
| Module-wise count rates for Quadrant C Data is divided into 100 sec bins |
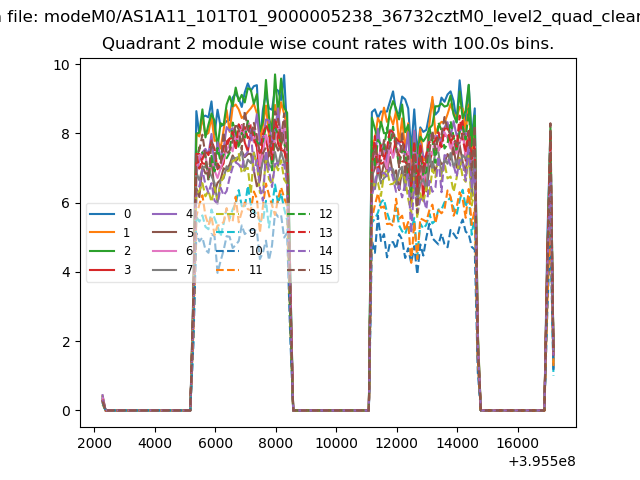 |
 |
| Module-wise count rates for Quadrant D Data is divided into 100 sec bins |
 |
 |
| Parameter | Plot |
|---|---|
| CZT HV Monitor | 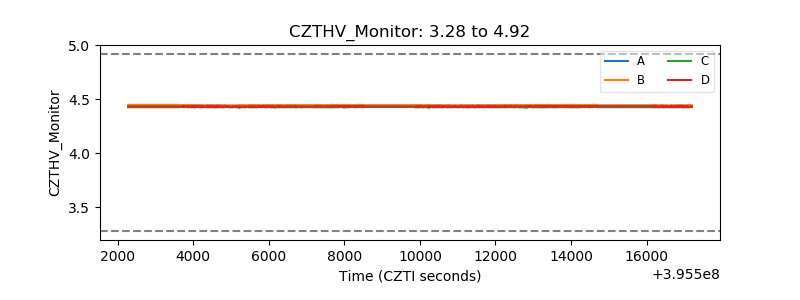 |
| D_VDD | 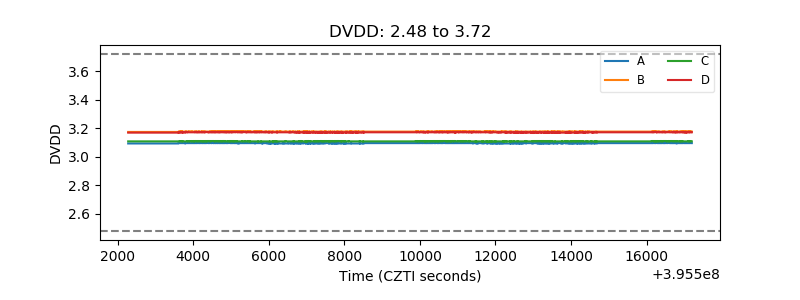 |
| Temperature 1 | 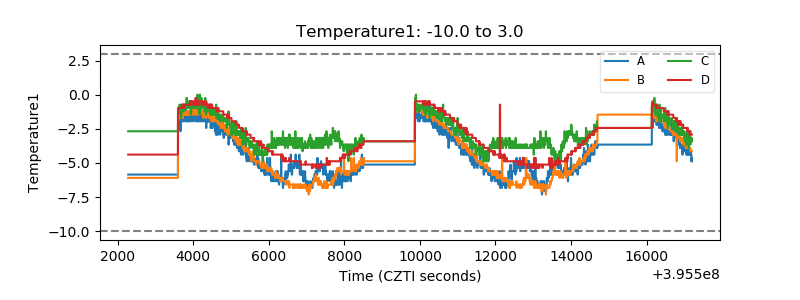 |
| Veto HV Monitor |  |
| Veto LLD | 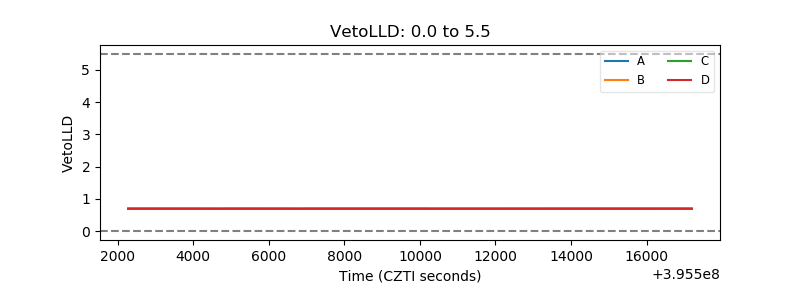 |
| Alpha Counter | 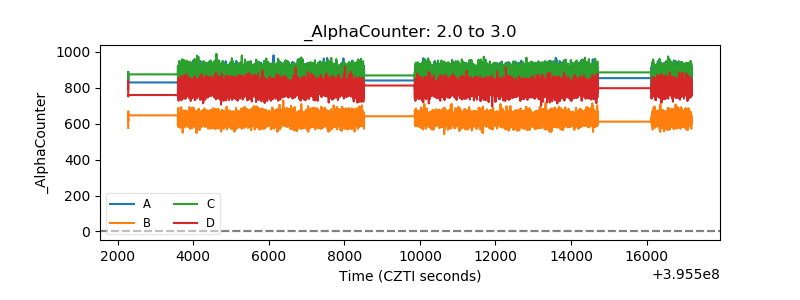 |
| _CPM_Rate | 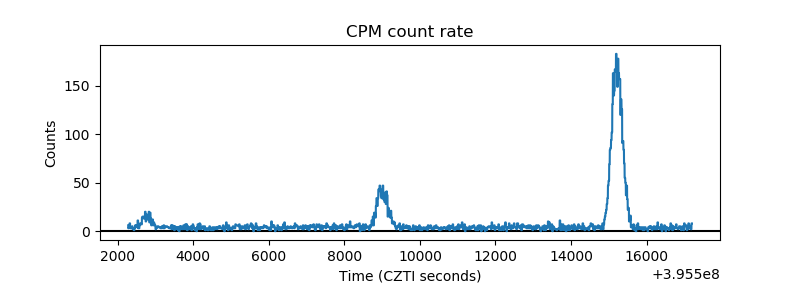 |
| CZT Counter |  |
| +2.5 Volts monitor | 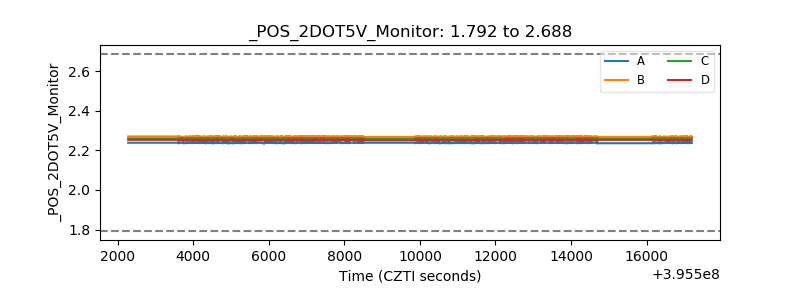 |
| +5 Volts monitor |  |
| _ROLL_ROT | 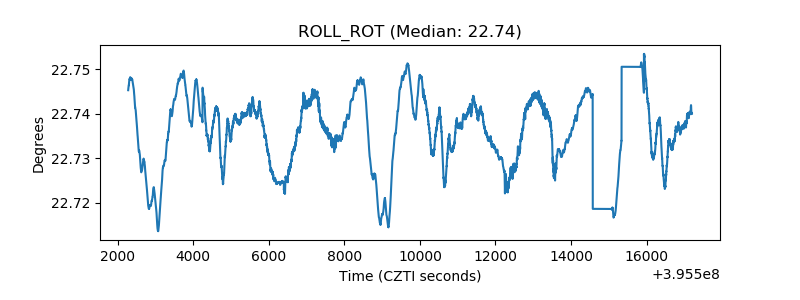 |
| _Roll_DEC | 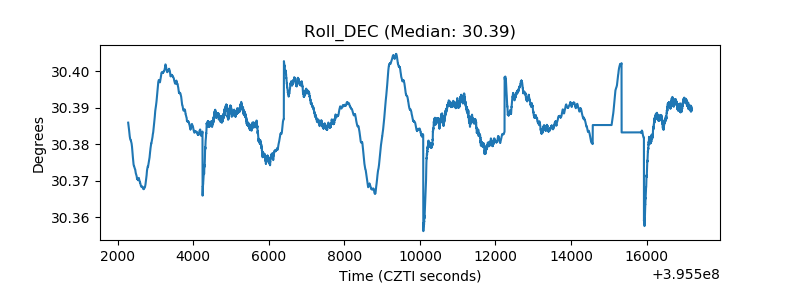 |
| _Roll_RA |  |
| Veto Counter | 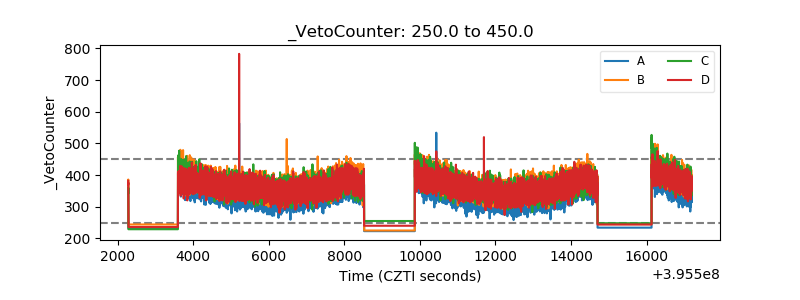 |