| Param | Original file | Final file |
|---|---|---|
| Filename | modeM0/AS1A11_101T01_9000005238_36733cztM0_level2.evt | modeM0/AS1A11_101T01_9000005238_36733cztM0_level2_quad_clean.evt |
| Size (bytes) | 451,051,200 | 75,597,120 |
| Size | 430.2 MB | 72.1 MB |
| Events in quadrant A | 2,717,005 | 487,692 |
| Events in quadrant B | 3,276,803 | 489,548 |
| Events in quadrant C | 3,471,676 | 477,695 |
| Events in quadrant D | 3,814,438 | 442,647 |
| Mode M0 | |||
|---|---|---|---|
| Quadrant | BADHDUFLAG | Total packets | Discarded packets |
| A | 0 | 11777 | 3 |
| B | 0 | 13449 | 2 |
| C | 0 | 13830 | 2 |
| D | 0 | 15117 | 2 |
| Mode SS | |||
|---|---|---|---|
| Quadrant | BADHDUFLAG | Total packets | Discarded packets |
| A | 0 | 114 | 0 |
| B | 0 | 114 | 0 |
| C | 0 | 114 | 0 |
| D | 0 | 114 | 0 |
| Mode M9 | |||
|---|---|---|---|
| Quadrant | BADHDUFLAG | Total packets | Discarded packets |
| A | 0 | 17 | 0 |
| B | 0 | 17 | 0 |
| C | 0 | 17 | 0 |
| D | 0 | 18 | 0 |
| Quadrant | Total seconds | Saturated seconds | Saturation percentage |
|---|---|---|---|
| A | 5594 | 13 | 0.232392% |
| B | 5594 | 139 | 2.484805% |
| C | 5594 | 187 | 3.342867% |
| D | 5594 | 361 | 6.453343% |
Noise dominated data is calculated using 1-second bins in cleaned event files. If a bin has >2000 counts, and if more than 50% of those come from <1% of pixels, then it is considered to be noise-dominated and hence unusable.
| Quadrant | # 1 sec bins | Bins with >0 counts | Bins with >2000 counts | High rate bins dominated by noise | Noise dominated (total time) | Noise dominated (detector-on time) | Marked lightcurve |
|---|---|---|---|---|---|---|---|
| A | 7147 | 5595 | 1 | 1 | 0.01% | 0.02% | 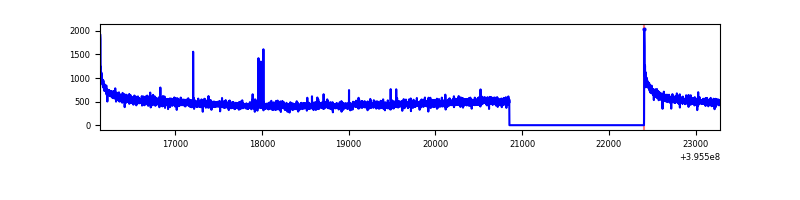 |
| B | 7147 | 5595 | 82 | 82 | 1.15% | 1.47% | 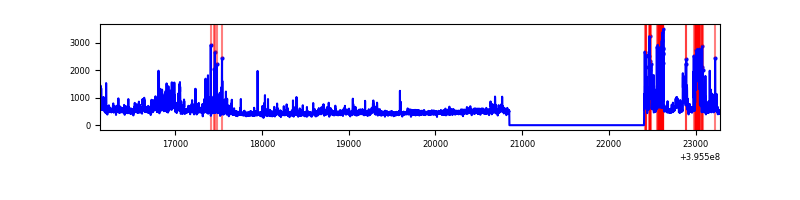 |
| C | 7147 | 5595 | 125 | 125 | 1.75% | 2.23% |  |
| D | 7147 | 5595 | 329 | 329 | 4.60% | 5.88% | 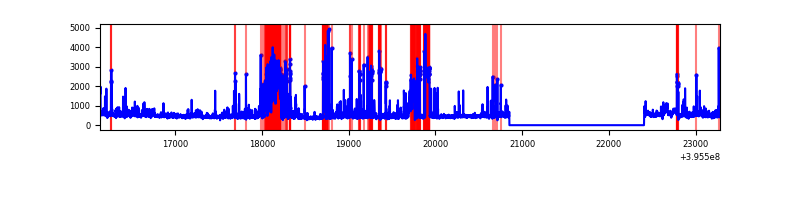 |
Top three noisy pixels from each quadrant. If the there are fewer than three noisy pixels in the level2.evt file, extra rows are filled as -1
| Pixel properties | Quadrant properties | ||||||
|---|---|---|---|---|---|---|---|
| Quadrant | DetID | PixID | Counts | Sigma | Mean | Median | Sigma |
| A | 10 | 83 | 235092 | 1803.63 | 636 | 624 | 130.0 |
| A | 13 | 254 | 10624 | 76.92 | 636 | 624 | 130.0 |
| A | 9 | 143 | 9911 | 71.44 | 636 | 624 | 130.0 |
| B | 5 | 200 | 211151 | 1728.61 | 631 | 614 | 121.8 |
| B | 4 | 171 | 173371 | 1418.42 | 631 | 614 | 121.8 |
| B | 0 | 213 | 80376 | 654.88 | 631 | 614 | 121.8 |
| C | 14 | 254 | 418593 | 2918.49 | 610 | 615 | 143.2 |
| C | 0 | 10 | 353886 | 2466.68 | 610 | 615 | 143.2 |
| C | 15 | 214 | 231616 | 1612.94 | 610 | 615 | 143.2 |
| D | 13 | 249 | 601513 | 4003.35 | 603 | 585 | 150.1 |
| D | 12 | 227 | 515582 | 3430.88 | 603 | 585 | 150.1 |
| D | 13 | 171 | 117640 | 779.81 | 603 | 585 | 150.1 |
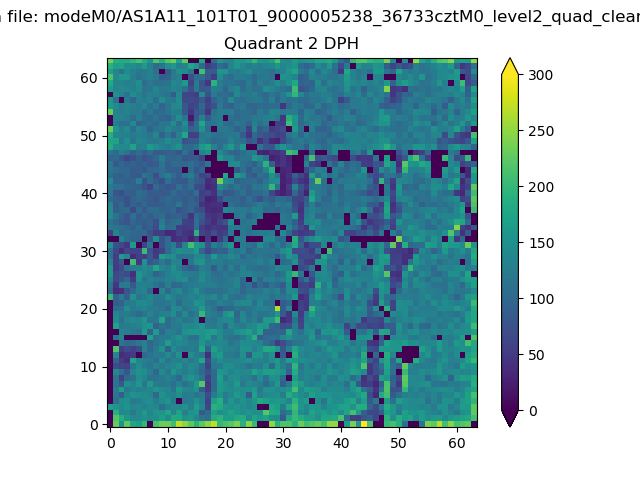
Histogram calculated using DETX and DETY for each event in the final _common_clean file
| Quadrant A | 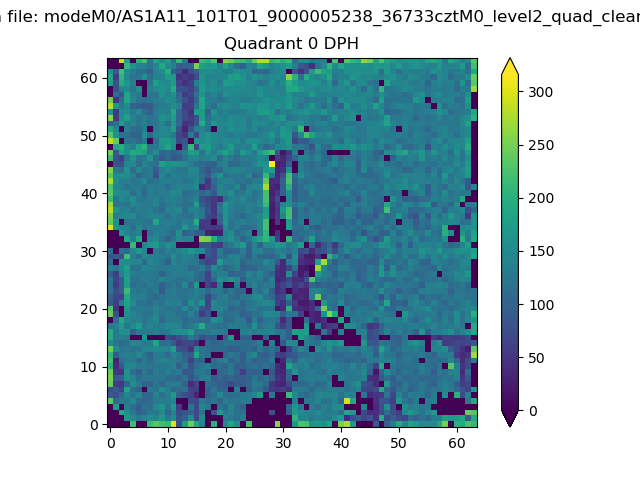 |
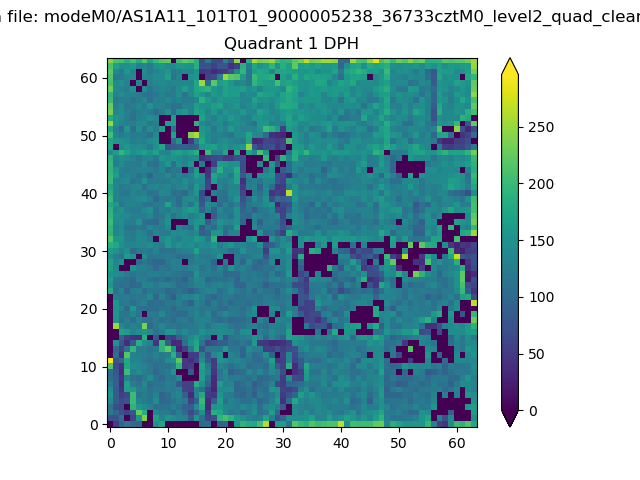 |
Quadrant B |
|---|---|---|---|
| Quadrant D | 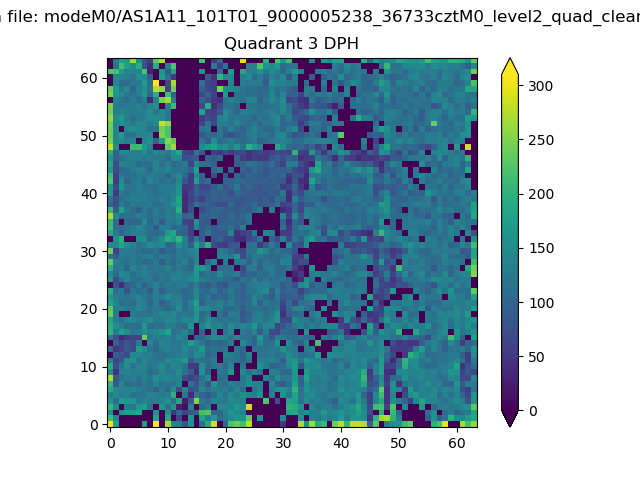 |
 |
Quadrant C |
| Plot type | Count rate plots | Images |
|---|---|---|
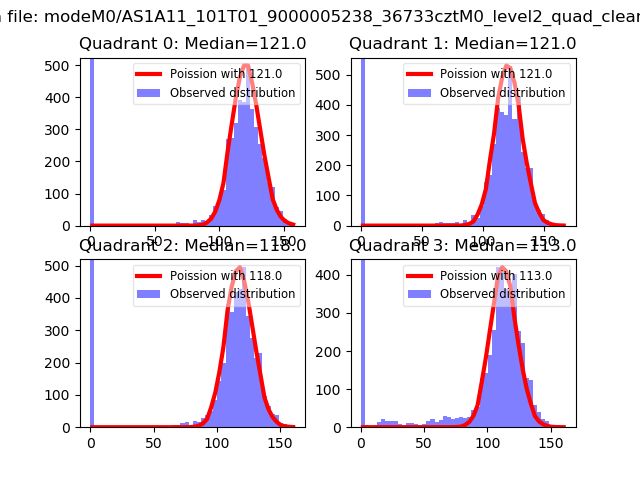
| Comparison with Poisson distribution Blue bars denote a histogram of data divided into 1 sec bins. Red curve is a Poisson curve with rate = median count rate of data. |
 |
 |
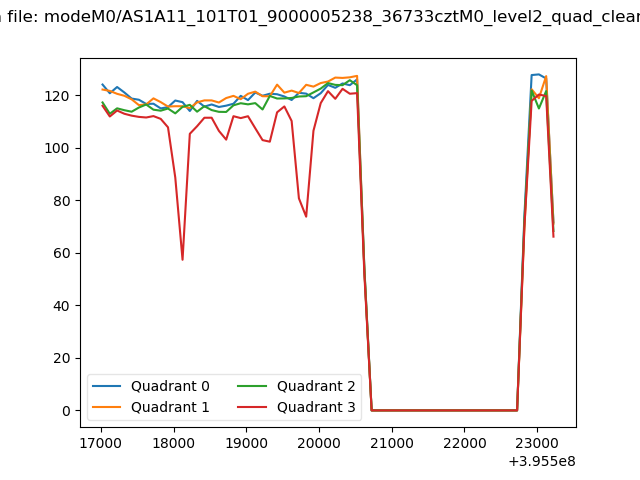
| Quadrant-wise count rates Data is divided into 100 sec bins |
 |
|
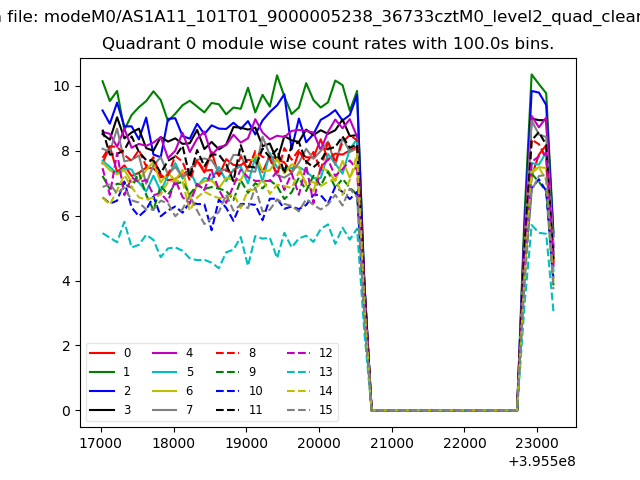
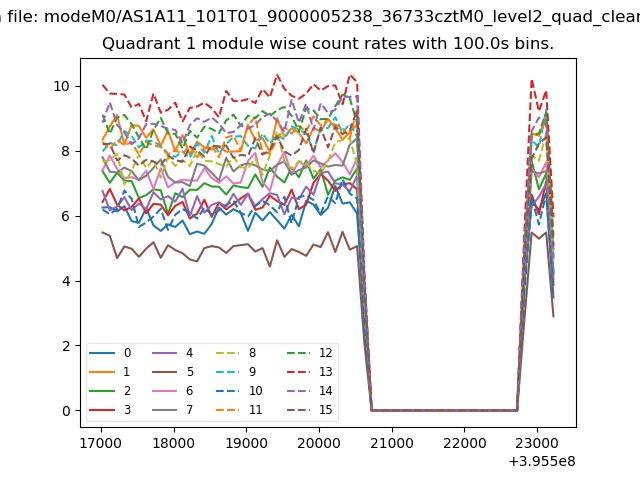
| Module-wise count rates for Quadrant A Data is divided into 100 sec bins |
 |
 |
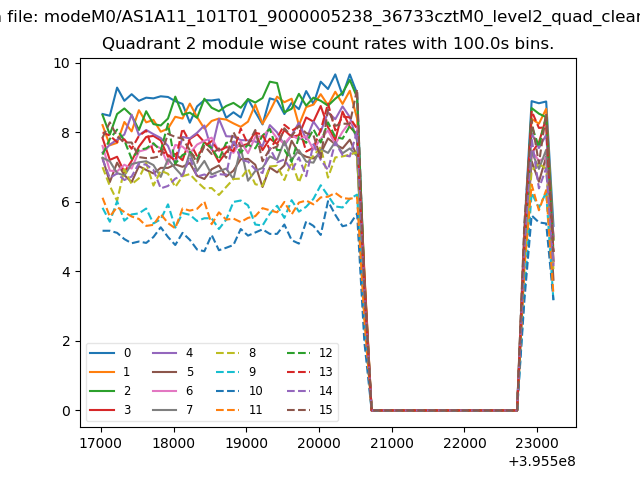
| Module-wise count rates for Quadrant B Data is divided into 100 sec bins |
 |
 |
| Module-wise count rates for Quadrant C Data is divided into 100 sec bins |
 |
 |
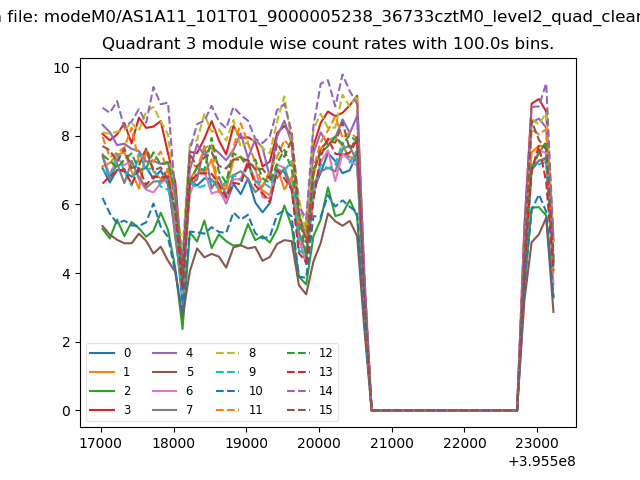
| Module-wise count rates for Quadrant D Data is divided into 100 sec bins |
 |
 |
| Parameter | Plot |
|---|---|
| CZT HV Monitor | 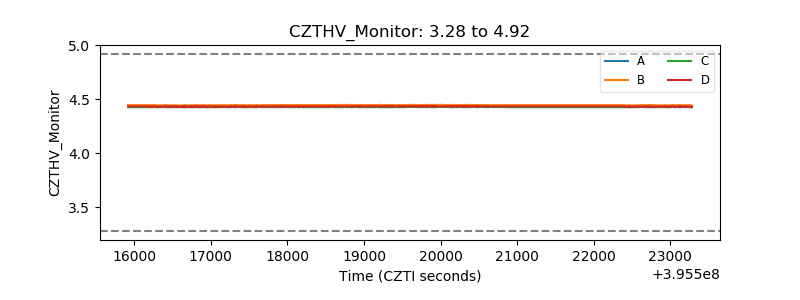 |
| D_VDD |  |
| Temperature 1 | 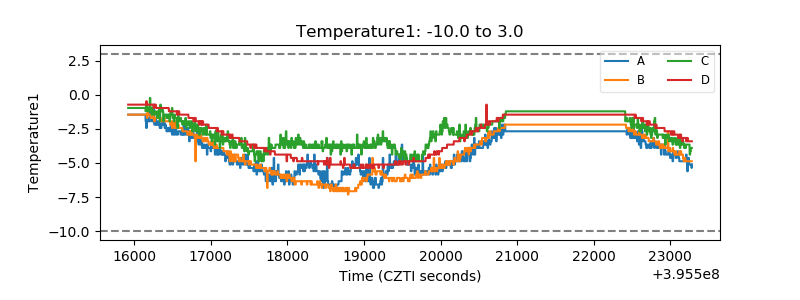 |
| Veto HV Monitor | 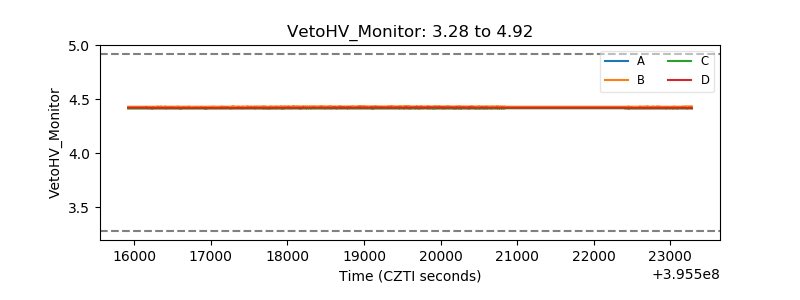 |
| Veto LLD | 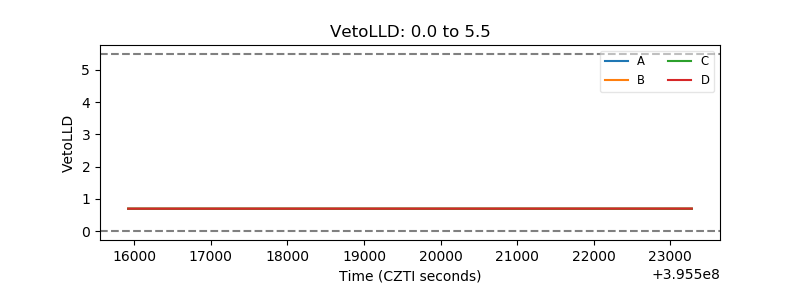 |
| Alpha Counter | 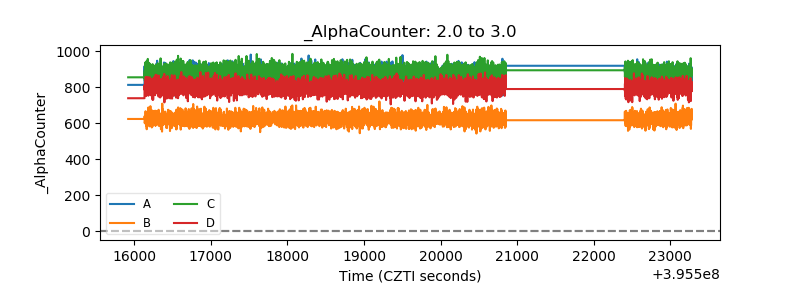 |
| _CPM_Rate | 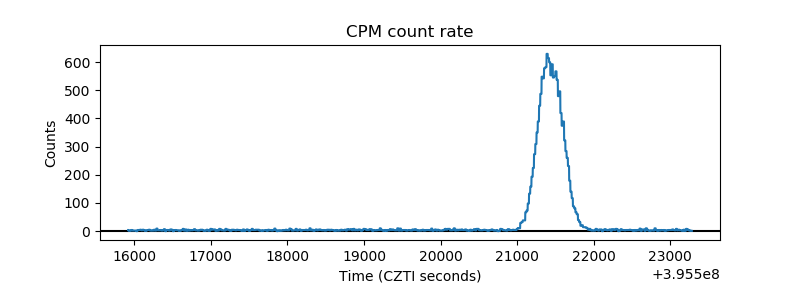 |
| CZT Counter | 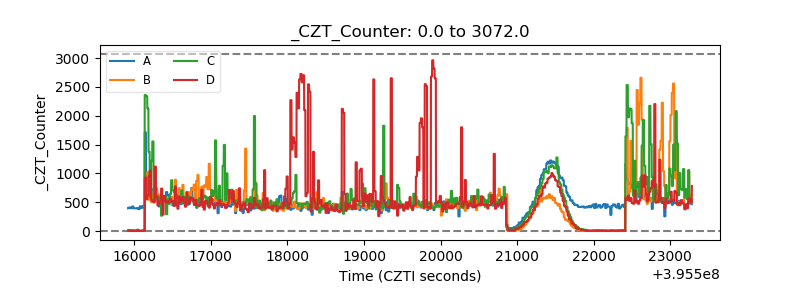 |
| +2.5 Volts monitor |  |
| +5 Volts monitor |  |
| _ROLL_ROT | 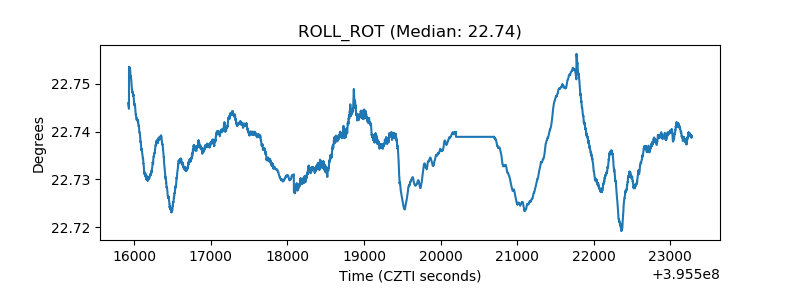 |
| _Roll_DEC | 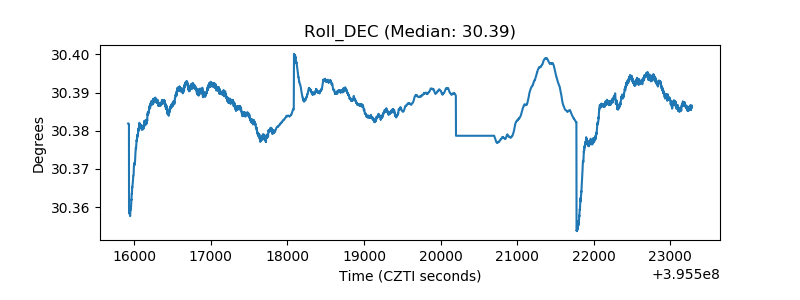 |
| _Roll_RA | 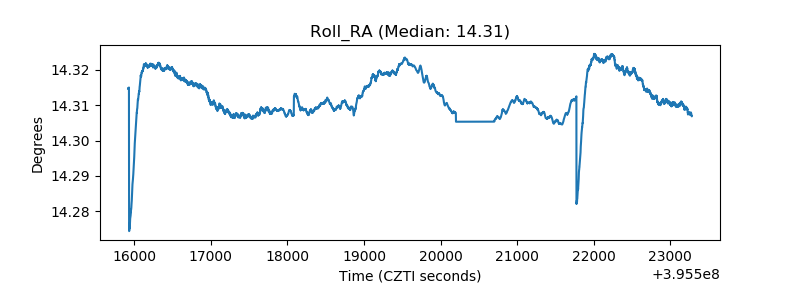 |
| Veto Counter | 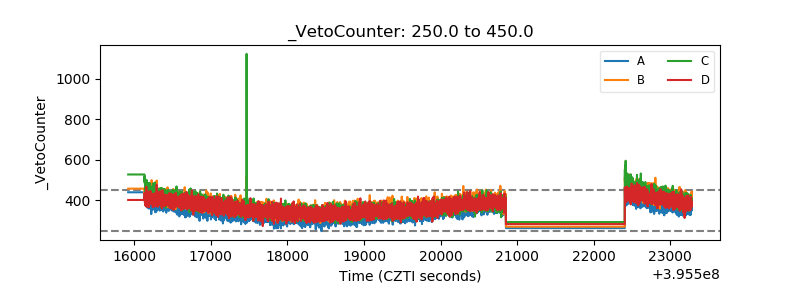 |