| Param | Original file | Final file |
|---|---|---|
| Filename | modeM0/AS1A11_101T01_9000005238_36734cztM0_level2.evt | modeM0/AS1A11_101T01_9000005238_36734cztM0_level2_quad_clean.evt |
| Size (bytes) | 441,311,040 | 82,823,040 |
| Size | 420.9 MB | 79.0 MB |
| Events in quadrant A | 2,748,115 | 540,200 |
| Events in quadrant B | 3,275,572 | 541,956 |
| Events in quadrant C | 3,892,983 | 525,068 |
| Events in quadrant D | 3,072,158 | 513,294 |
| Mode M0 | |||
|---|---|---|---|
| Quadrant | BADHDUFLAG | Total packets | Discarded packets |
| A | 0 | 11864 | 3 |
| B | 0 | 13405 | 2 |
| C | 0 | 15122 | 2 |
| D | 0 | 13029 | 2 |
| Mode SS | |||
|---|---|---|---|
| Quadrant | BADHDUFLAG | Total packets | Discarded packets |
| A | 0 | 116 | 0 |
| B | 0 | 116 | 0 |
| C | 0 | 116 | 0 |
| D | 0 | 116 | 0 |
| Mode M9 | |||
|---|---|---|---|
| Quadrant | BADHDUFLAG | Total packets | Discarded packets |
| A | 0 | 32 | 0 |
| B | 0 | 32 | 0 |
| C | 0 | 32 | 0 |
| D | 0 | 32 | 0 |
| Quadrant | Total seconds | Saturated seconds | Saturation percentage |
|---|---|---|---|
| A | 5535 | 25 | 0.451671% |
| B | 5535 | 152 | 2.746161% |
| C | 5535 | 281 | 5.076784% |
| D | 5535 | 91 | 1.644083% |
Noise dominated data is calculated using 1-second bins in cleaned event files. If a bin has >2000 counts, and if more than 50% of those come from <1% of pixels, then it is considered to be noise-dominated and hence unusable.
| Quadrant | # 1 sec bins | Bins with >0 counts | Bins with >2000 counts | High rate bins dominated by noise | Noise dominated (total time) | Noise dominated (detector-on time) | Marked lightcurve |
|---|---|---|---|---|---|---|---|
| A | 8761 | 5537 | 13 | 13 | 0.15% | 0.23% | 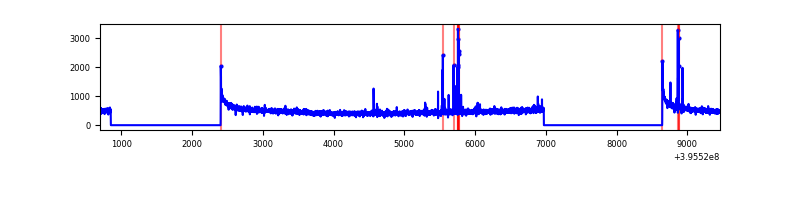 |
| B | 8761 | 5537 | 93 | 93 | 1.06% | 1.68% | 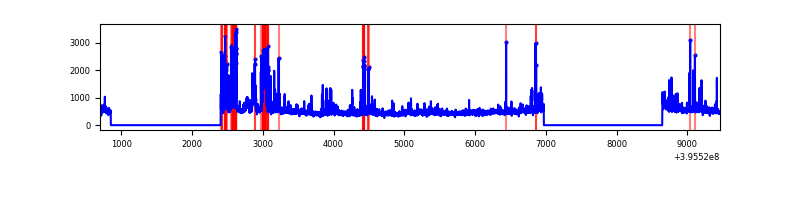 |
| C | 8761 | 5537 | 216 | 216 | 2.47% | 3.90% | 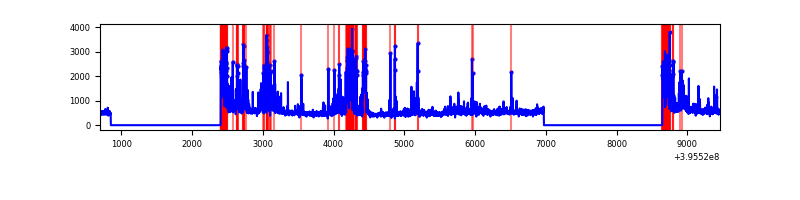 |
| D | 8761 | 5537 | 77 | 77 | 0.88% | 1.39% | 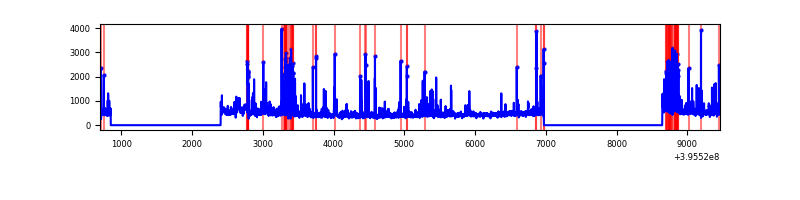 |
Top three noisy pixels from each quadrant. If the there are fewer than three noisy pixels in the level2.evt file, extra rows are filled as -1
| Pixel properties | Quadrant properties | ||||||
|---|---|---|---|---|---|---|---|
| Quadrant | DetID | PixID | Counts | Sigma | Mean | Median | Sigma |
| A | 10 | 83 | 225598 | 1744.23 | 631 | 617 | 129.0 |
| A | 9 | 143 | 49328 | 377.65 | 631 | 617 | 129.0 |
| A | 7 | 3 | 21424 | 161.31 | 631 | 617 | 129.0 |
| B | 5 | 200 | 320493 | 2647.5 | 626 | 609 | 120.8 |
| B | 4 | 171 | 174930 | 1442.76 | 626 | 609 | 120.8 |
| B | 0 | 189 | 75269 | 617.92 | 626 | 609 | 120.8 |
| C | 14 | 254 | 646252 | 4579.98 | 602 | 606 | 141.0 |
| C | 0 | 10 | 485746 | 3441.41 | 602 | 606 | 141.0 |
| C | 15 | 214 | 228941 | 1619.73 | 602 | 606 | 141.0 |
| D | 2 | 250 | 219340 | 1450.11 | 613 | 595 | 150.8 |
| D | 13 | 249 | 169701 | 1121.05 | 613 | 595 | 150.8 |
| D | 12 | 227 | 109989 | 725.2 | 613 | 595 | 150.8 |
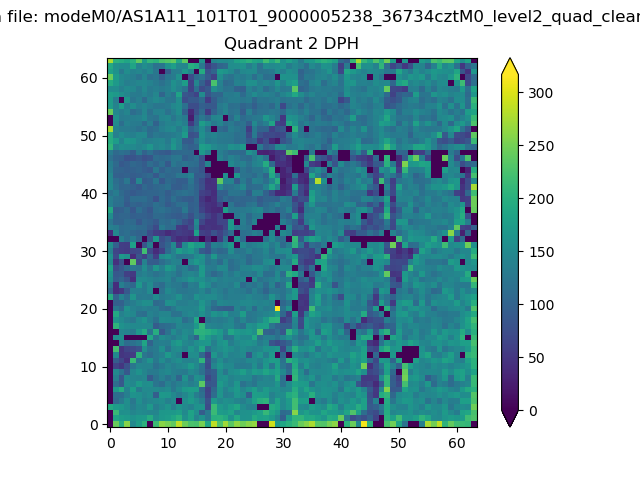
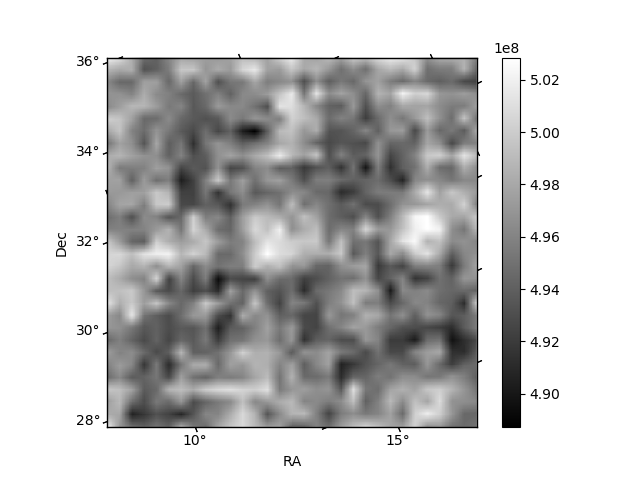
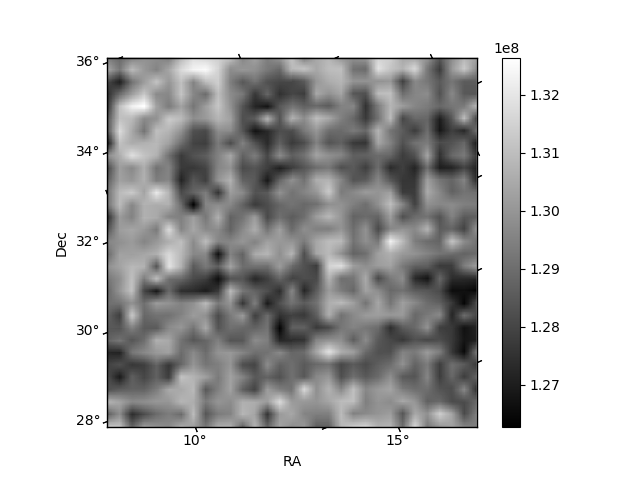
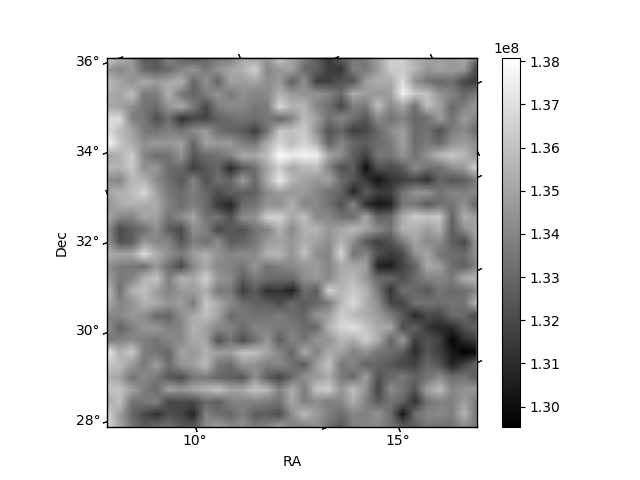
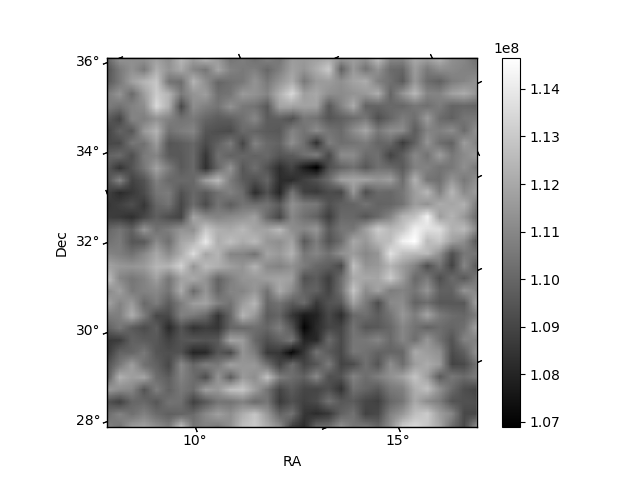
Histogram calculated using DETX and DETY for each event in the final _common_clean file
| Quadrant A | 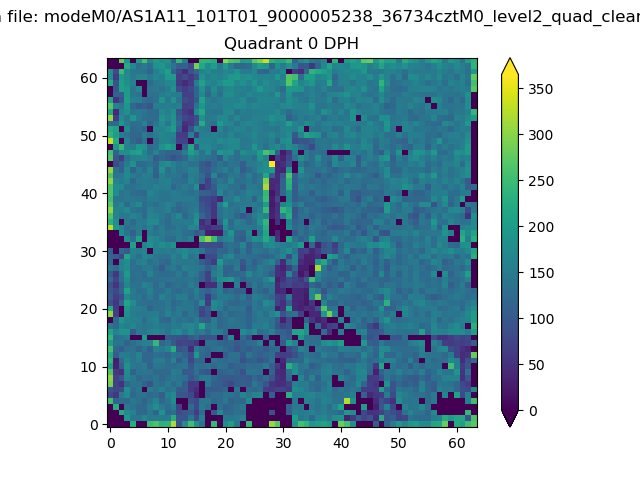 |
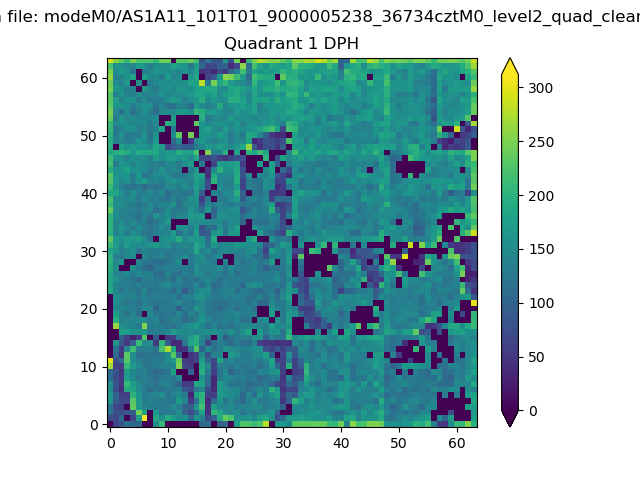 |
Quadrant B |
|---|---|---|---|
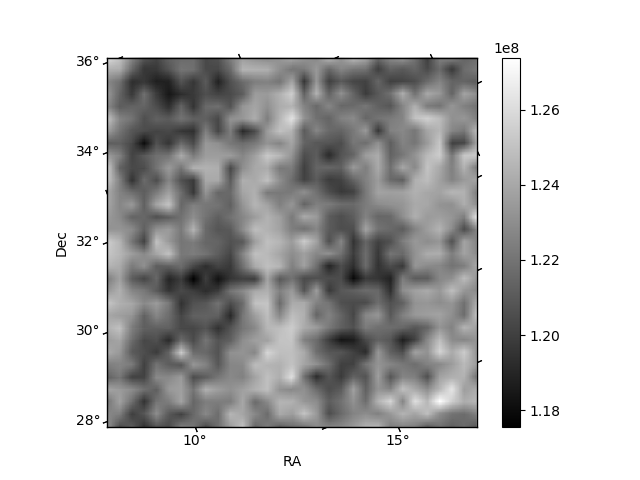
| Quadrant D | 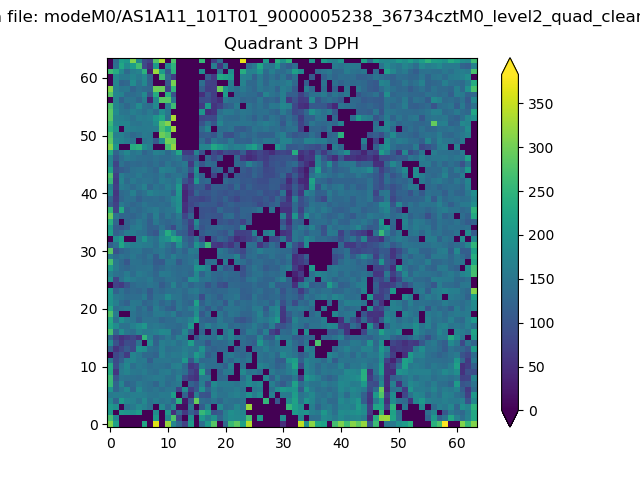 |
 |
Quadrant C |
| Plot type | Count rate plots | Images |
|---|---|---|
| Comparison with Poisson distribution Blue bars denote a histogram of data divided into 1 sec bins. Red curve is a Poisson curve with rate = median count rate of data. |
 |
 |
| Quadrant-wise count rates Data is divided into 100 sec bins |
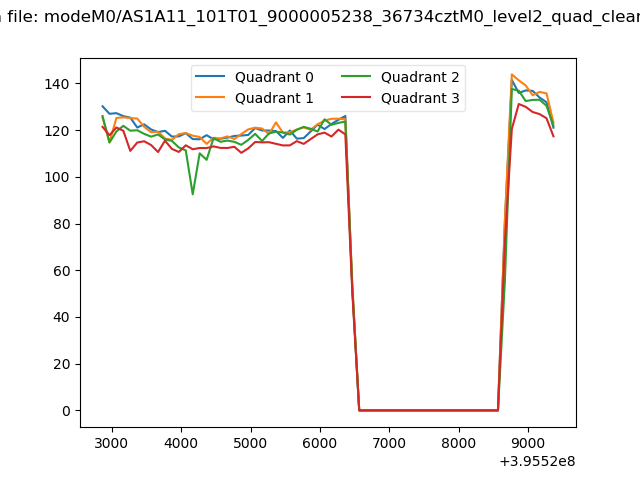 |
|
| Module-wise count rates for Quadrant A Data is divided into 100 sec bins |
 |
 |
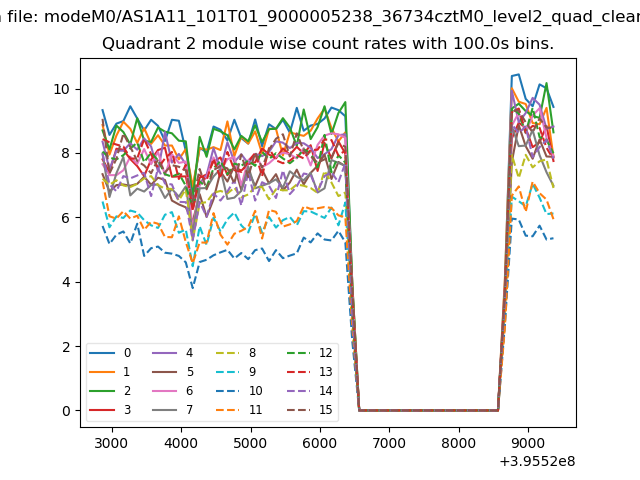
| Module-wise count rates for Quadrant B Data is divided into 100 sec bins |
 |
 |
| Module-wise count rates for Quadrant C Data is divided into 100 sec bins |
 |
 |
| Module-wise count rates for Quadrant D Data is divided into 100 sec bins |
 |
 |
| Parameter | Plot |
|---|---|
| CZT HV Monitor | 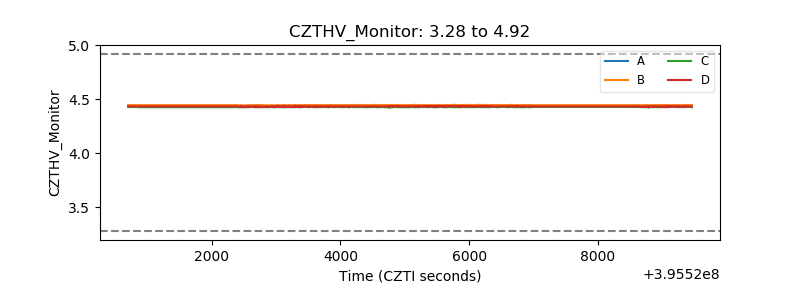 |
| D_VDD | 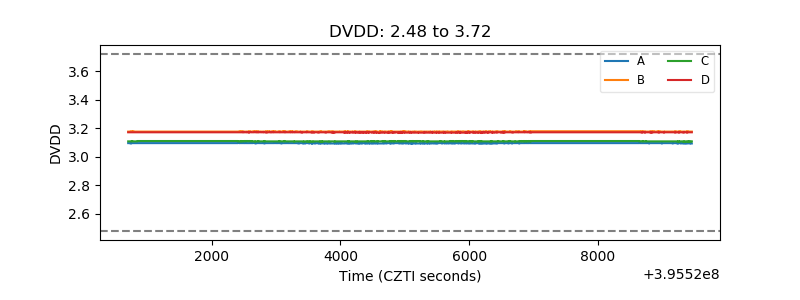 |
| Temperature 1 | 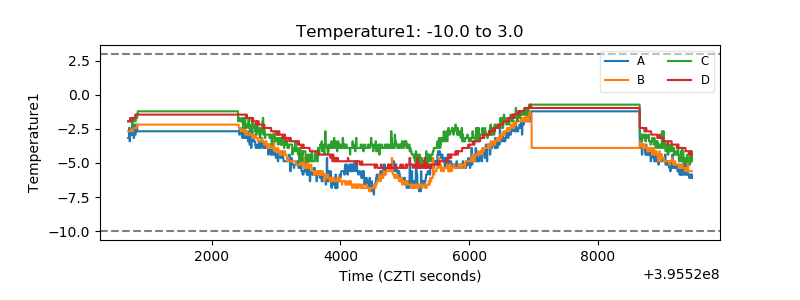 |
| Veto HV Monitor | 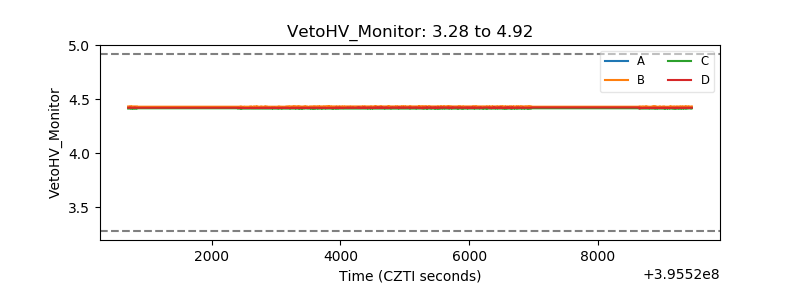 |
| Veto LLD | 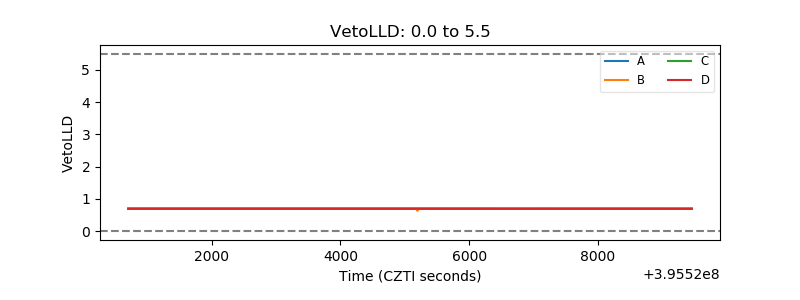 |
| Alpha Counter | 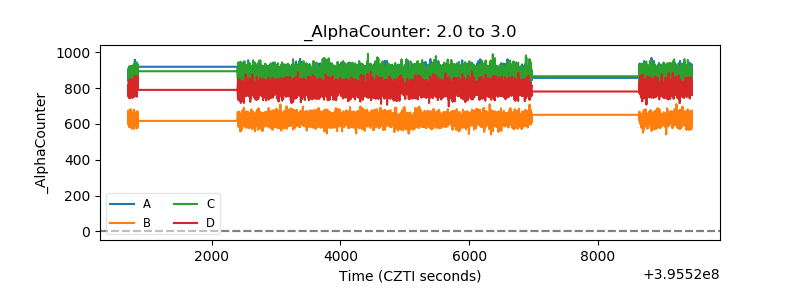 |
| _CPM_Rate | 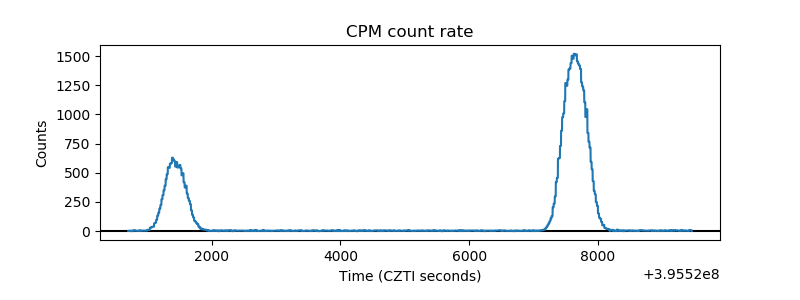 |
| CZT Counter | 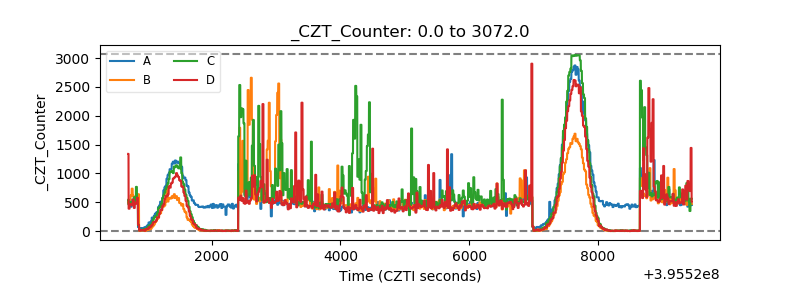 |
| +2.5 Volts monitor |  |
| +5 Volts monitor | 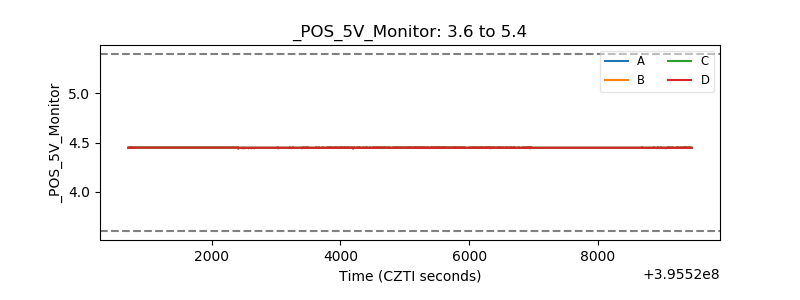 |
| _ROLL_ROT | 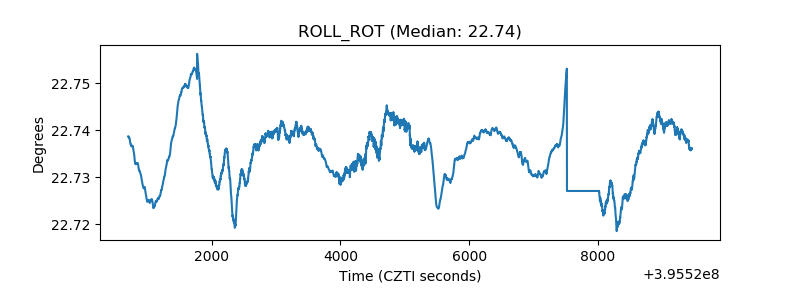 |
| _Roll_DEC | 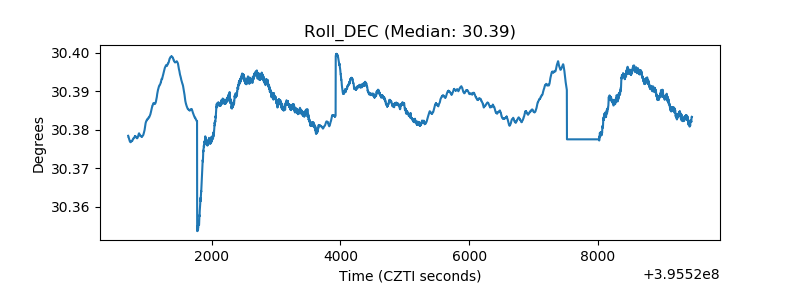 |
| _Roll_RA | 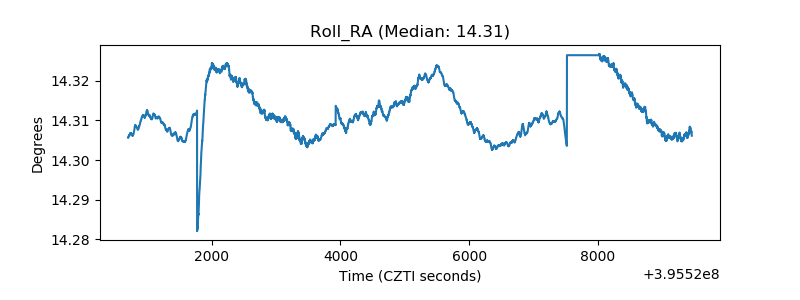 |
| Veto Counter | 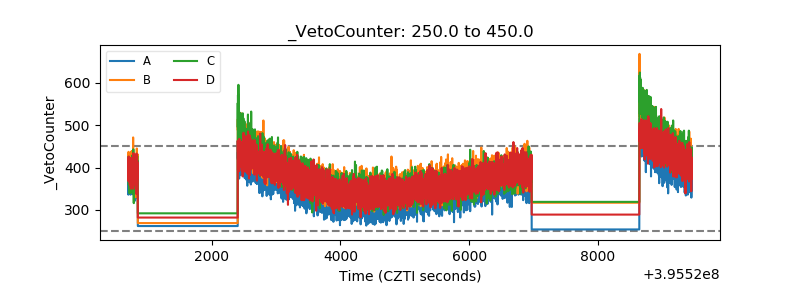 |