| Param | Original file | Final file |
|---|---|---|
| Filename | modeM0/AS1A11_101T01_9000005238_36736cztM0_level2.evt | modeM0/AS1A11_101T01_9000005238_36736cztM0_level2_quad_clean.evt |
| Size (bytes) | 460,416,960 | 86,224,320 |
| Size | 439.1 MB | 82.2 MB |
| Events in quadrant A | 2,649,163 | 578,248 |
| Events in quadrant B | 3,242,542 | 570,335 |
| Events in quadrant C | 3,631,685 | 566,775 |
| Events in quadrant D | 4,056,342 | 520,192 |
| Mode M0 | |||
|---|---|---|---|
| Quadrant | BADHDUFLAG | Total packets | Discarded packets |
| A | 0 | 11450 | 3 |
| B | 0 | 13214 | 2 |
| C | 0 | 14183 | 2 |
| D | 0 | 15879 | 2 |
| Mode SS | |||
|---|---|---|---|
| Quadrant | BADHDUFLAG | Total packets | Discarded packets |
| A | 0 | 110 | 0 |
| B | 0 | 110 | 0 |
| C | 0 | 110 | 0 |
| D | 0 | 110 | 0 |
| Mode M9 | |||
|---|---|---|---|
| Quadrant | BADHDUFLAG | Total packets | Discarded packets |
| A | 0 | 22 | 0 |
| B | 0 | 22 | 0 |
| C | 0 | 22 | 0 |
| D | 0 | 23 | 0 |
| Quadrant | Total seconds | Saturated seconds | Saturation percentage |
|---|---|---|---|
| A | 5356 | 18 | 0.336072% |
| B | 5356 | 259 | 4.835698% |
| C | 5356 | 196 | 3.659447% |
| D | 5356 | 504 | 9.410007% |
Noise dominated data is calculated using 1-second bins in cleaned event files. If a bin has >2000 counts, and if more than 50% of those come from <1% of pixels, then it is considered to be noise-dominated and hence unusable.
| Quadrant | # 1 sec bins | Bins with >0 counts | Bins with >2000 counts | High rate bins dominated by noise | Noise dominated (total time) | Noise dominated (detector-on time) | Marked lightcurve |
|---|---|---|---|---|---|---|---|
| A | 7148 | 5357 | 7 | 7 | 0.10% | 0.13% | 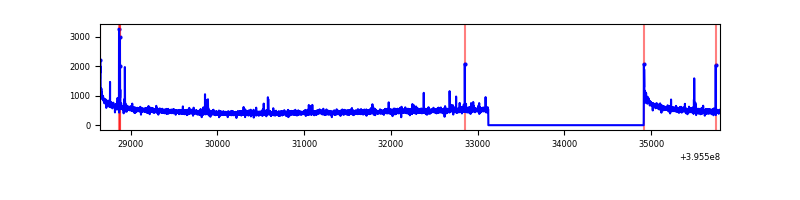 |
| B | 7148 | 5357 | 174 | 174 | 2.43% | 3.25% | 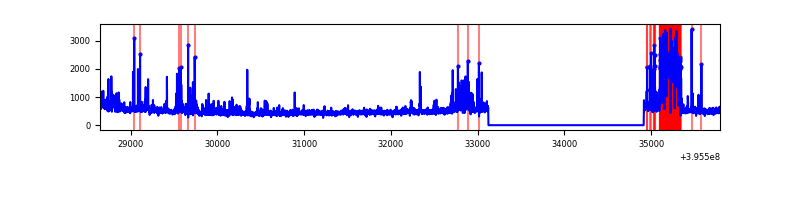 |
| C | 7148 | 5357 | 146 | 146 | 2.04% | 2.73% | 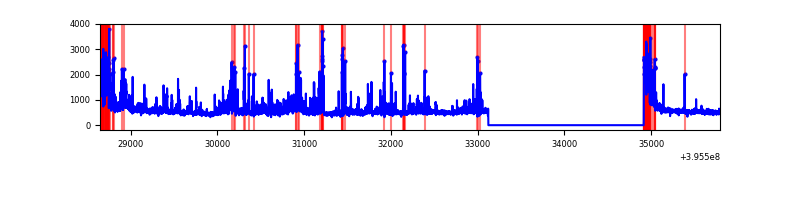 |
| D | 7148 | 5357 | 473 | 473 | 6.62% | 8.83% | 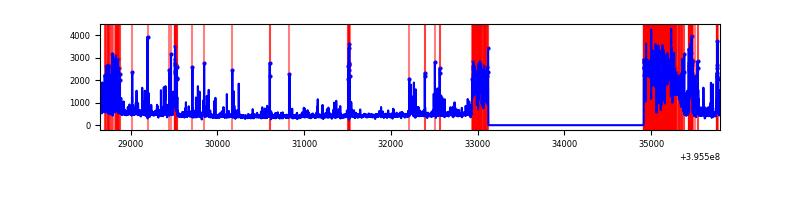 |
Top three noisy pixels from each quadrant. If the there are fewer than three noisy pixels in the level2.evt file, extra rows are filled as -1
| Pixel properties | Quadrant properties | ||||||
|---|---|---|---|---|---|---|---|
| Quadrant | DetID | PixID | Counts | Sigma | Mean | Median | Sigma |
| A | 10 | 83 | 213984 | 1713.24 | 612 | 600 | 124.6 |
| A | 7 | 3 | 30392 | 239.2 | 612 | 600 | 124.6 |
| A | 9 | 143 | 25542 | 200.26 | 612 | 600 | 124.6 |
| B | 5 | 200 | 515604 | 4453.32 | 599 | 584 | 115.6 |
| B | 4 | 171 | 70217 | 602.11 | 599 | 584 | 115.6 |
| B | 0 | 221 | 65057 | 557.49 | 599 | 584 | 115.6 |
| C | 14 | 254 | 544210 | 3931.49 | 591 | 595 | 138.3 |
| C | 0 | 10 | 491327 | 3549.03 | 591 | 595 | 138.3 |
| C | 15 | 214 | 221406 | 1596.93 | 591 | 595 | 138.3 |
| D | 12 | 227 | 1250636 | 8925.52 | 573 | 557 | 140.1 |
| D | 2 | 250 | 171349 | 1219.45 | 573 | 557 | 140.1 |
| D | 13 | 249 | 147152 | 1046.68 | 573 | 557 | 140.1 |
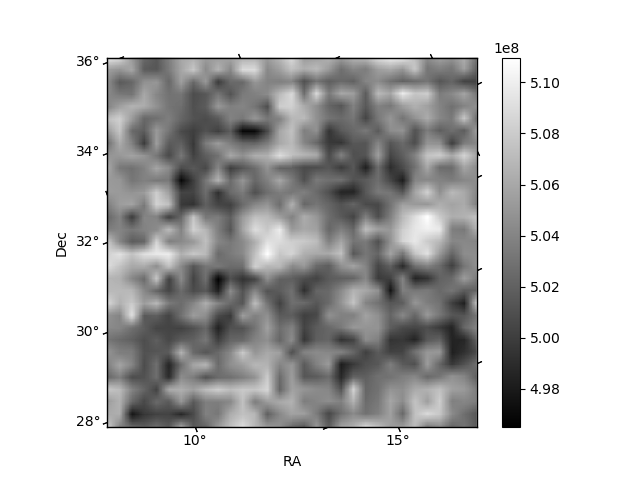
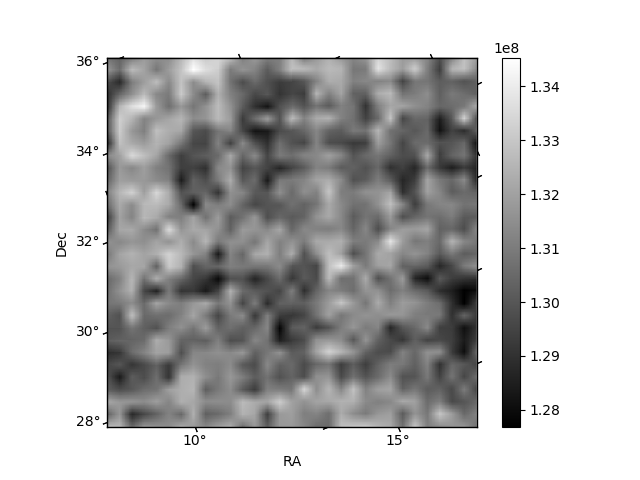
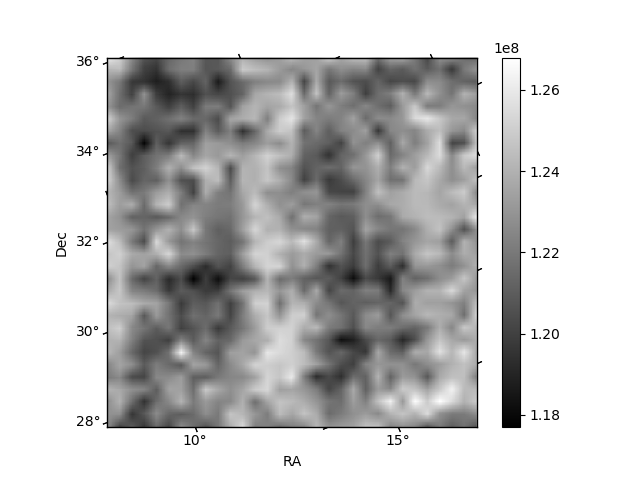
Histogram calculated using DETX and DETY for each event in the final _common_clean file
| Quadrant A | 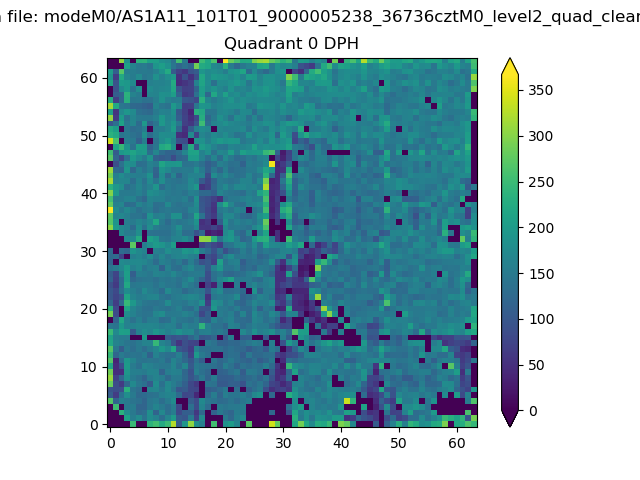 |
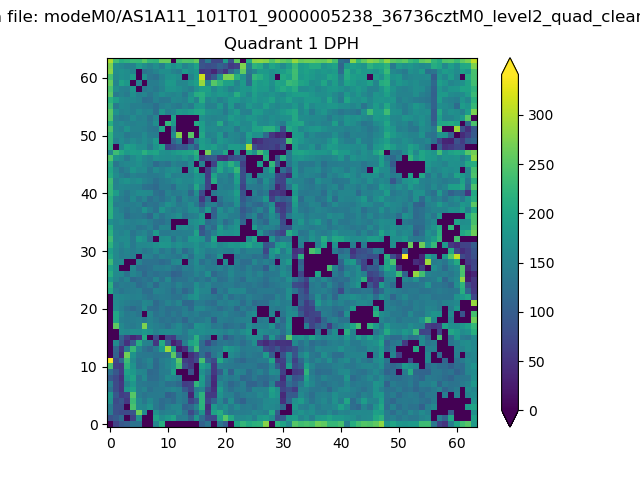 |
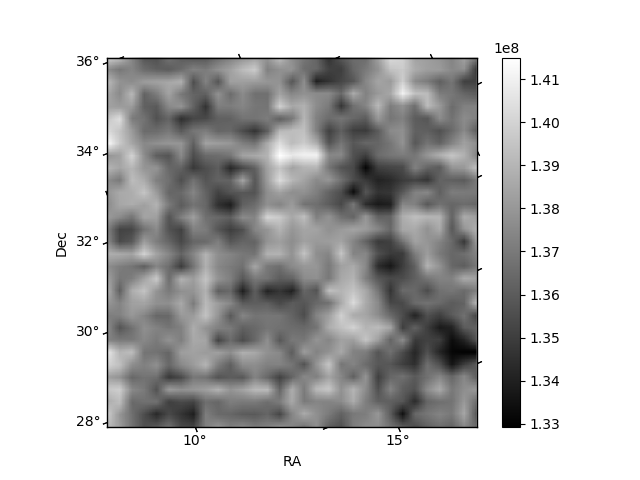
Quadrant B |
|---|---|---|---|
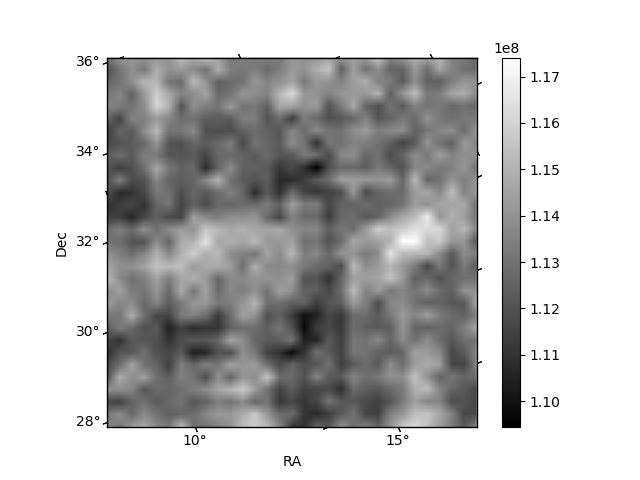
| Quadrant D | 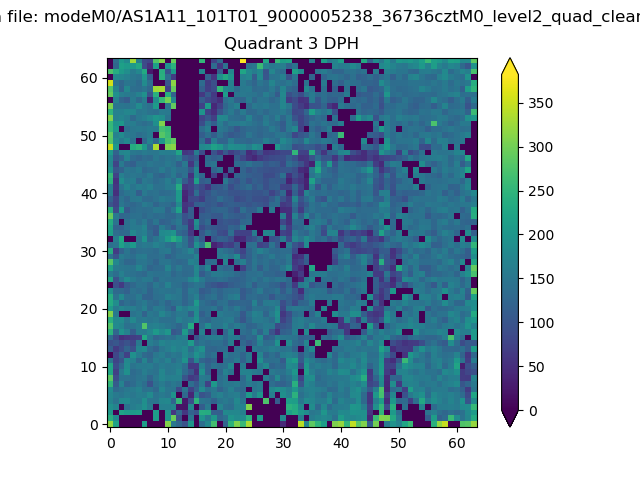 |
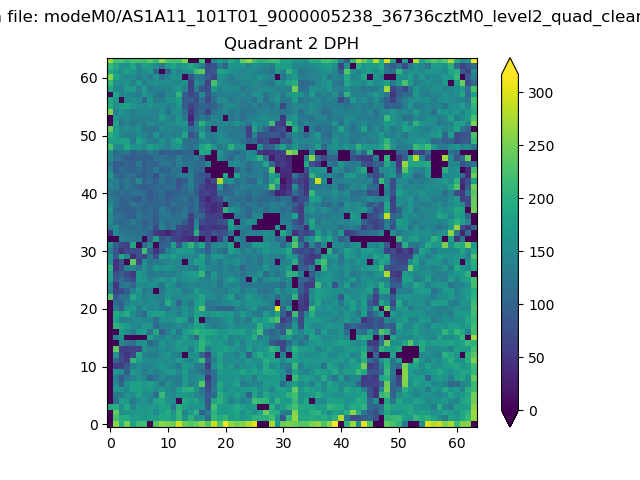 |
Quadrant C |
| Plot type | Count rate plots | Images |
|---|---|---|
| Comparison with Poisson distribution Blue bars denote a histogram of data divided into 1 sec bins. Red curve is a Poisson curve with rate = median count rate of data. |
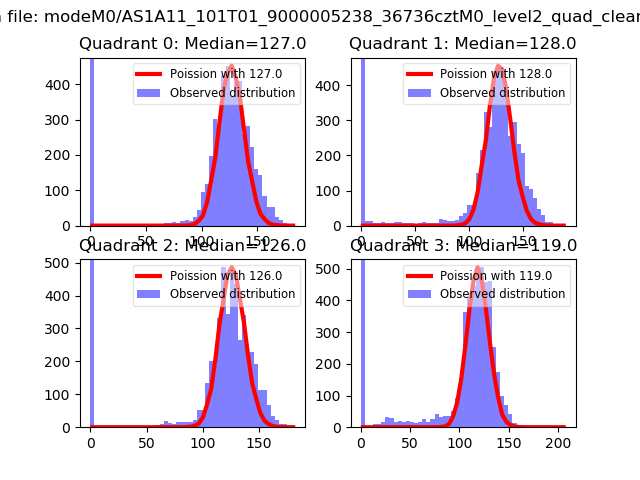 |
 |
| Quadrant-wise count rates Data is divided into 100 sec bins |
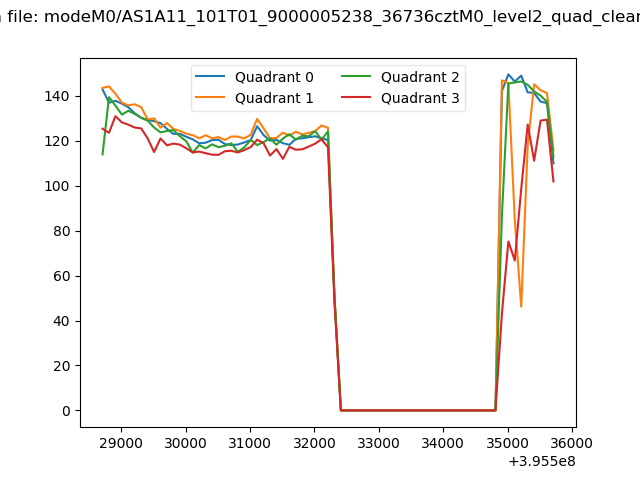 |
|
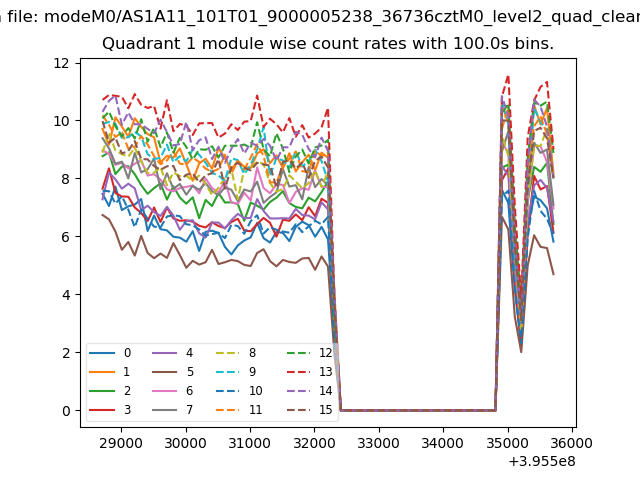
| Module-wise count rates for Quadrant A Data is divided into 100 sec bins |
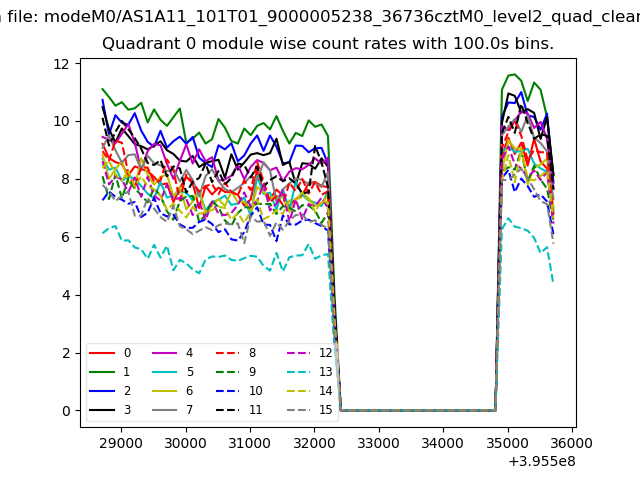 |
 |
| Module-wise count rates for Quadrant B Data is divided into 100 sec bins |
 |
 |
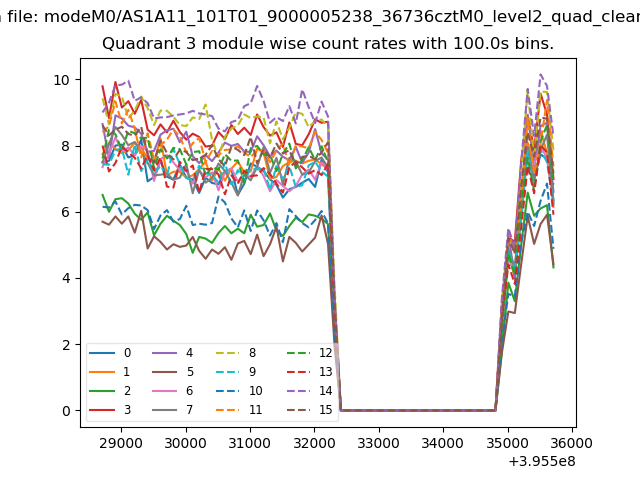
| Module-wise count rates for Quadrant C Data is divided into 100 sec bins |
 |
 |
| Module-wise count rates for Quadrant D Data is divided into 100 sec bins |
 |
 |
| Parameter | Plot |
|---|---|
| CZT HV Monitor | 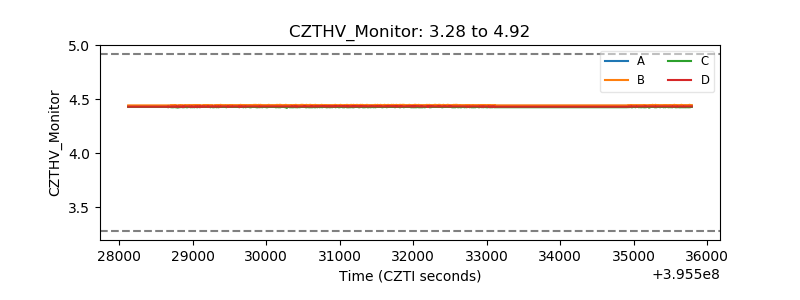 |
| D_VDD | 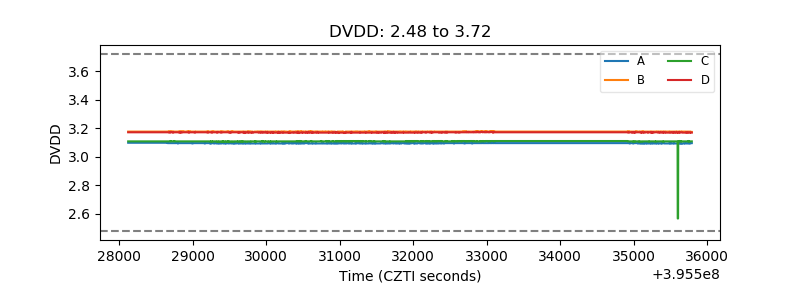 |
| Temperature 1 | 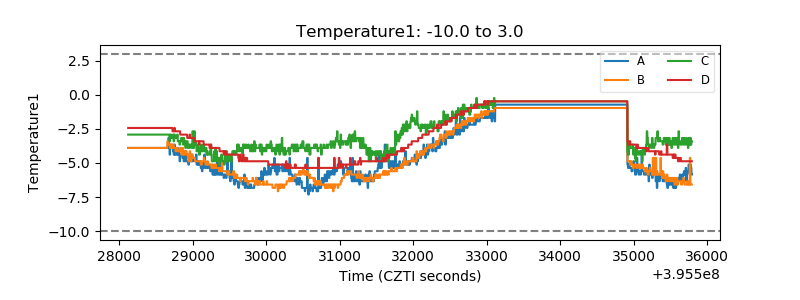 |
| Veto HV Monitor | 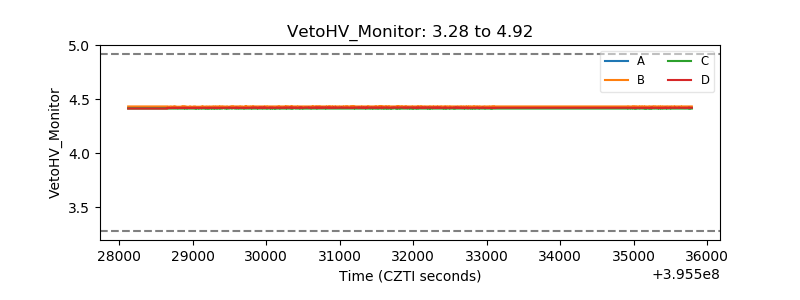 |
| Veto LLD | 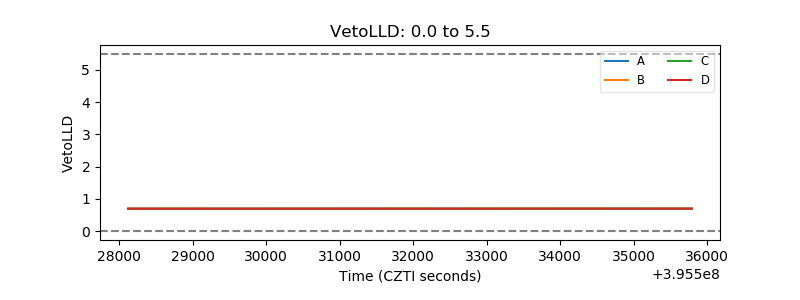 |
| Alpha Counter | 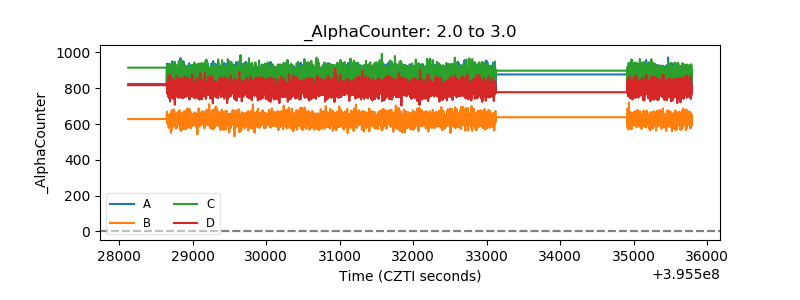 |
| _CPM_Rate | 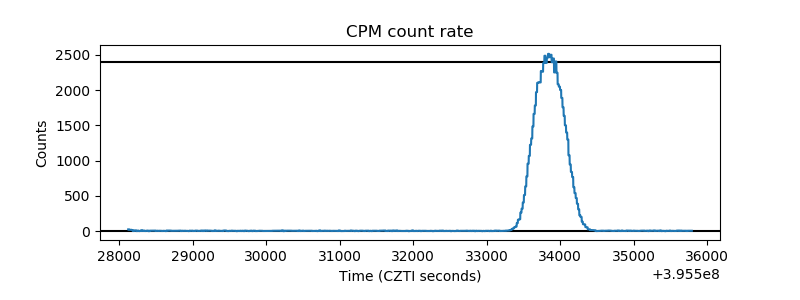 |
| CZT Counter | 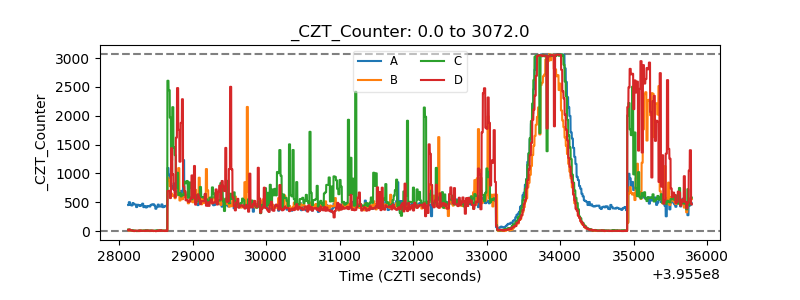 |
| +2.5 Volts monitor |  |
| +5 Volts monitor |  |
| _ROLL_ROT | 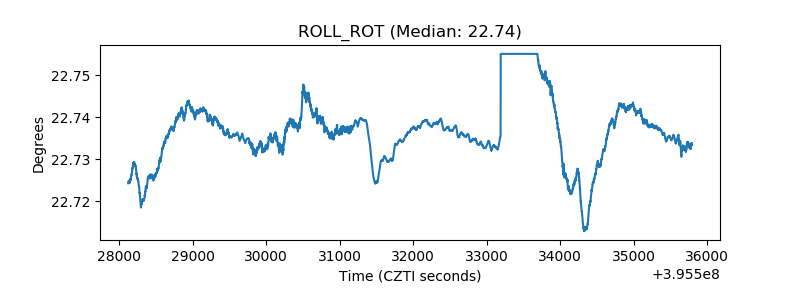 |
| _Roll_DEC | 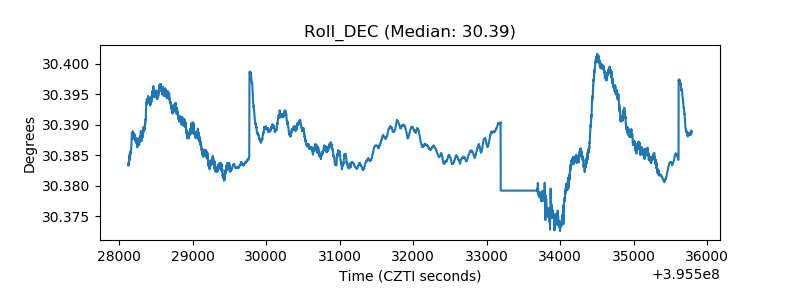 |
| _Roll_RA | 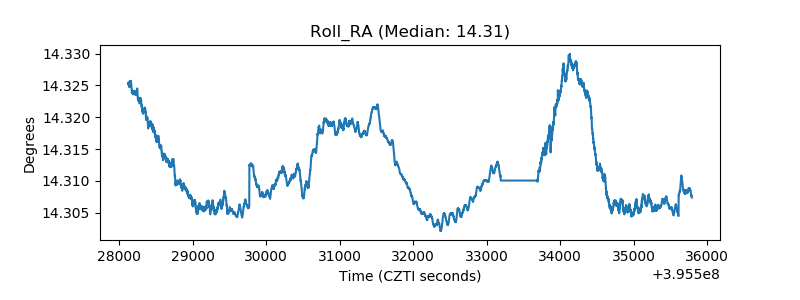 |
| Veto Counter | 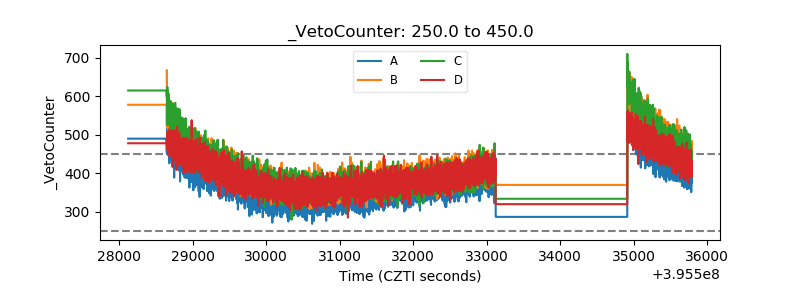 |