| Param | Original file | Final file |
|---|---|---|
| Filename | modeM0/AS1A11_101T01_9000005238_36738cztM0_level2.evt | modeM0/AS1A11_101T01_9000005238_36738cztM0_level2_quad_clean.evt |
| Size (bytes) | 380,148,480 | 77,391,360 |
| Size | 362.5 MB | 73.8 MB |
| Events in quadrant A | 2,538,072 | 502,863 |
| Events in quadrant B | 2,767,881 | 523,513 |
| Events in quadrant C | 3,189,370 | 489,716 |
| Events in quadrant D | 2,674,284 | 473,940 |
| Mode M0 | |||
|---|---|---|---|
| Quadrant | BADHDUFLAG | Total packets | Discarded packets |
| A | 0 | 10724 | 3 |
| B | 0 | 11428 | 2 |
| C | 0 | 12557 | 2 |
| D | 0 | 11276 | 2 |
| Mode SS | |||
|---|---|---|---|
| Quadrant | BADHDUFLAG | Total packets | Discarded packets |
| A | 0 | 104 | 0 |
| B | 0 | 104 | 0 |
| C | 0 | 104 | 0 |
| D | 0 | 104 | 0 |
| Mode M9 | |||
|---|---|---|---|
| Quadrant | BADHDUFLAG | Total packets | Discarded packets |
| A | 0 | 28 | 0 |
| B | 0 | 28 | 0 |
| C | 0 | 28 | 0 |
| D | 0 | 29 | 0 |
| Quadrant | Total seconds | Saturated seconds | Saturation percentage |
|---|---|---|---|
| A | 5038 | 4 | 0.079397% |
| B | 5038 | 134 | 2.659786% |
| C | 5038 | 184 | 3.652243% |
| D | 5038 | 68 | 1.349742% |
Noise dominated data is calculated using 1-second bins in cleaned event files. If a bin has >2000 counts, and if more than 50% of those come from <1% of pixels, then it is considered to be noise-dominated and hence unusable.
| Quadrant | # 1 sec bins | Bins with >0 counts | Bins with >2000 counts | High rate bins dominated by noise | Noise dominated (total time) | Noise dominated (detector-on time) | Marked lightcurve |
|---|---|---|---|---|---|---|---|
| A | 7069 | 5039 | 0 | 0 | 0.00% | 0.00% | 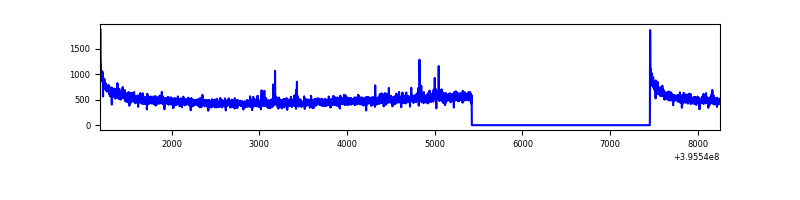 |
| B | 7069 | 5039 | 55 | 55 | 0.78% | 1.09% | 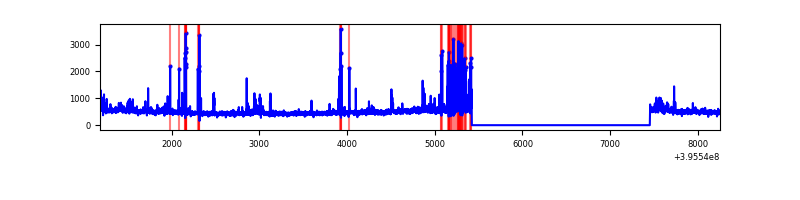 |
| C | 7069 | 5039 | 151 | 151 | 2.14% | 3.00% | 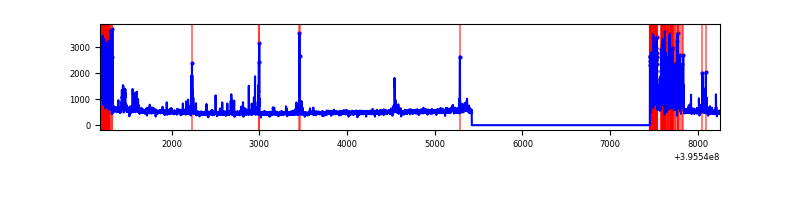 |
| D | 7069 | 5039 | 60 | 60 | 0.85% | 1.19% | 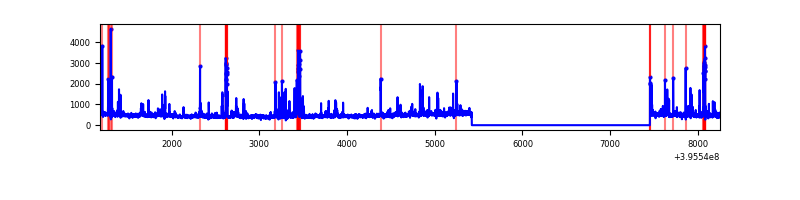 |
Top three noisy pixels from each quadrant. If the there are fewer than three noisy pixels in the level2.evt file, extra rows are filled as -1
| Pixel properties | Quadrant properties | ||||||
|---|---|---|---|---|---|---|---|
| Quadrant | DetID | PixID | Counts | Sigma | Mean | Median | Sigma |
| A | 10 | 83 | 204834 | 1716.68 | 595 | 586 | 119.0 |
| A | 9 | 143 | 10652 | 84.6 | 595 | 586 | 119.0 |
| A | 7 | 16 | 8617 | 67.5 | 595 | 586 | 119.0 |
| B | 5 | 200 | 212632 | 1906.1 | 592 | 577 | 111.3 |
| B | 5 | 255 | 52610 | 467.71 | 592 | 577 | 111.3 |
| B | 4 | 171 | 45502 | 403.82 | 592 | 577 | 111.3 |
| C | 0 | 10 | 645065 | 4833.22 | 573 | 578 | 133.3 |
| C | 15 | 214 | 208601 | 1560.03 | 573 | 578 | 133.3 |
| C | 14 | 254 | 86342 | 643.17 | 573 | 578 | 133.3 |
| D | 2 | 250 | 164459 | 1184.54 | 574 | 560 | 138.4 |
| D | 13 | 249 | 132681 | 954.88 | 574 | 560 | 138.4 |
| D | 13 | 171 | 75091 | 538.66 | 574 | 560 | 138.4 |
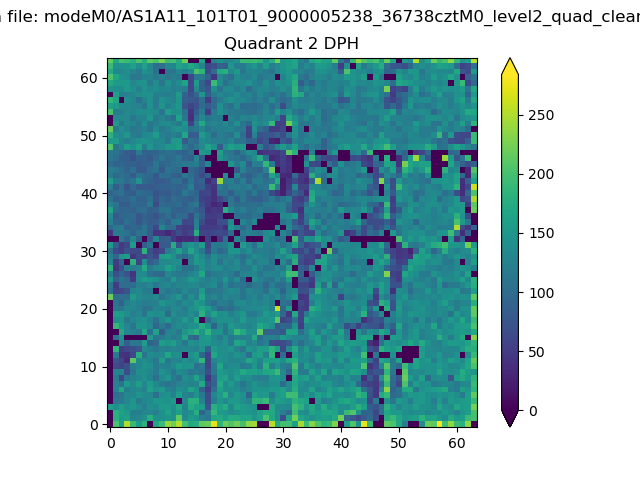
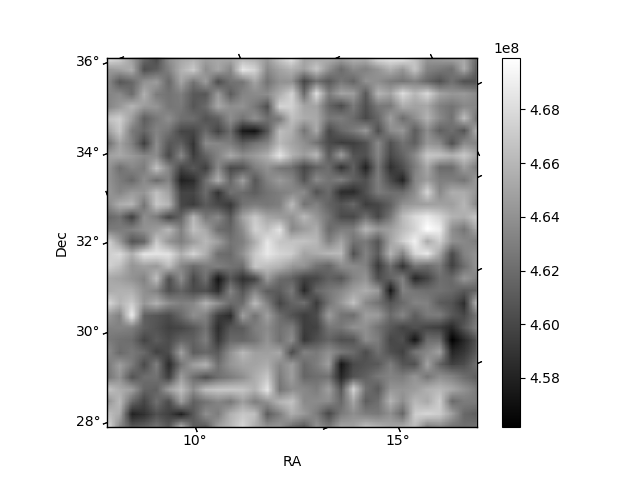
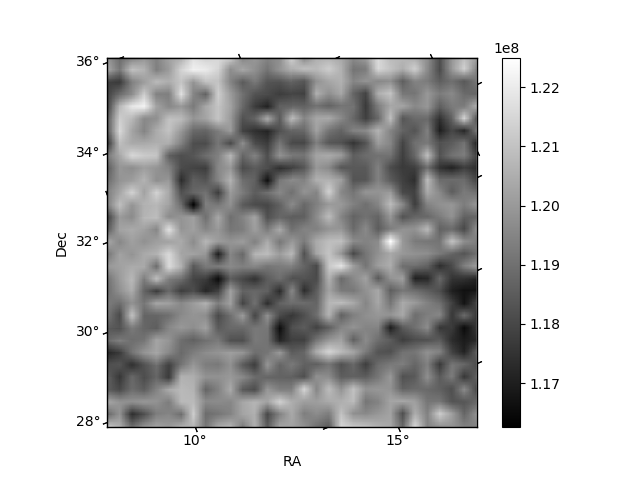
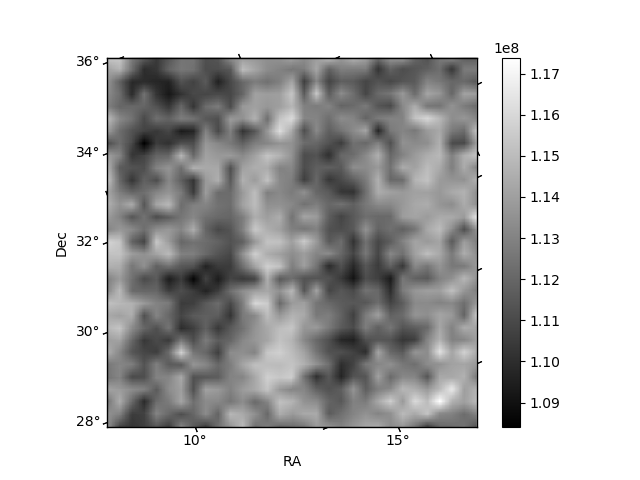
Histogram calculated using DETX and DETY for each event in the final _common_clean file
| Quadrant A | 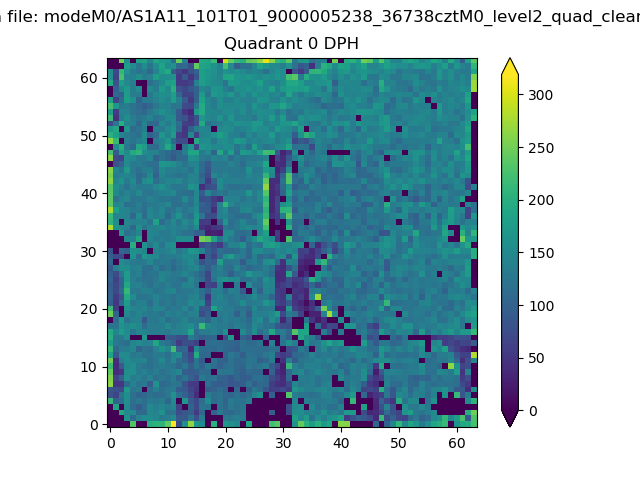 |
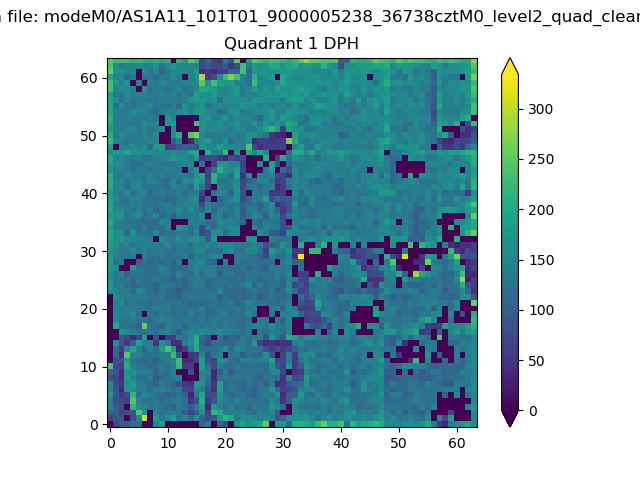 |
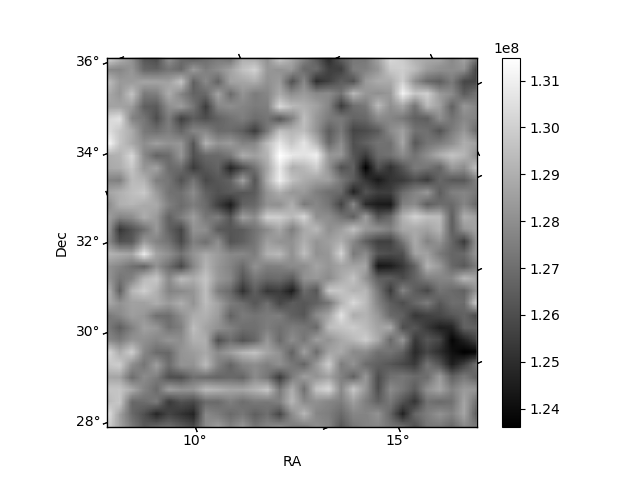
Quadrant B |
|---|---|---|---|
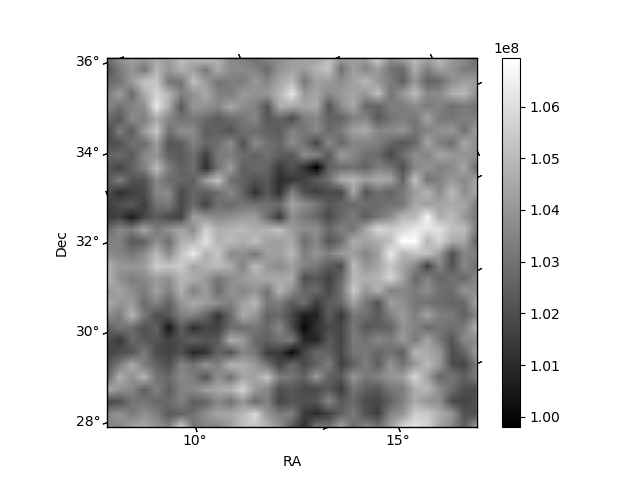
| Quadrant D | 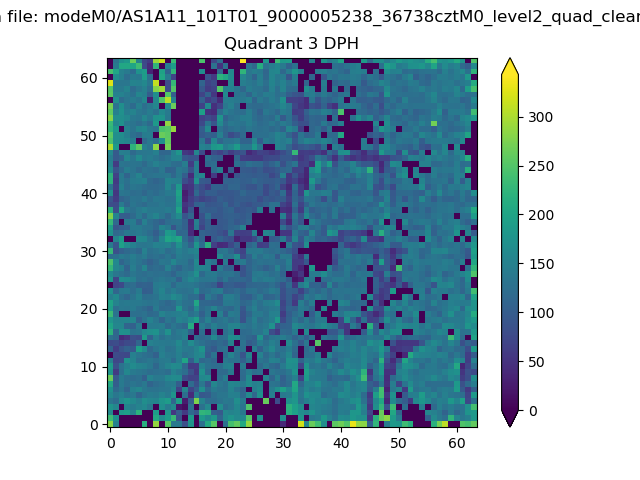 |
 |
Quadrant C |
| Plot type | Count rate plots | Images |
|---|---|---|
| Comparison with Poisson distribution Blue bars denote a histogram of data divided into 1 sec bins. Red curve is a Poisson curve with rate = median count rate of data. |
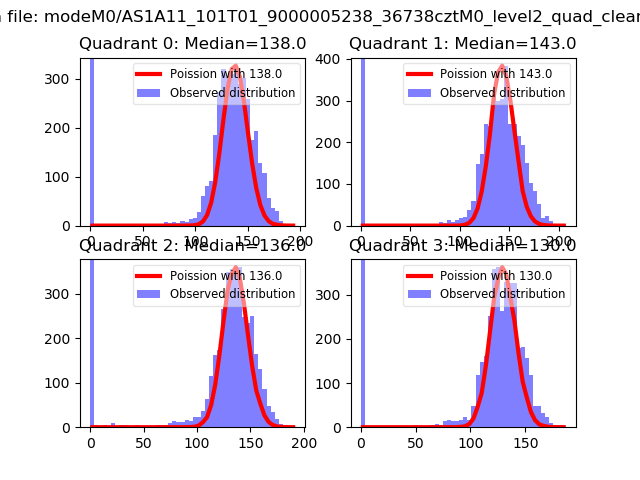 |
 |
| Quadrant-wise count rates Data is divided into 100 sec bins |
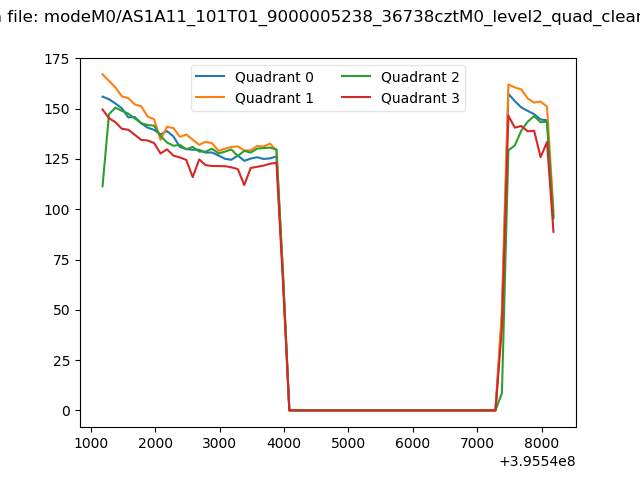 |
|
| Module-wise count rates for Quadrant A Data is divided into 100 sec bins |
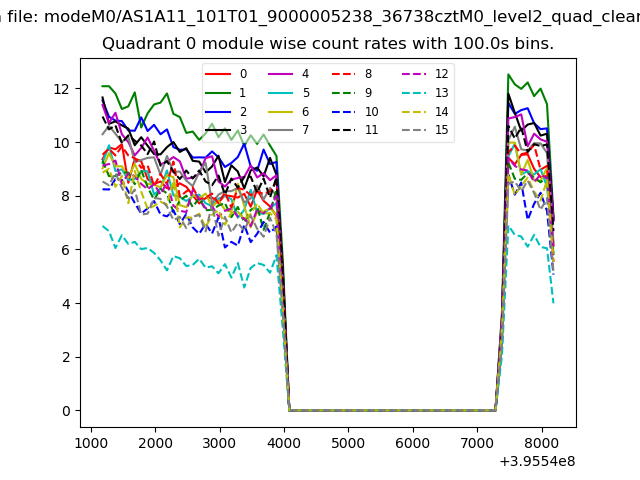 |
 |
| Module-wise count rates for Quadrant B Data is divided into 100 sec bins |
 |
 |
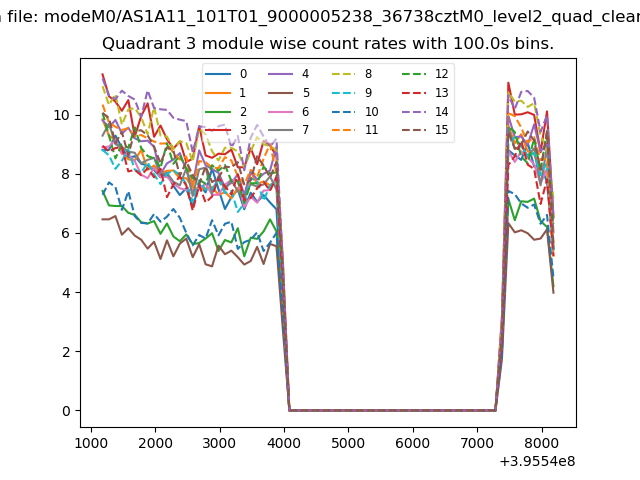
| Module-wise count rates for Quadrant C Data is divided into 100 sec bins |
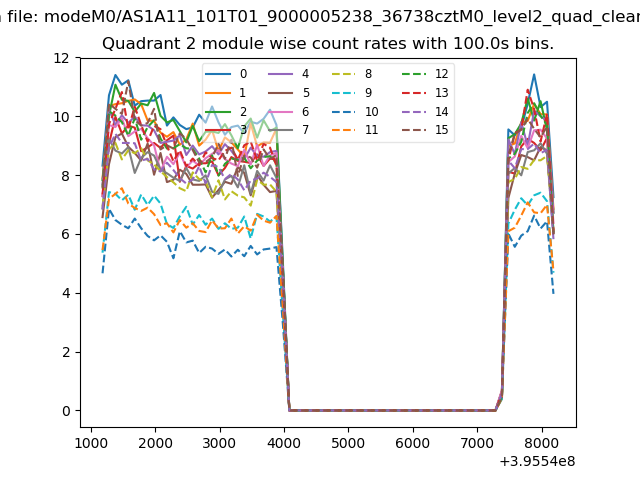 |
 |
| Module-wise count rates for Quadrant D Data is divided into 100 sec bins |
 |
 |
| Parameter | Plot |
|---|---|
| CZT HV Monitor |  |
| D_VDD | 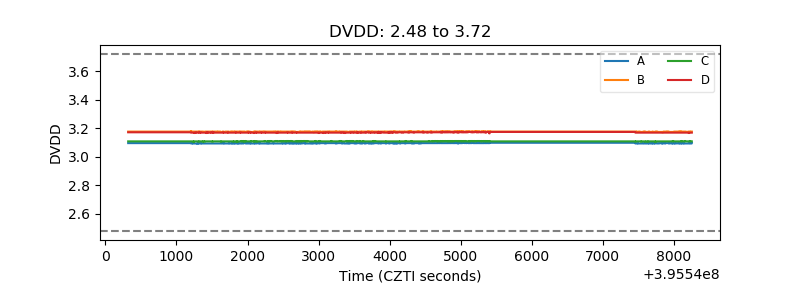 |
| Temperature 1 | 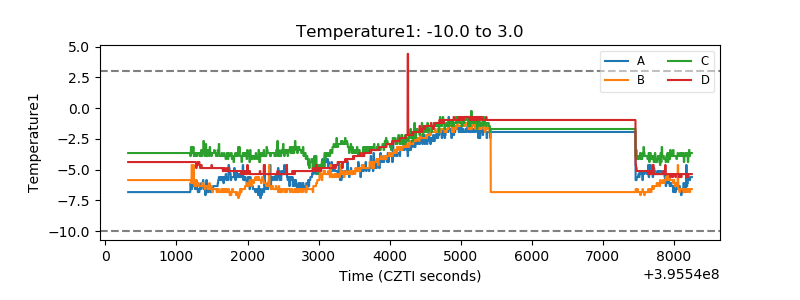 |
| Veto HV Monitor |  |
| Veto LLD | 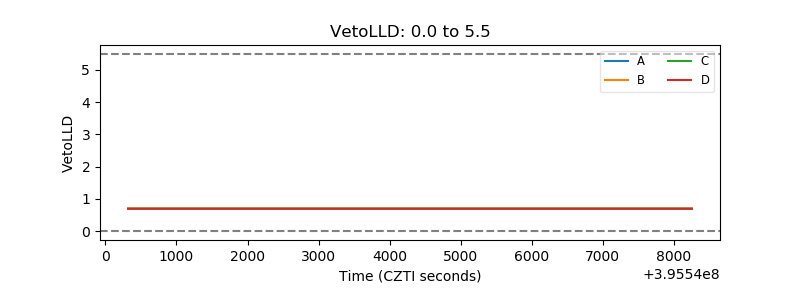 |
| Alpha Counter | 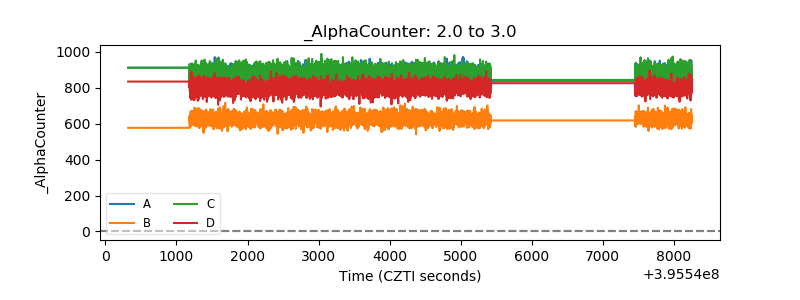 |
| _CPM_Rate | 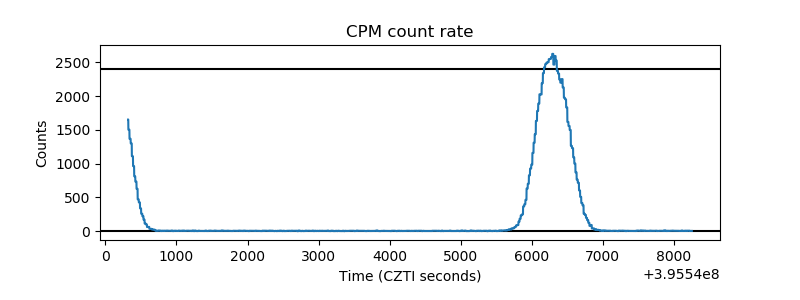 |
| CZT Counter | 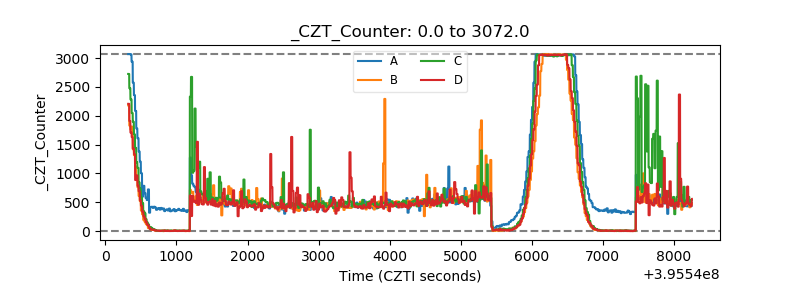 |
| +2.5 Volts monitor | 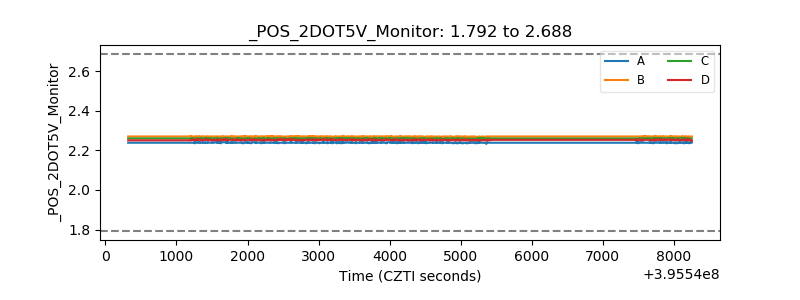 |
| +5 Volts monitor |  |
| _ROLL_ROT |  |
| _Roll_DEC | 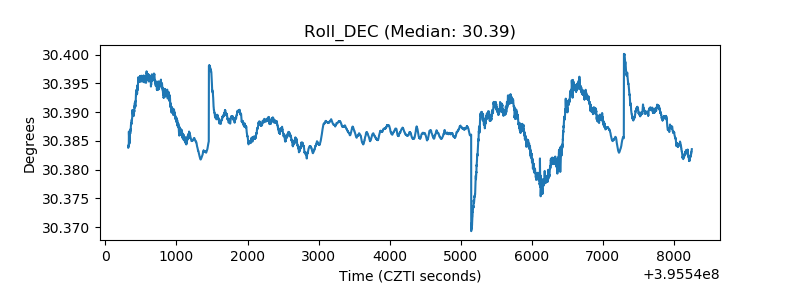 |
| _Roll_RA | 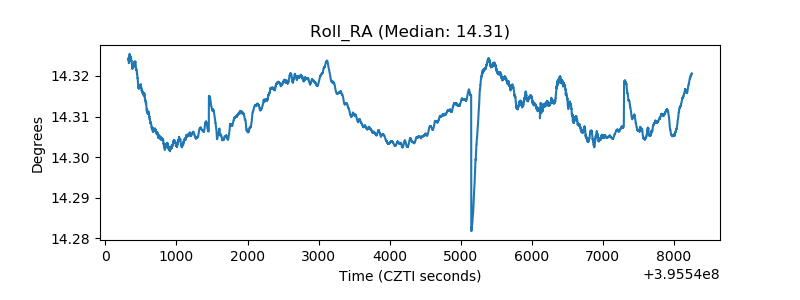 |
| Veto Counter |  |