| Param | Original file | Final file |
|---|---|---|
| Filename | modeM0/AS1A11_101T01_9000005238_36740cztM0_level2.evt | modeM0/AS1A11_101T01_9000005238_36740cztM0_level2_quad_clean.evt |
| Size (bytes) | 674,867,520 | 119,154,240 |
| Size | 643.6 MB | 113.6 MB |
| Events in quadrant A | 4,500,930 | 755,681 |
| Events in quadrant B | 4,790,096 | 781,760 |
| Events in quadrant C | 5,529,100 | 730,705 |
| Events in quadrant D | 5,004,166 | 711,567 |
| Mode M0 | |||
|---|---|---|---|
| Quadrant | BADHDUFLAG | Total packets | Discarded packets |
| A | 0 | 19020 | 4 |
| B | 0 | 20010 | 3 |
| C | 0 | 21979 | 3 |
| D | 0 | 20916 | 3 |
| Mode SS | |||
|---|---|---|---|
| Quadrant | BADHDUFLAG | Total packets | Discarded packets |
| A | 0 | 182 | 0 |
| B | 0 | 182 | 0 |
| C | 0 | 182 | 0 |
| D | 0 | 182 | 0 |
| Mode M9 | |||
|---|---|---|---|
| Quadrant | BADHDUFLAG | Total packets | Discarded packets |
| A | 0 | 41 | 0 |
| B | 0 | 41 | 0 |
| C | 0 | 41 | 0 |
| D | 0 | 42 | 0 |
| Quadrant | Total seconds | Saturated seconds | Saturation percentage |
|---|---|---|---|
| A | 9068 | 10 | 0.110278% |
| B | 9068 | 139 | 1.532863% |
| C | 9068 | 293 | 3.231142% |
| D | 9068 | 142 | 1.565946% |
Noise dominated data is calculated using 1-second bins in cleaned event files. If a bin has >2000 counts, and if more than 50% of those come from <1% of pixels, then it is considered to be noise-dominated and hence unusable.
| Quadrant | # 1 sec bins | Bins with >0 counts | Bins with >2000 counts | High rate bins dominated by noise | Noise dominated (total time) | Noise dominated (detector-on time) | Marked lightcurve |
|---|---|---|---|---|---|---|---|
| A | 19611 | 9070 | 1 | 1 | 0.01% | 0.01% | 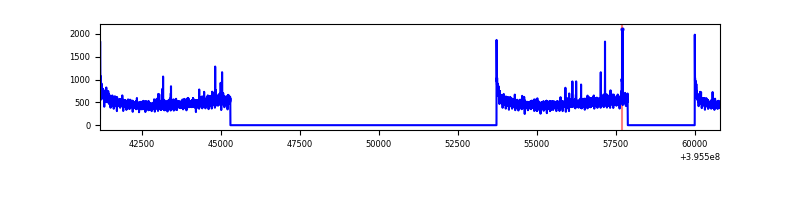 |
| B | 19611 | 9070 | 67 | 67 | 0.34% | 0.74% | 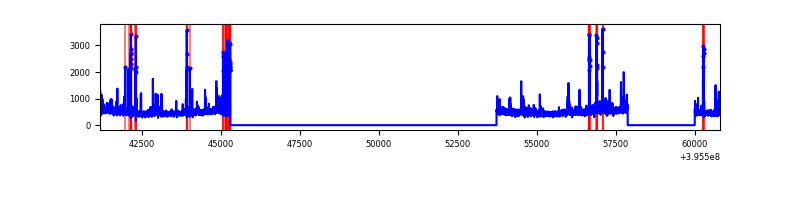 |
| C | 19611 | 9070 | 235 | 235 | 1.20% | 2.59% | 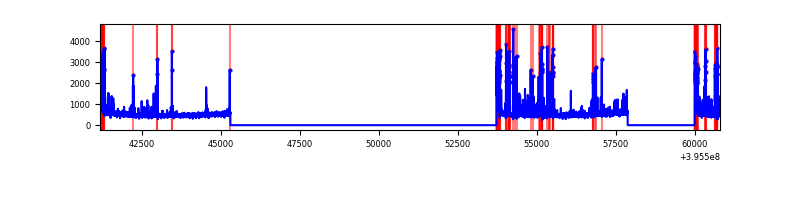 |
| D | 19611 | 9070 | 115 | 115 | 0.59% | 1.27% | 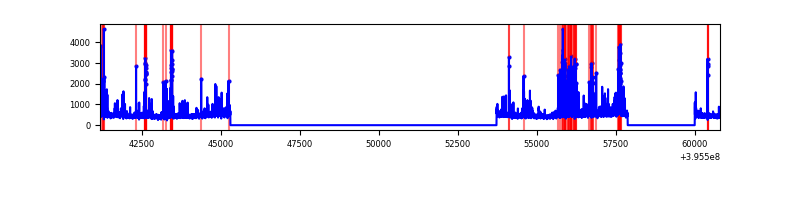 |
Top three noisy pixels from each quadrant. If the there are fewer than three noisy pixels in the level2.evt file, extra rows are filled as -1
| Pixel properties | Quadrant properties | ||||||
|---|---|---|---|---|---|---|---|
| Quadrant | DetID | PixID | Counts | Sigma | Mean | Median | Sigma |
| A | 10 | 83 | 341281 | 1610.86 | 1064 | 1048 | 211.2 |
| A | 9 | 143 | 26467 | 120.35 | 1064 | 1048 | 211.2 |
| A | 13 | 254 | 14338 | 62.92 | 1064 | 1048 | 211.2 |
| B | 5 | 200 | 210683 | 1059.22 | 1058 | 1034 | 197.9 |
| B | 5 | 255 | 95507 | 477.31 | 1058 | 1034 | 197.9 |
| B | 0 | 213 | 88925 | 444.06 | 1058 | 1034 | 197.9 |
| C | 14 | 254 | 599029 | 2541.93 | 1012 | 1019 | 235.3 |
| C | 0 | 10 | 582399 | 2471.24 | 1012 | 1019 | 235.3 |
| C | 15 | 214 | 373602 | 1583.72 | 1012 | 1019 | 235.3 |
| D | 12 | 227 | 212307 | 861.45 | 1022 | 1000 | 245.3 |
| D | 2 | 250 | 198266 | 804.21 | 1022 | 1000 | 245.3 |
| D | 13 | 249 | 187558 | 760.55 | 1022 | 1000 | 245.3 |
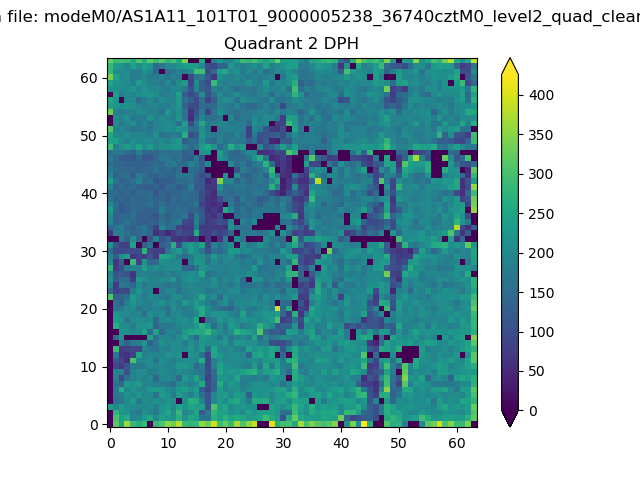
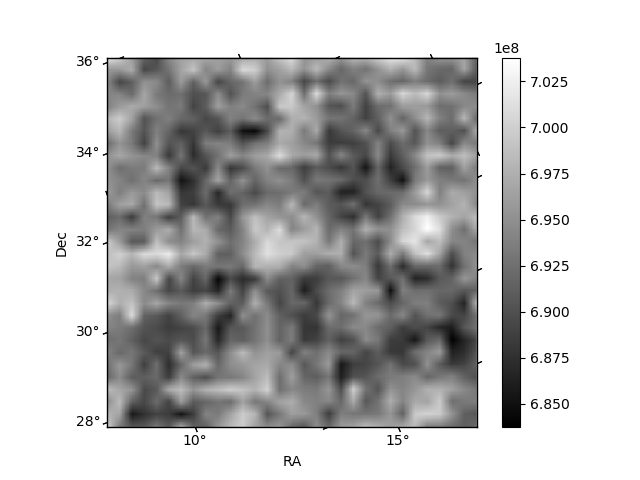
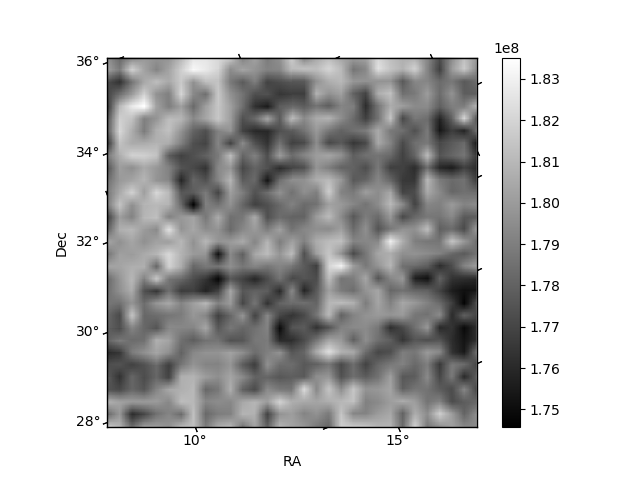
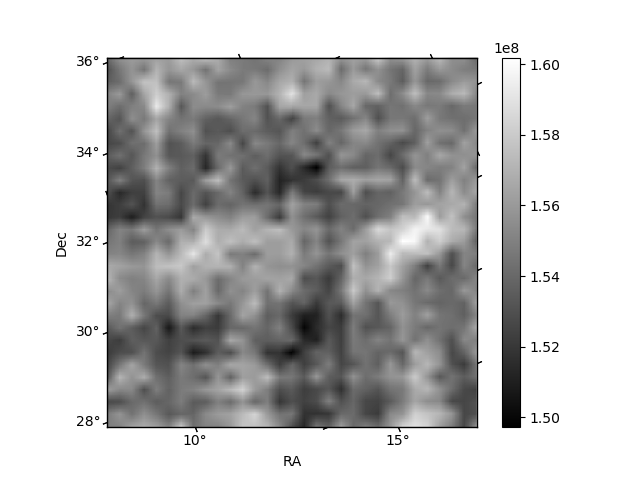
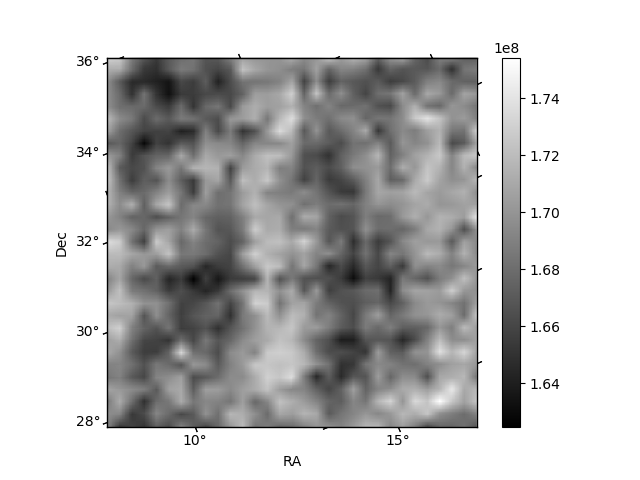
Histogram calculated using DETX and DETY for each event in the final _common_clean file
| Quadrant A | 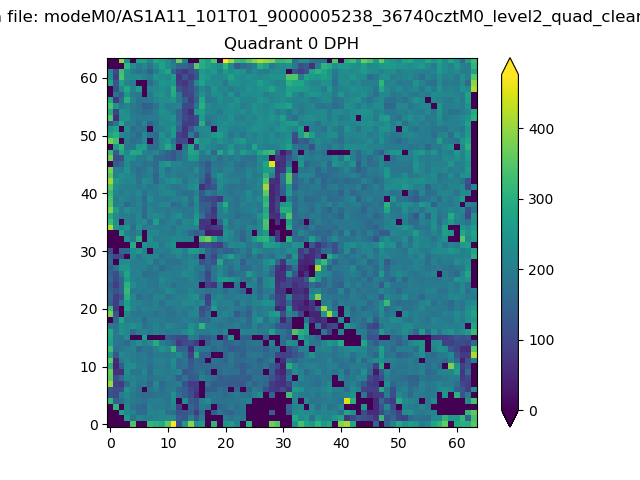 |
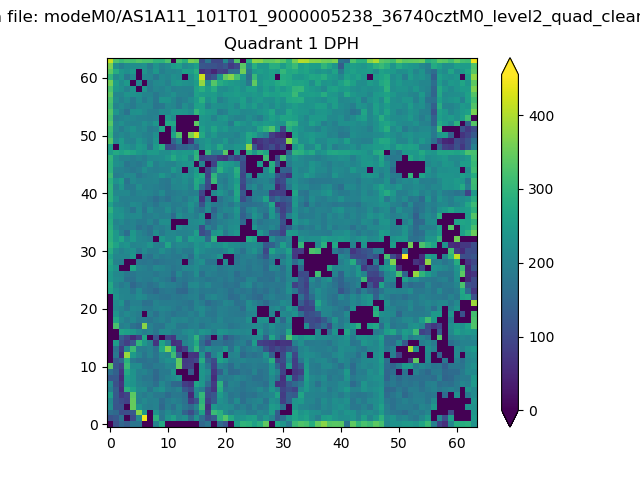 |
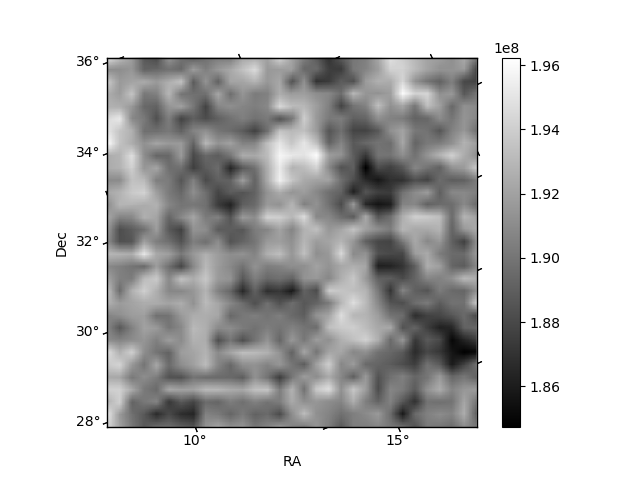
Quadrant B |
|---|---|---|---|
| Quadrant D | 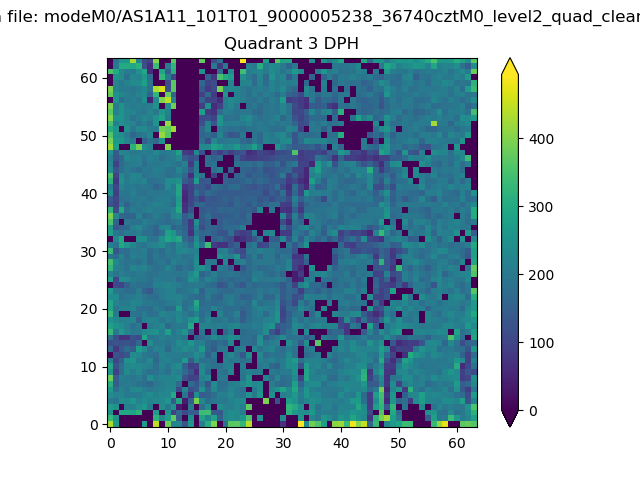 |
 |
Quadrant C |
| Plot type | Count rate plots | Images |
|---|---|---|
| Comparison with Poisson distribution Blue bars denote a histogram of data divided into 1 sec bins. Red curve is a Poisson curve with rate = median count rate of data. |
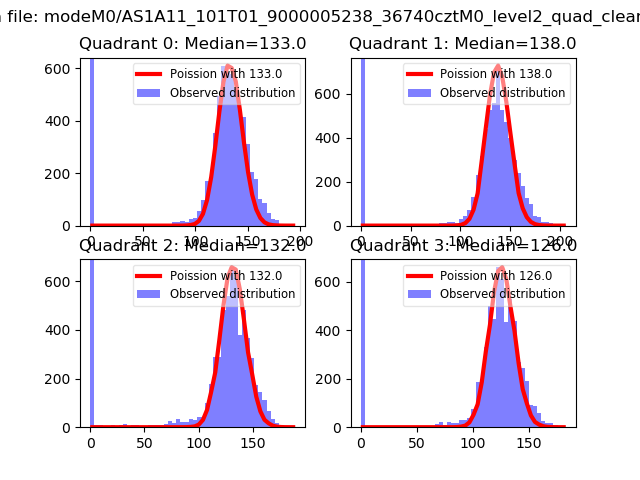 |
 |
| Quadrant-wise count rates Data is divided into 100 sec bins |
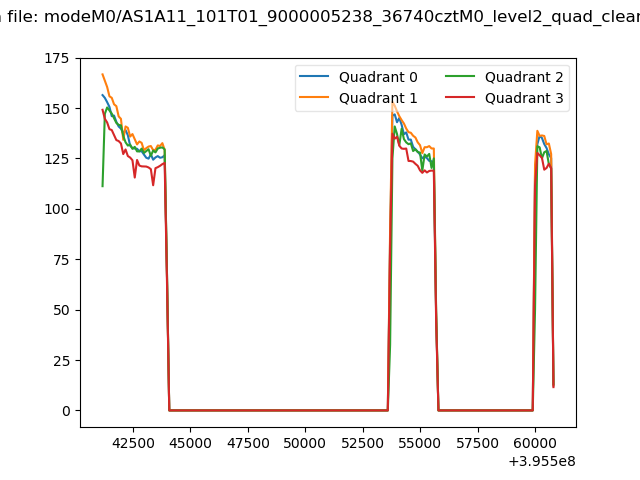 |
|
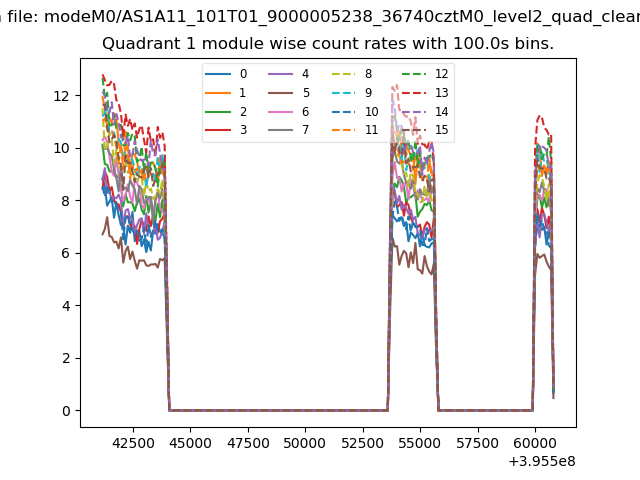
| Module-wise count rates for Quadrant A Data is divided into 100 sec bins |
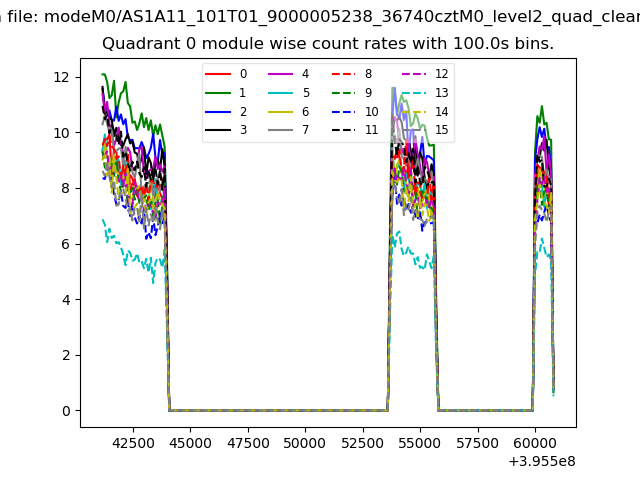 |
 |
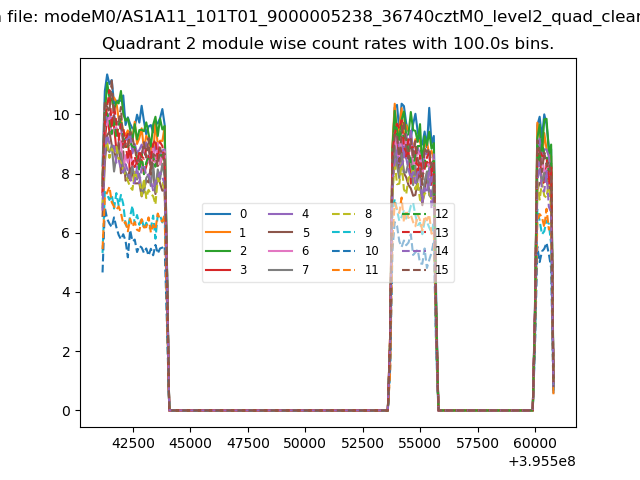
| Module-wise count rates for Quadrant B Data is divided into 100 sec bins |
 |
 |
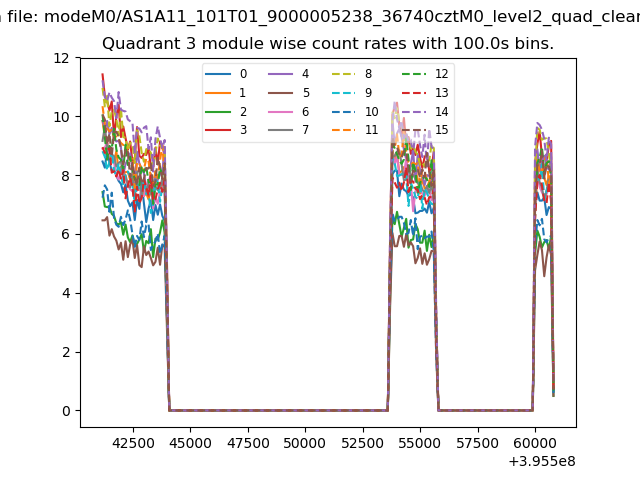
| Module-wise count rates for Quadrant C Data is divided into 100 sec bins |
 |
 |
| Module-wise count rates for Quadrant D Data is divided into 100 sec bins |
 |
 |
| Parameter | Plot |
|---|---|
| CZT HV Monitor | 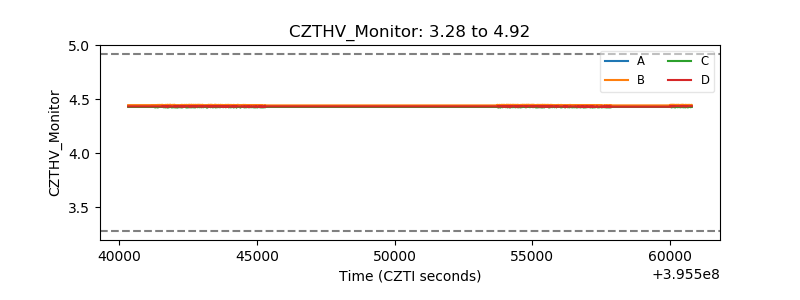 |
| D_VDD | 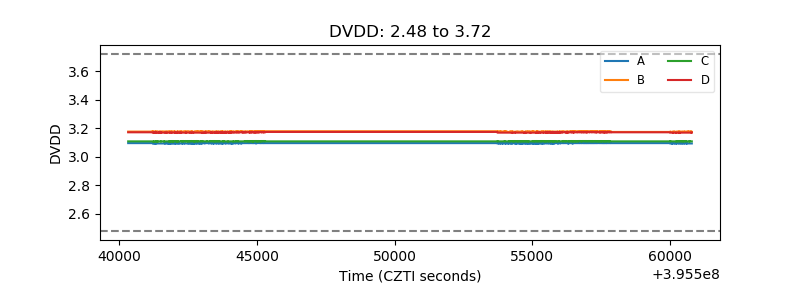 |
| Temperature 1 | 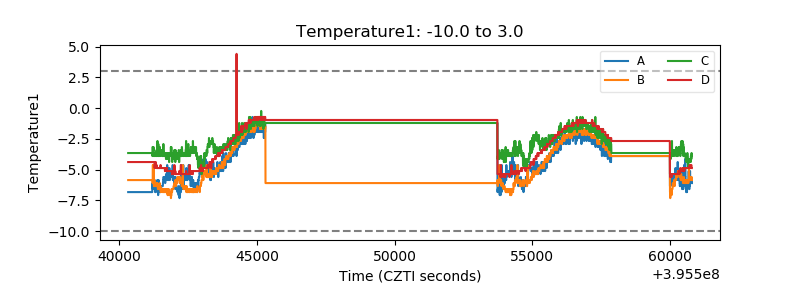 |
| Veto HV Monitor |  |
| Veto LLD | 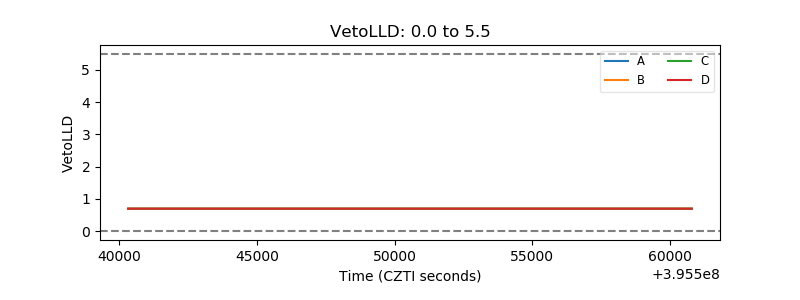 |
| Alpha Counter | 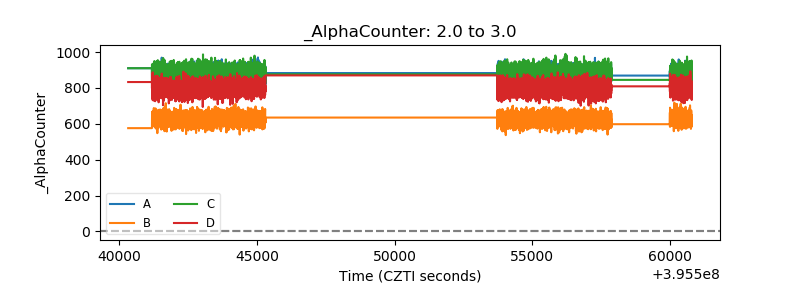 |
| _CPM_Rate | 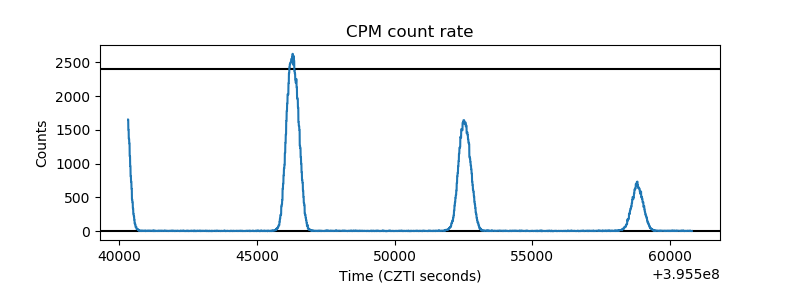 |
| CZT Counter | 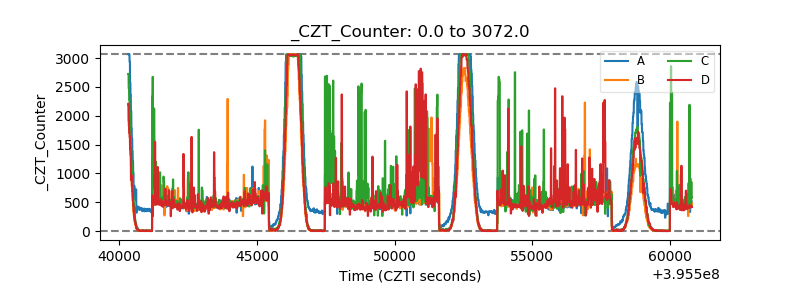 |
| +2.5 Volts monitor |  |
| +5 Volts monitor |  |
| _ROLL_ROT | 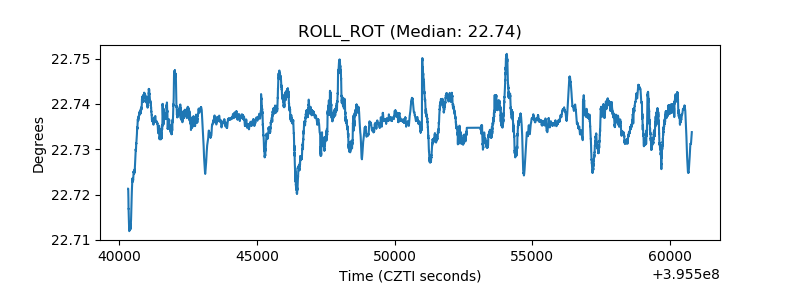 |
| _Roll_DEC | 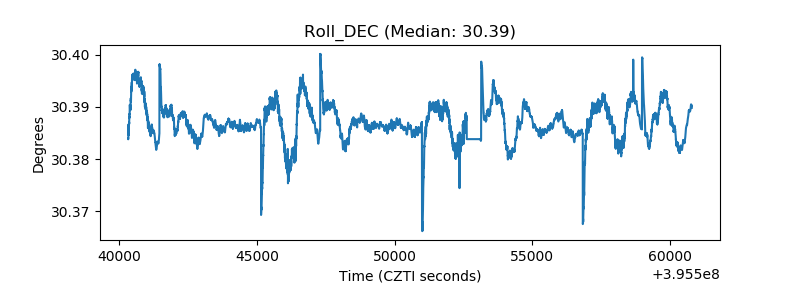 |
| _Roll_RA | 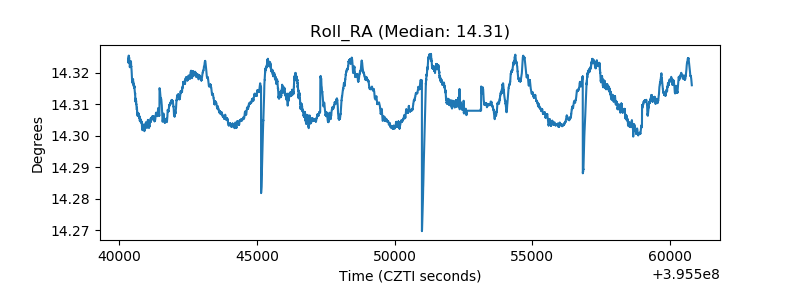 |
| Veto Counter | 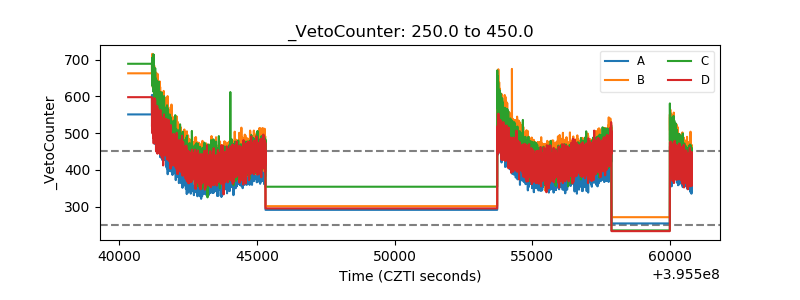 |