| Param | Original file | Final file |
|---|---|---|
| Filename | modeM0/AS1A11_101T01_9000005238_36741cztM0_level2.evt | modeM0/AS1A11_101T01_9000005238_36741cztM0_level2_quad_clean.evt |
| Size (bytes) | 1,339,626,240 | 216,544,320 |
| Size | 1.2 GB | 206.5 MB |
| Events in quadrant A | 8,677,863 | 1,351,594 |
| Events in quadrant B | 9,349,346 | 1,403,577 |
| Events in quadrant C | 11,038,618 | 1,311,307 |
| Events in quadrant D | 10,315,013 | 1,277,477 |
| Mode M0 | |||
|---|---|---|---|
| Quadrant | BADHDUFLAG | Total packets | Discarded packets |
| A | 0 | 37136 | 485 |
| B | 0 | 39428 | 406 |
| C | 0 | 44407 | 742 |
| D | 0 | 43059 | 557 |
| Mode SS | |||
|---|---|---|---|
| Quadrant | BADHDUFLAG | Total packets | Discarded packets |
| A | 0 | 364 | 0 |
| B | 0 | 364 | 4 |
| C | 0 | 364 | 2 |
| D | 0 | 364 | 2 |
| Mode M9 | |||
|---|---|---|---|
| Quadrant | BADHDUFLAG | Total packets | Discarded packets |
| A | 0 | 91 | 9 |
| B | 0 | 91 | 6 |
| C | 0 | 91 | 7 |
| D | 0 | 92 | 9 |
| Quadrant | Total seconds | Saturated seconds | Saturation percentage |
|---|---|---|---|
| A | 17604 | 28 | 0.159055% |
| B | 17638 | 366 | 2.075065% |
| C | 17602 | 578 | 3.283718% |
| D | 17600 | 425 | 2.414773% |
Noise dominated data is calculated using 1-second bins in cleaned event files. If a bin has >2000 counts, and if more than 50% of those come from <1% of pixels, then it is considered to be noise-dominated and hence unusable.
| Quadrant | # 1 sec bins | Bins with >0 counts | Bins with >2000 counts | High rate bins dominated by noise | Noise dominated (total time) | Noise dominated (detector-on time) | Marked lightcurve |
|---|---|---|---|---|---|---|---|
| A | 26104 | 17732 | 9 | 9 | 0.03% | 0.05% | 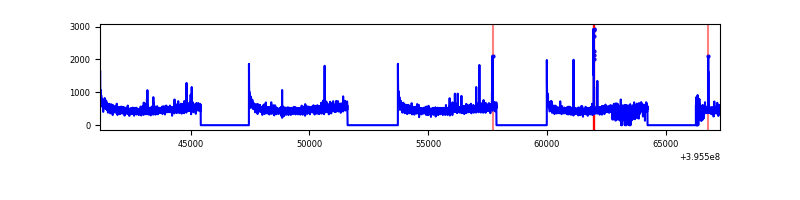 |
| B | 26104 | 17754 | 131 | 131 | 0.50% | 0.74% | 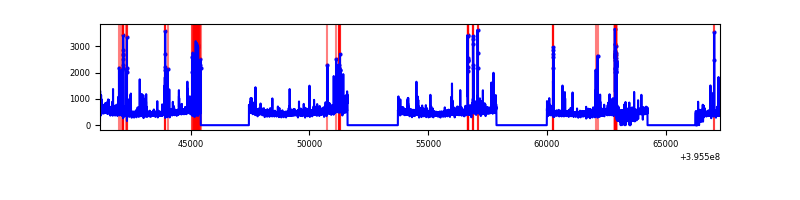 |
| C | 26104 | 17710 | 465 | 465 | 1.78% | 2.63% | 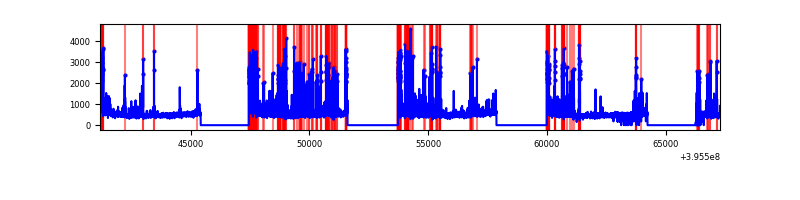 |
| D | 26104 | 17743 | 356 | 356 | 1.36% | 2.01% | 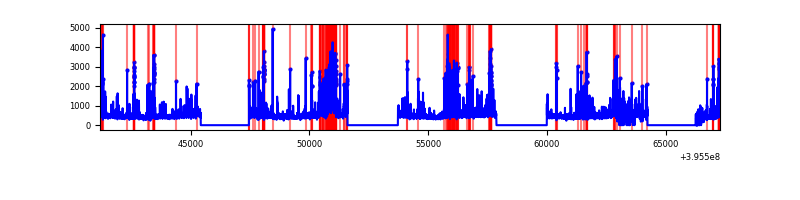 |
Top three noisy pixels from each quadrant. If the there are fewer than three noisy pixels in the level2.evt file, extra rows are filled as -1
| Pixel properties | Quadrant properties | ||||||
|---|---|---|---|---|---|---|---|
| Quadrant | DetID | PixID | Counts | Sigma | Mean | Median | Sigma |
| A | 10 | 83 | 596325 | 1452.47 | 2067 | 2033 | 409.2 |
| A | 9 | 143 | 64318 | 152.23 | 2067 | 2033 | 409.2 |
| A | 13 | 254 | 28277 | 64.14 | 2067 | 2033 | 409.2 |
| B | 5 | 200 | 590488 | 1543.44 | 2048 | 1998 | 381.3 |
| B | 0 | 213 | 160303 | 415.19 | 2048 | 1998 | 381.3 |
| B | 5 | 255 | 129738 | 335.02 | 2048 | 1998 | 381.3 |
| C | 14 | 254 | 1479307 | 3265.55 | 1964 | 1978 | 452.4 |
| C | 0 | 10 | 1124224 | 2480.66 | 1964 | 1978 | 452.4 |
| C | 15 | 214 | 720523 | 1588.3 | 1964 | 1978 | 452.4 |
| D | 12 | 227 | 1039400 | 2186.86 | 1978 | 1933 | 474.4 |
| D | 2 | 250 | 339666 | 711.9 | 1978 | 1933 | 474.4 |
| D | 13 | 249 | 325105 | 681.21 | 1978 | 1933 | 474.4 |
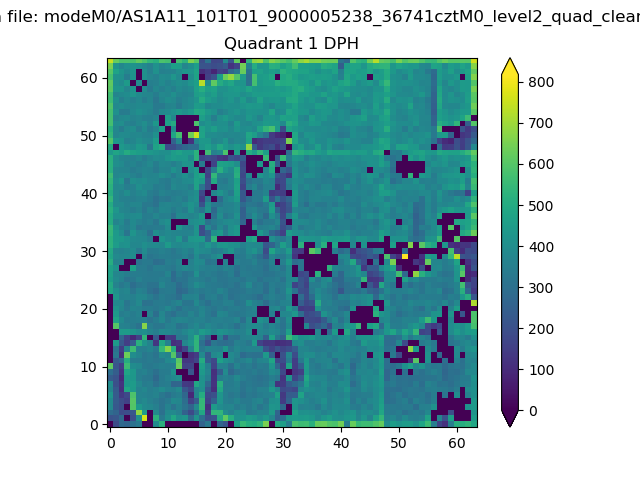
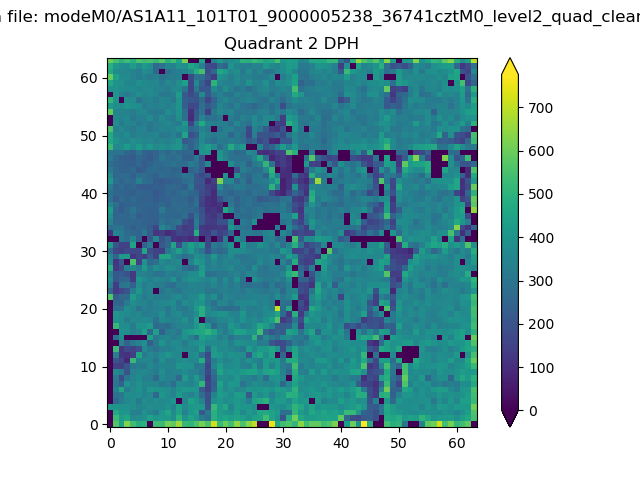
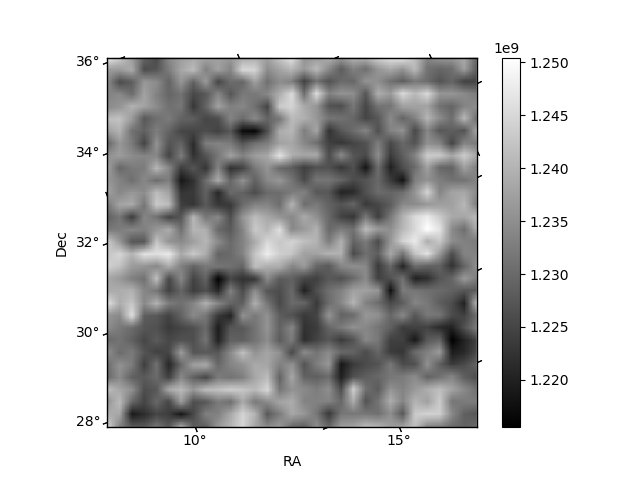
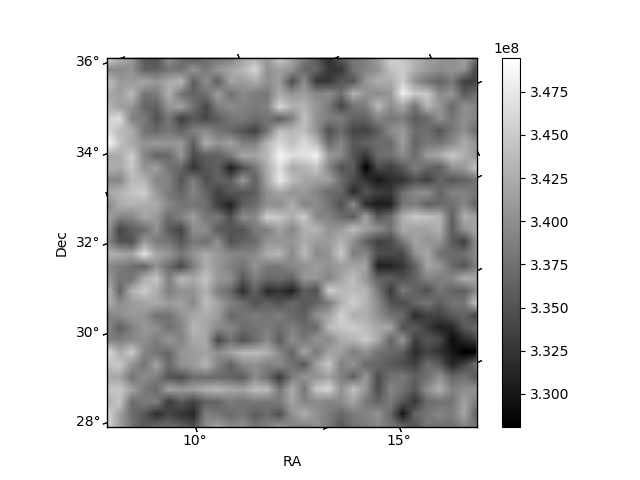
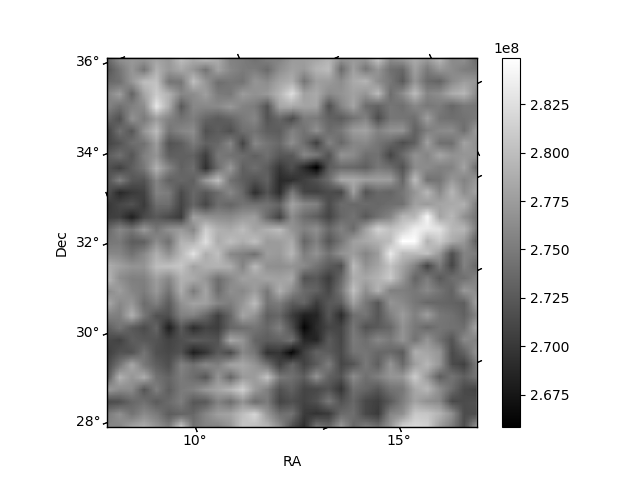
Histogram calculated using DETX and DETY for each event in the final _common_clean file
| Quadrant A |  |
 |
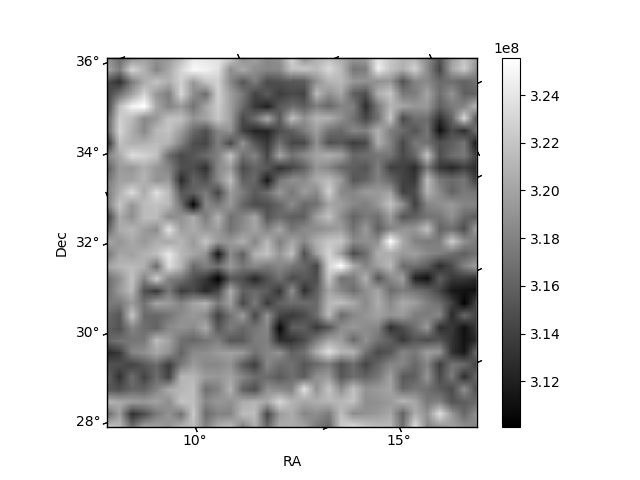
Quadrant B |
|---|---|---|---|
| Quadrant D | 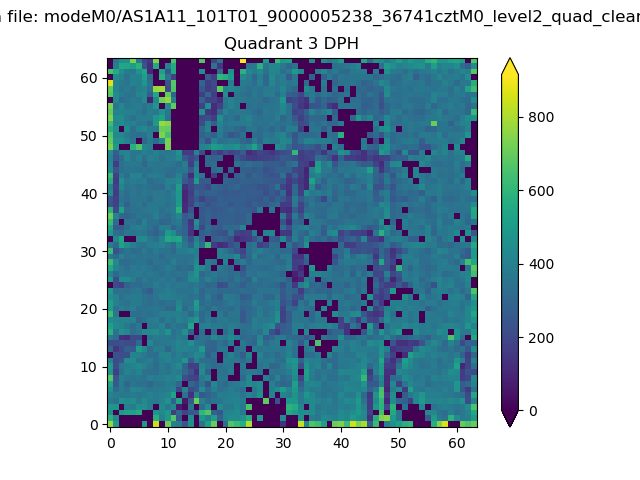 |
 |
Quadrant C |
| Plot type | Count rate plots | Images |
|---|---|---|
| Comparison with Poisson distribution Blue bars denote a histogram of data divided into 1 sec bins. Red curve is a Poisson curve with rate = median count rate of data. |
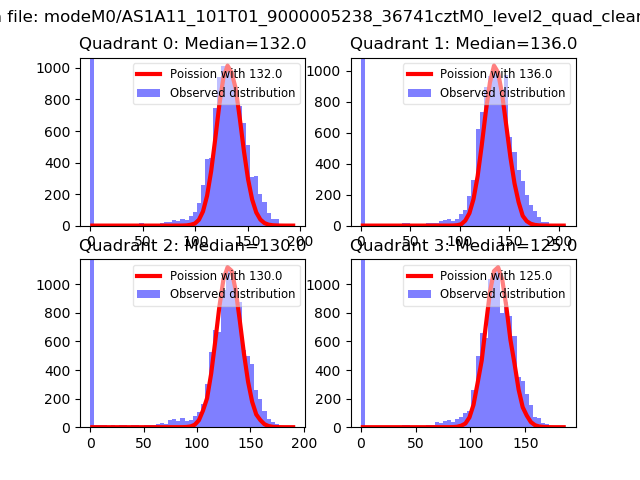 |
 |
| Quadrant-wise count rates Data is divided into 100 sec bins |
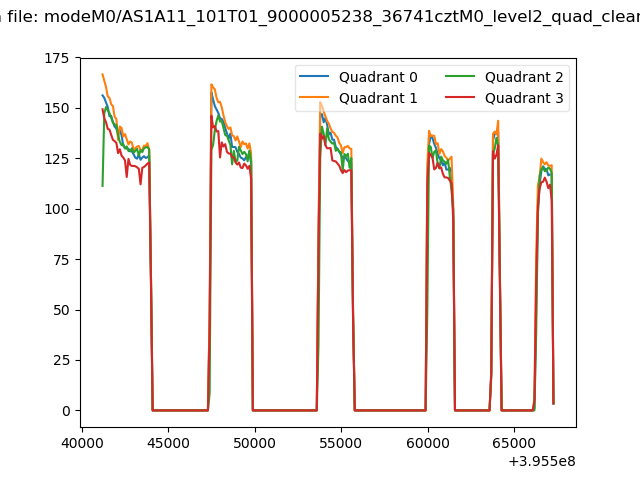 |
|
| Module-wise count rates for Quadrant A Data is divided into 100 sec bins |
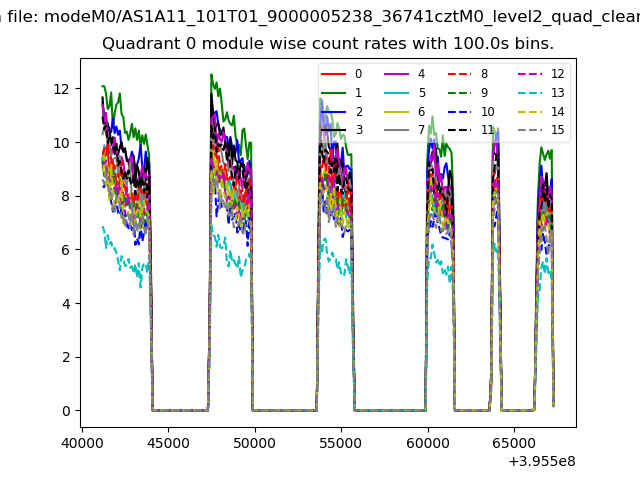 |
 |
| Module-wise count rates for Quadrant B Data is divided into 100 sec bins |
 |
 |
| Module-wise count rates for Quadrant C Data is divided into 100 sec bins |
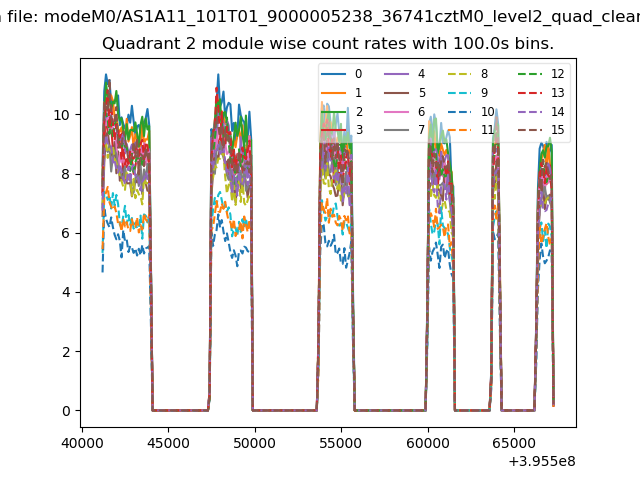 |
 |
| Module-wise count rates for Quadrant D Data is divided into 100 sec bins |
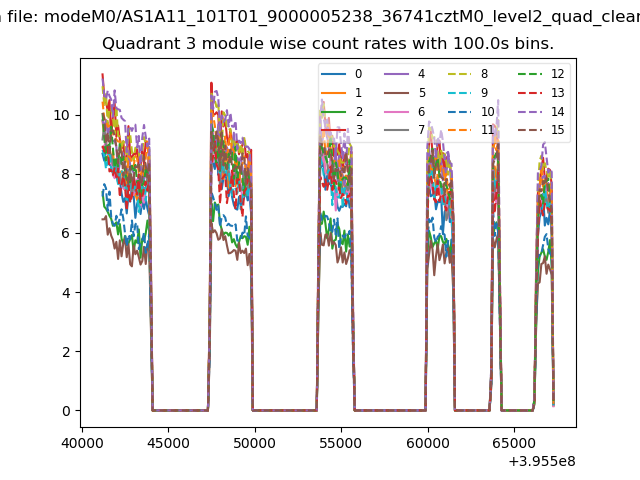 |
 |
| Parameter | Plot |
|---|---|
| CZT HV Monitor | 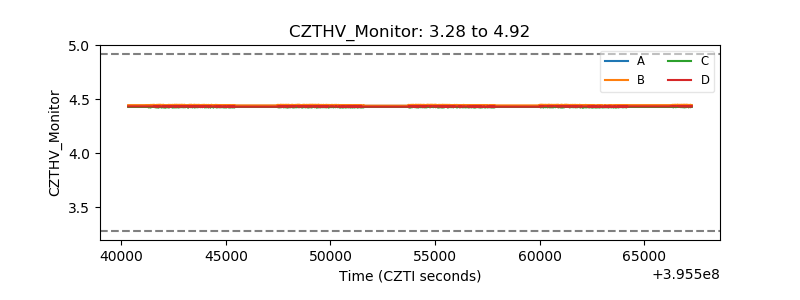 |
| D_VDD | 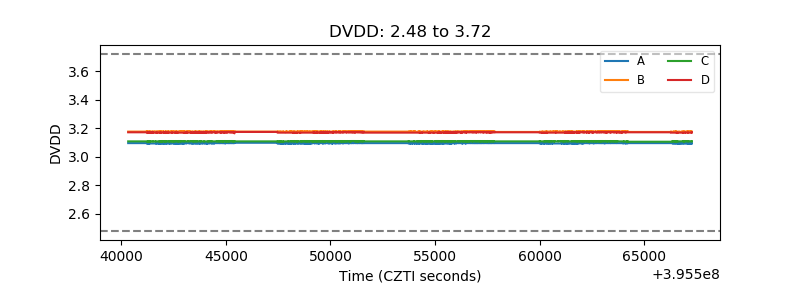 |
| Temperature 1 | 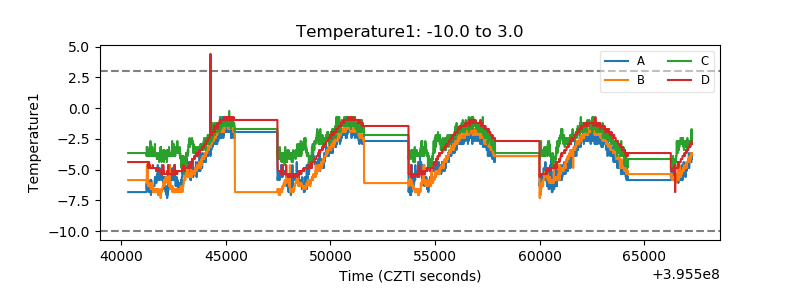 |
| Veto HV Monitor | 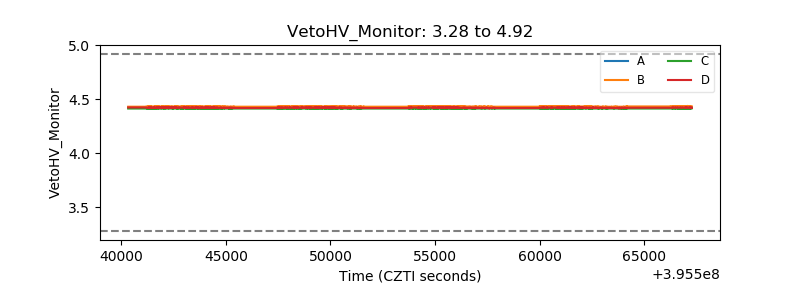 |
| Veto LLD | 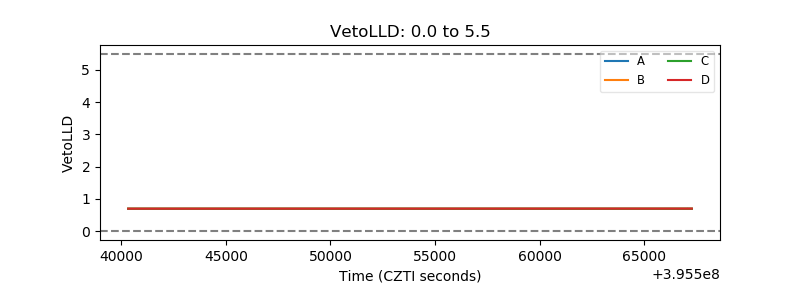 |
| Alpha Counter | 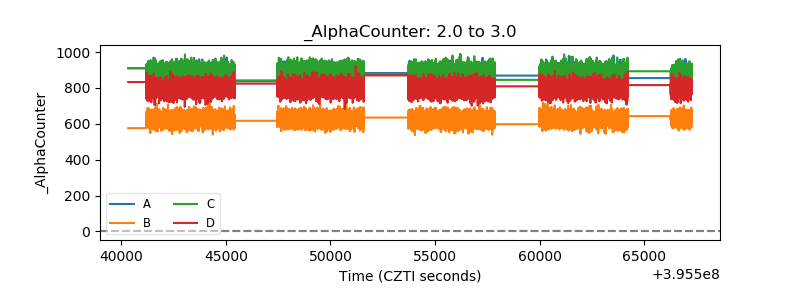 |
| _CPM_Rate | 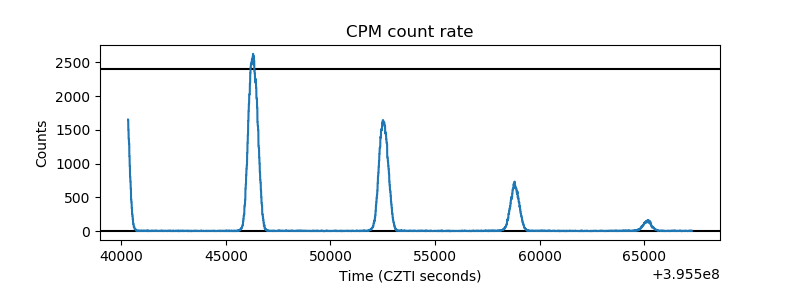 |
| CZT Counter | 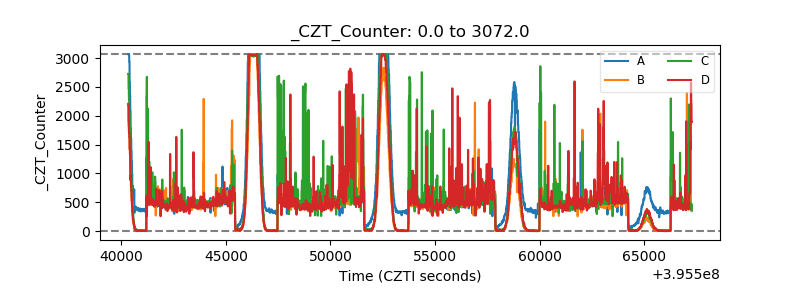 |
| +2.5 Volts monitor | 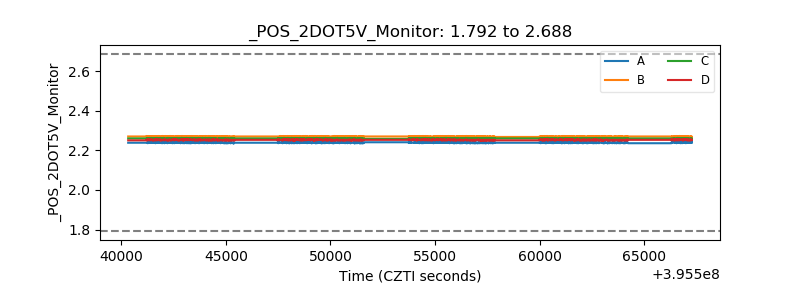 |
| +5 Volts monitor | 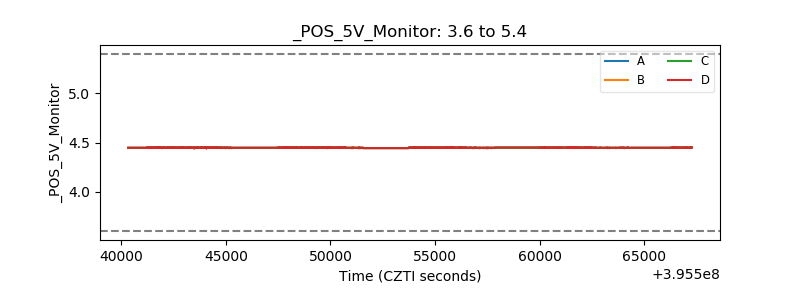 |
| _ROLL_ROT | 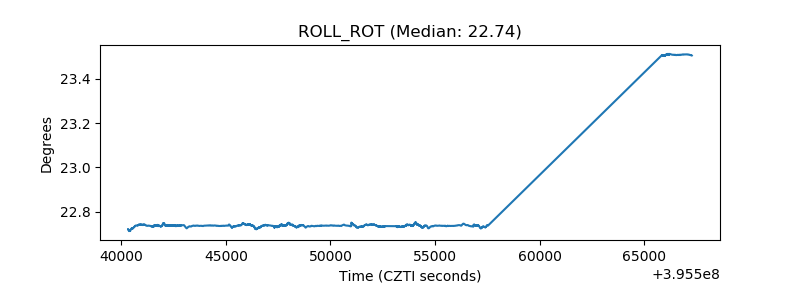 |
| _Roll_DEC | 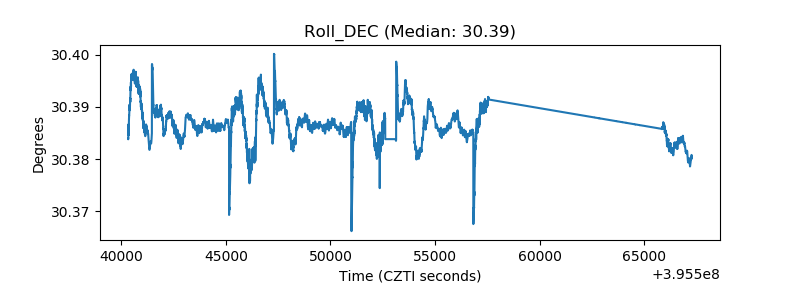 |
| _Roll_RA | 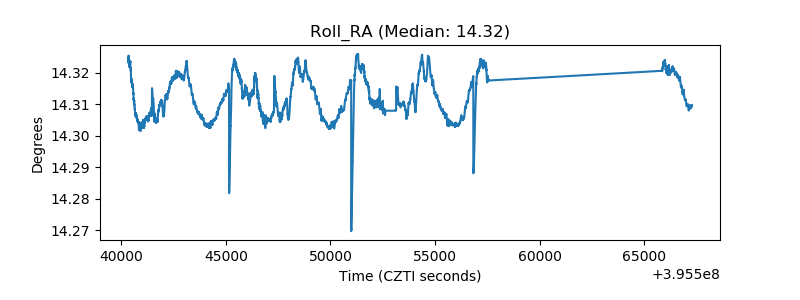 |
| Veto Counter | 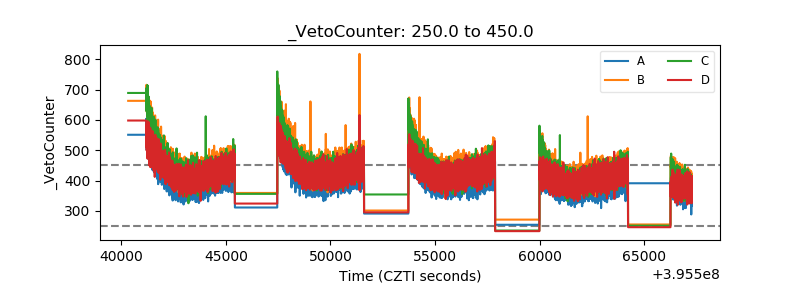 |