| Param | Original file | Final file |
|---|---|---|
| Filename | modeM0/AS1A11_101T01_9000005238_36742cztM0_level2.evt | modeM0/AS1A11_101T01_9000005238_36742cztM0_level2_quad_clean.evt |
| Size (bytes) | 1,361,525,760 | 217,782,720 |
| Size | 1.3 GB | 207.7 MB |
| Events in quadrant A | 8,777,400 | 1,359,230 |
| Events in quadrant B | 9,353,615 | 1,401,659 |
| Events in quadrant C | 11,144,206 | 1,322,269 |
| Events in quadrant D | 10,750,756 | 1,279,778 |
| Mode M0 | |||
|---|---|---|---|
| Quadrant | BADHDUFLAG | Total packets | Discarded packets |
| A | 0 | 37174 | 6 |
| B | 0 | 39182 | 5 |
| C | 0 | 44116 | 5 |
| D | 0 | 43920 | 5 |
| Mode SS | |||
|---|---|---|---|
| Quadrant | BADHDUFLAG | Total packets | Discarded packets |
| A | 0 | 362 | 0 |
| B | 0 | 362 | 0 |
| C | 0 | 362 | 0 |
| D | 0 | 362 | 0 |
| Mode M9 | |||
|---|---|---|---|
| Quadrant | BADHDUFLAG | Total packets | Discarded packets |
| A | 0 | 72 | 0 |
| B | 0 | 72 | 0 |
| C | 0 | 72 | 0 |
| D | 0 | 73 | 0 |
| Quadrant | Total seconds | Saturated seconds | Saturation percentage |
|---|---|---|---|
| A | 17895 | 16 | 0.089410% |
| B | 17895 | 315 | 1.760268% |
| C | 17895 | 551 | 3.079072% |
| D | 17895 | 510 | 2.849958% |
Noise dominated data is calculated using 1-second bins in cleaned event files. If a bin has >2000 counts, and if more than 50% of those come from <1% of pixels, then it is considered to be noise-dominated and hence unusable.
| Quadrant | # 1 sec bins | Bins with >0 counts | Bins with >2000 counts | High rate bins dominated by noise | Noise dominated (total time) | Noise dominated (detector-on time) | Marked lightcurve |
|---|---|---|---|---|---|---|---|
| A | 32496 | 17899 | 1 | 1 | 0.00% | 0.01% | 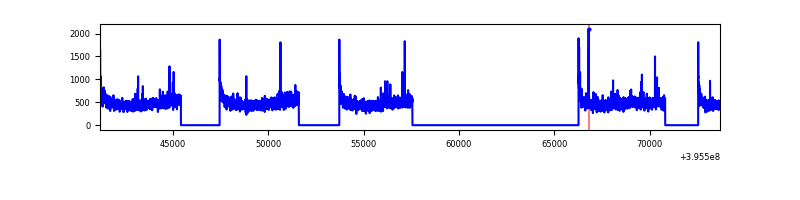 |
| B | 32496 | 17899 | 93 | 93 | 0.29% | 0.52% | 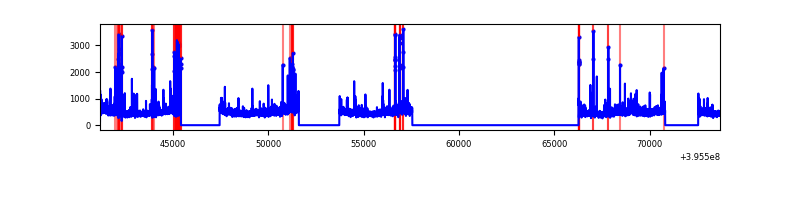 |
| C | 32496 | 17899 | 473 | 473 | 1.46% | 2.64% | 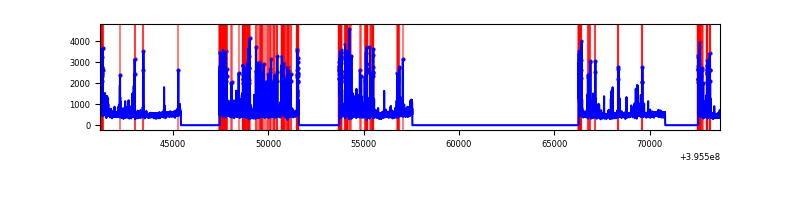 |
| D | 32496 | 17899 | 432 | 432 | 1.33% | 2.41% | 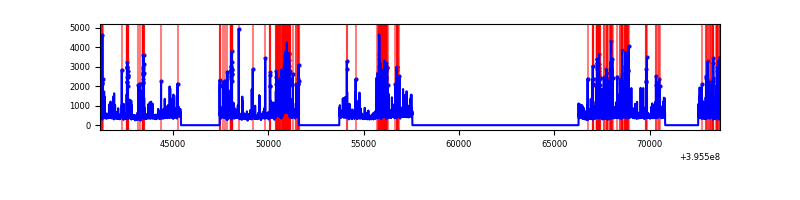 |
Top three noisy pixels from each quadrant. If the there are fewer than three noisy pixels in the level2.evt file, extra rows are filled as -1
| Pixel properties | Quadrant properties | ||||||
|---|---|---|---|---|---|---|---|
| Quadrant | DetID | PixID | Counts | Sigma | Mean | Median | Sigma |
| A | 10 | 83 | 632359 | 1524.65 | 2088 | 2051 | 413.4 |
| A | 9 | 143 | 46358 | 107.17 | 2088 | 2051 | 413.4 |
| A | 13 | 254 | 29603 | 66.65 | 2088 | 2051 | 413.4 |
| B | 5 | 200 | 497422 | 1284.76 | 2066 | 2017 | 385.6 |
| B | 0 | 213 | 193197 | 495.8 | 2066 | 2017 | 385.6 |
| B | 5 | 255 | 160000 | 409.71 | 2066 | 2017 | 385.6 |
| C | 14 | 254 | 1307923 | 2850.86 | 1988 | 2005 | 458.1 |
| C | 0 | 10 | 1231797 | 2684.68 | 1988 | 2005 | 458.1 |
| C | 15 | 214 | 737311 | 1605.2 | 1988 | 2005 | 458.1 |
| D | 12 | 227 | 905972 | 1890.71 | 1994 | 1948 | 478.1 |
| D | 13 | 171 | 497395 | 1036.2 | 1994 | 1948 | 478.1 |
| D | 13 | 249 | 404687 | 842.3 | 1994 | 1948 | 478.1 |
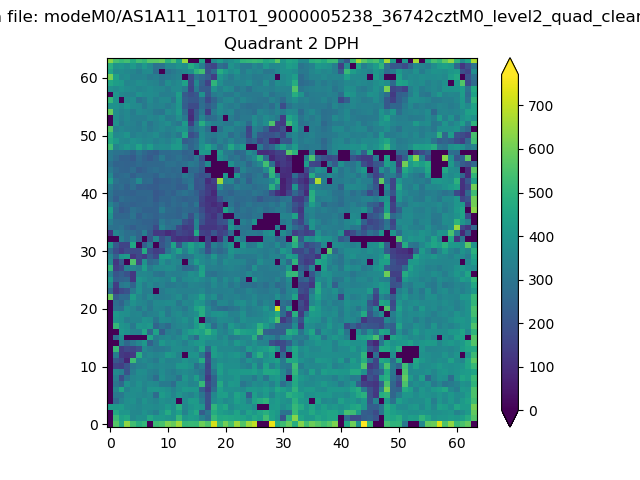
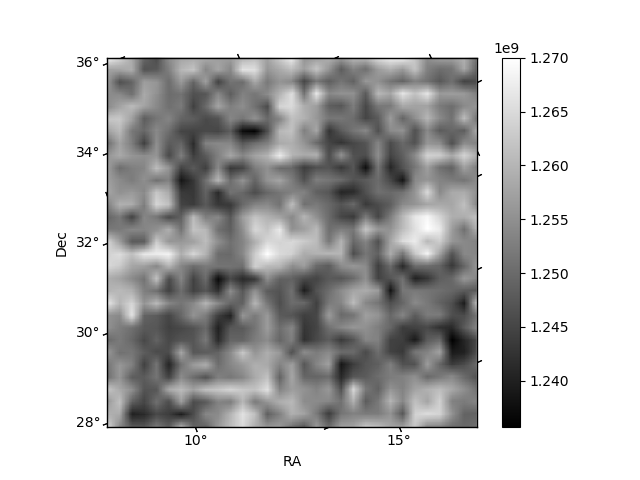
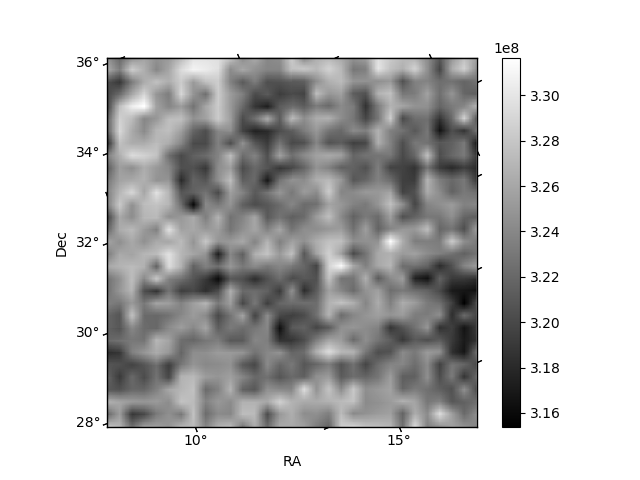
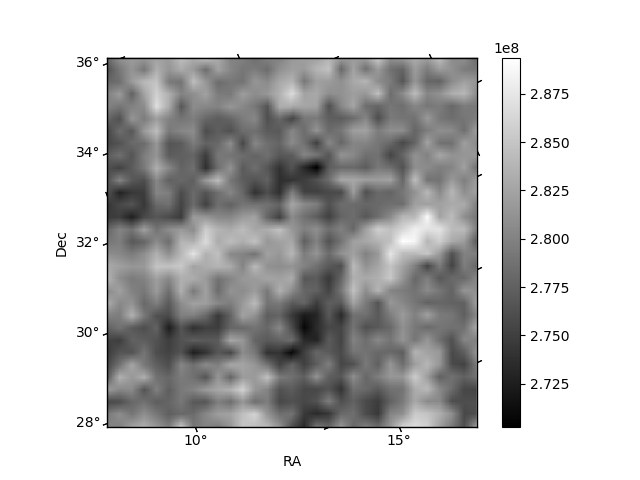
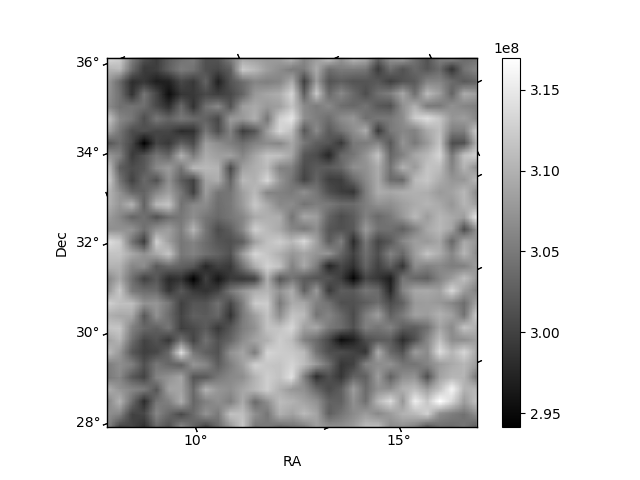
Histogram calculated using DETX and DETY for each event in the final _common_clean file
| Quadrant A | 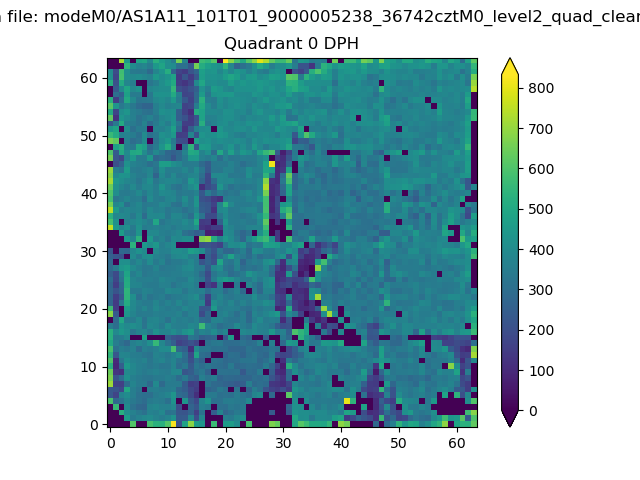 |
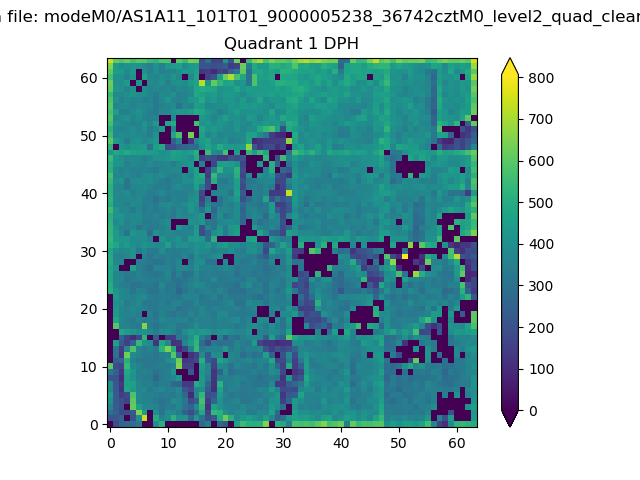 |
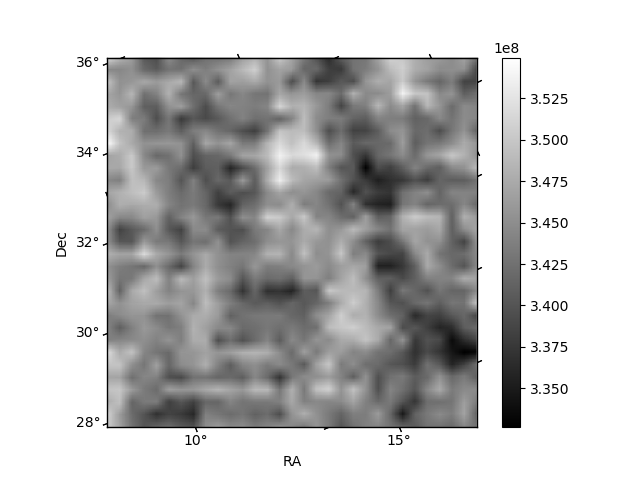
Quadrant B |
|---|---|---|---|
| Quadrant D | 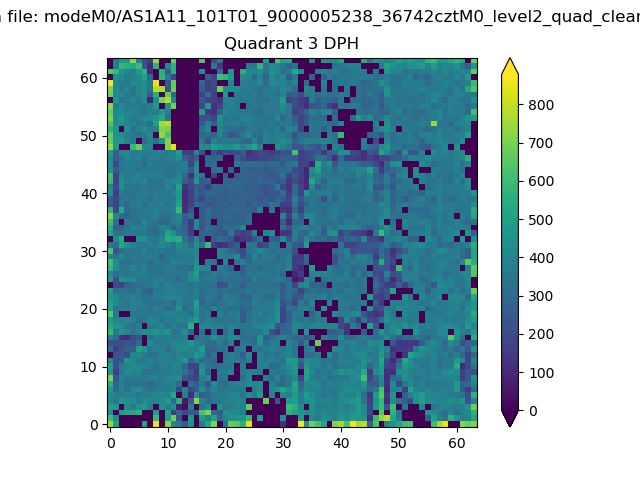 |
 |
Quadrant C |
| Plot type | Count rate plots | Images |
|---|---|---|
| Comparison with Poisson distribution Blue bars denote a histogram of data divided into 1 sec bins. Red curve is a Poisson curve with rate = median count rate of data. |
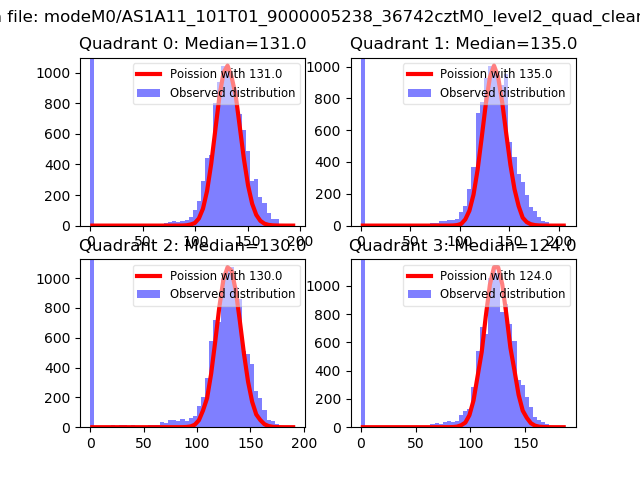 |
 |
| Quadrant-wise count rates Data is divided into 100 sec bins |
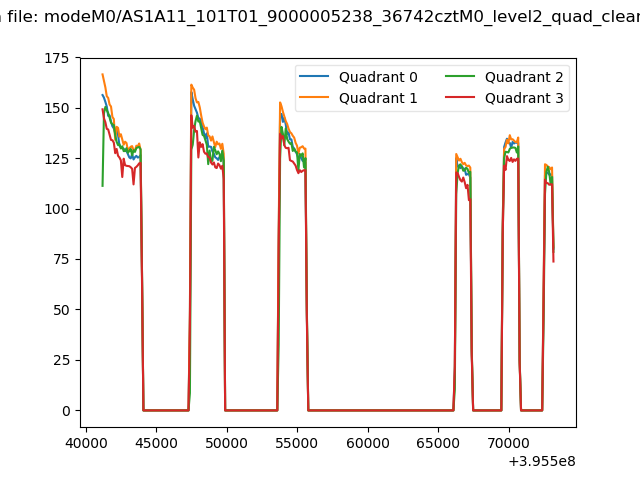 |
|
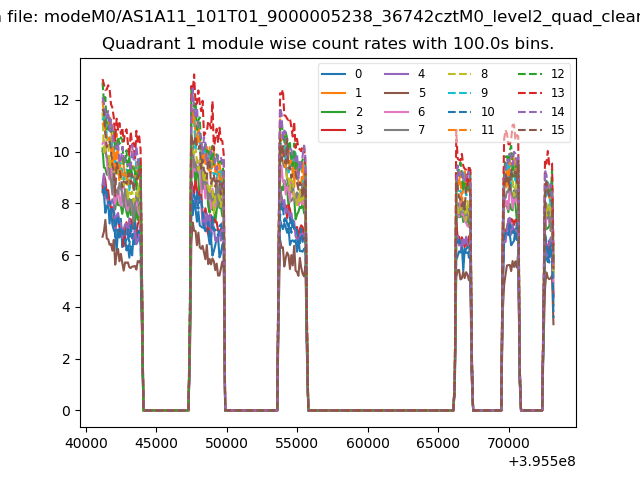
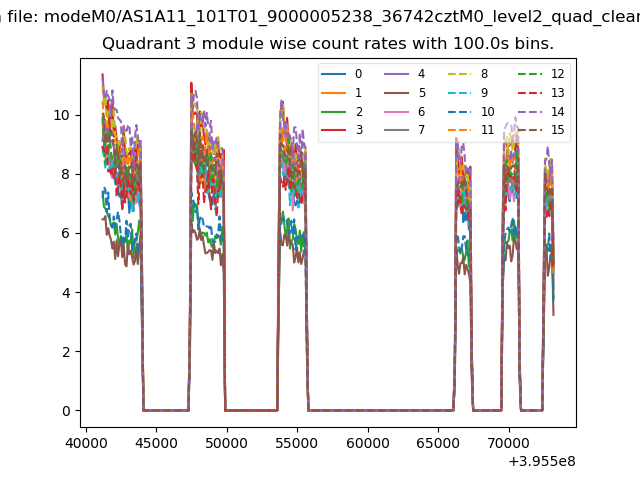
| Module-wise count rates for Quadrant A Data is divided into 100 sec bins |
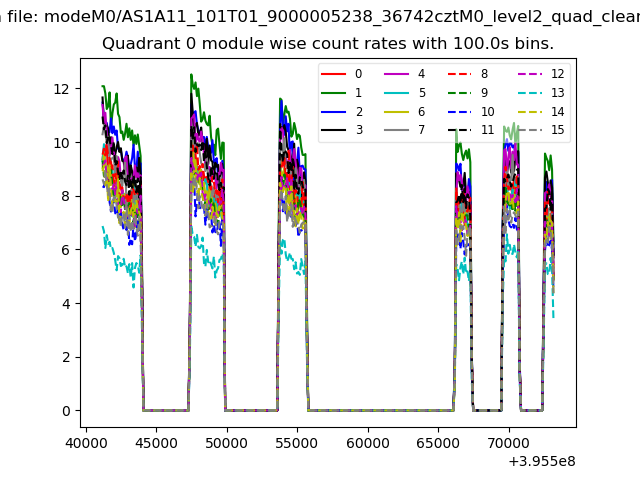 |
 |
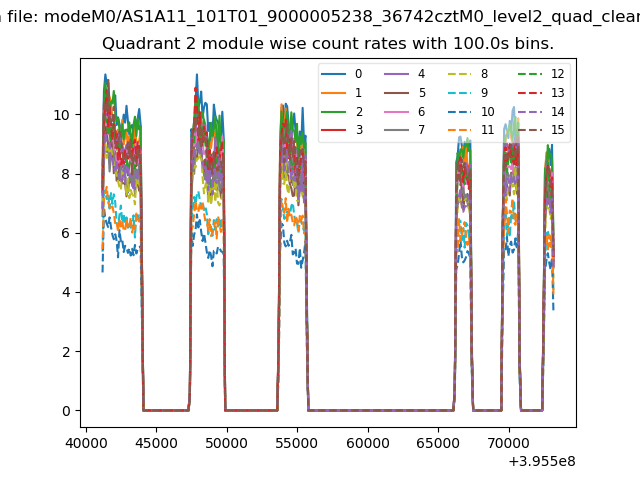
| Module-wise count rates for Quadrant B Data is divided into 100 sec bins |
 |
 |
| Module-wise count rates for Quadrant C Data is divided into 100 sec bins |
 |
 |
| Module-wise count rates for Quadrant D Data is divided into 100 sec bins |
 |
 |
| Parameter | Plot |
|---|---|
| CZT HV Monitor | 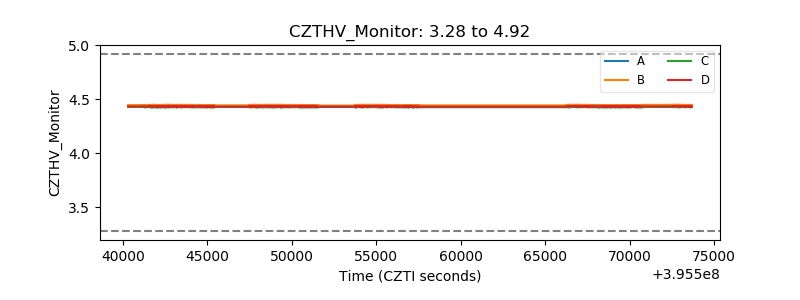 |
| D_VDD | 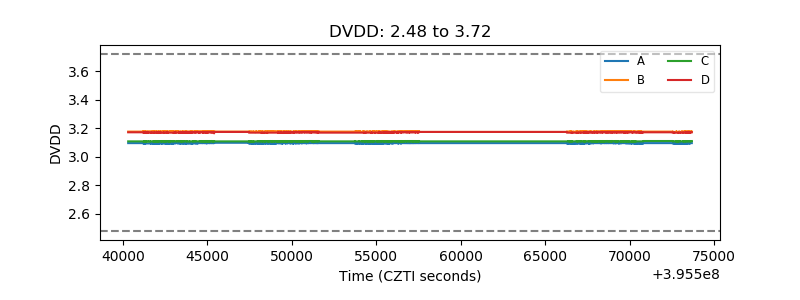 |
| Temperature 1 | 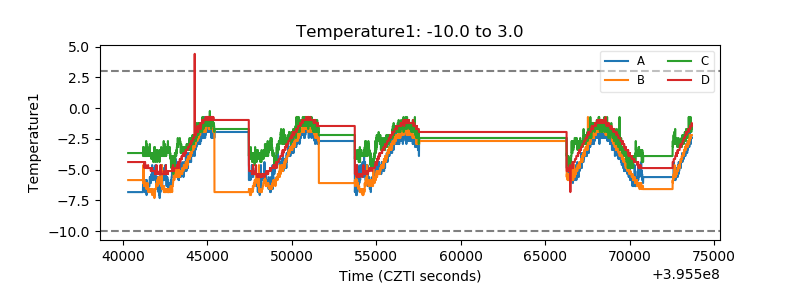 |
| Veto HV Monitor | 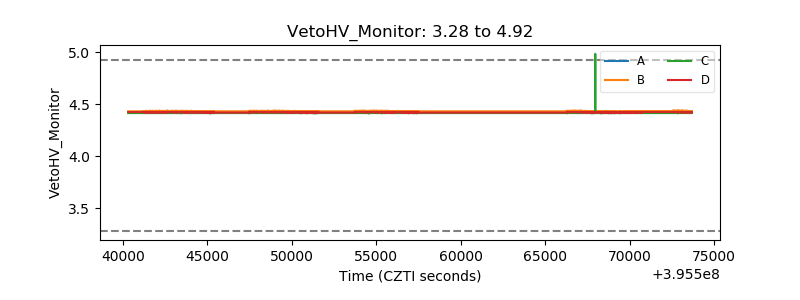 |
| Veto LLD | 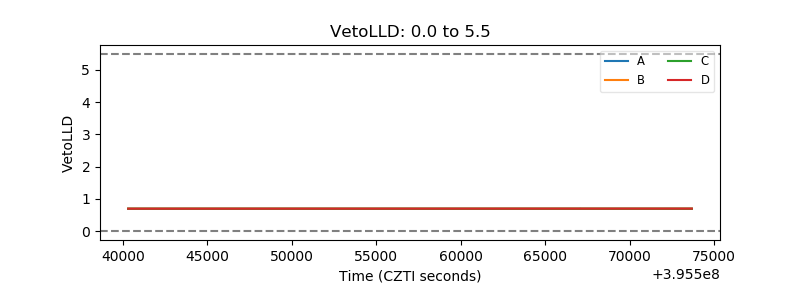 |
| Alpha Counter | 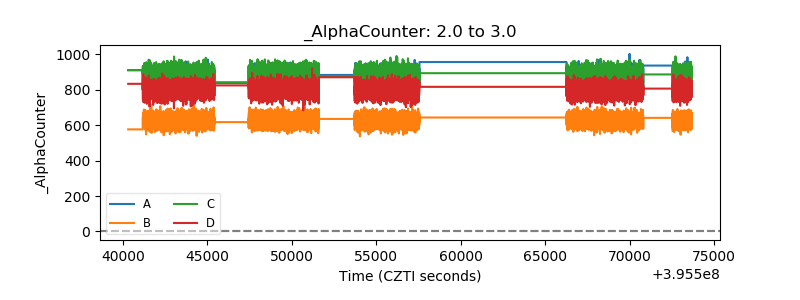 |
| _CPM_Rate | 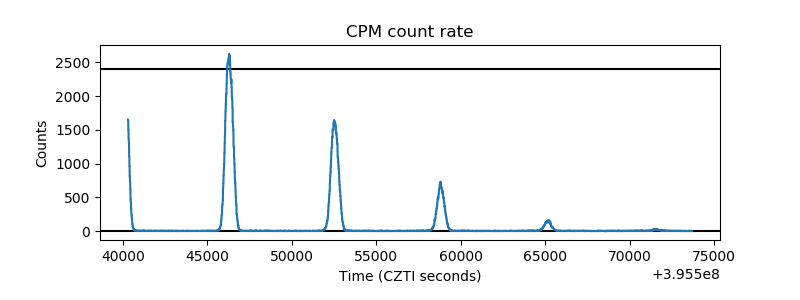 |
| CZT Counter | 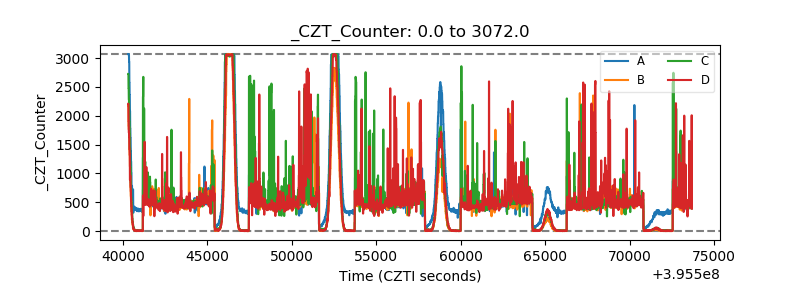 |
| +2.5 Volts monitor |  |
| +5 Volts monitor |  |
| _ROLL_ROT | 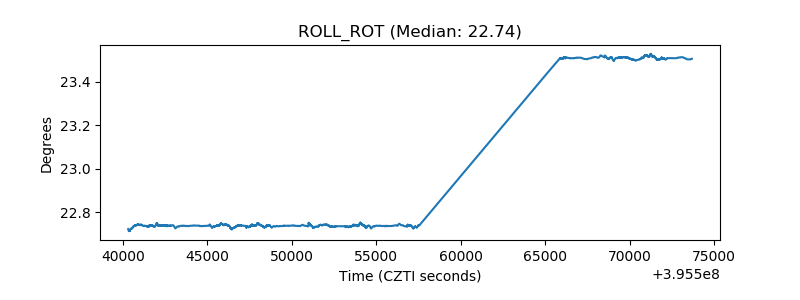 |
| _Roll_DEC | 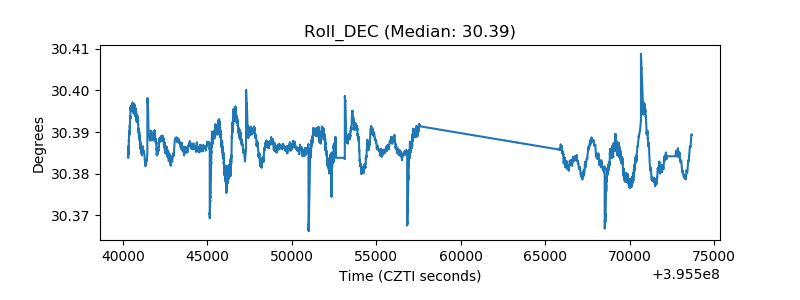 |
| _Roll_RA | 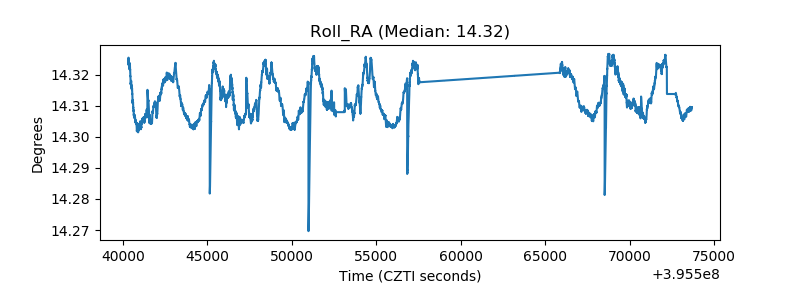 |
| Veto Counter | 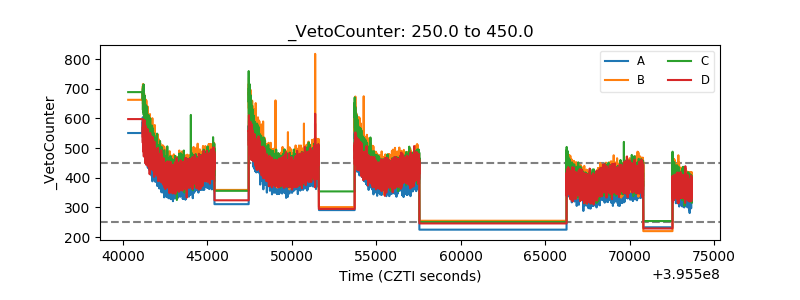 |