| Param | Original file | Final file |
|---|---|---|
| Filename | modeM0/AS1A11_101T01_9000005238_36743cztM0_level2.evt | modeM0/AS1A11_101T01_9000005238_36743cztM0_level2_quad_clean.evt |
| Size (bytes) | 458,677,440 | 57,510,720 |
| Size | 437.4 MB | 54.8 MB |
| Events in quadrant A | 2,716,117 | 342,809 |
| Events in quadrant B | 2,750,702 | 349,012 |
| Events in quadrant C | 3,064,278 | 334,316 |
| Events in quadrant D | 4,971,484 | 315,019 |
| Mode M0 | |||
|---|---|---|---|
| Quadrant | BADHDUFLAG | Total packets | Discarded packets |
| A | 0 | 11618 | 2 |
| B | 0 | 11803 | 1 |
| C | 0 | 12549 | 1 |
| D | 0 | 18648 | 1 |
| Mode SS | |||
|---|---|---|---|
| Quadrant | BADHDUFLAG | Total packets | Discarded packets |
| A | 0 | 118 | 0 |
| B | 0 | 118 | 0 |
| C | 0 | 118 | 0 |
| D | 0 | 118 | 0 |
| Mode M9 | |||
|---|---|---|---|
| Quadrant | BADHDUFLAG | Total packets | Discarded packets |
| A | 0 | 14 | 0 |
| B | 0 | 14 | 0 |
| C | 0 | 14 | 0 |
| D | 0 | 14 | 0 |
| Quadrant | Total seconds | Saturated seconds | Saturation percentage |
|---|---|---|---|
| A | 5712 | 3 | 0.052521% |
| B | 5712 | 14 | 0.245098% |
| C | 5712 | 91 | 1.593137% |
| D | 5712 | 681 | 11.922269% |
Noise dominated data is calculated using 1-second bins in cleaned event files. If a bin has >2000 counts, and if more than 50% of those come from <1% of pixels, then it is considered to be noise-dominated and hence unusable.
| Quadrant | # 1 sec bins | Bins with >0 counts | Bins with >2000 counts | High rate bins dominated by noise | Noise dominated (total time) | Noise dominated (detector-on time) | Marked lightcurve |
|---|---|---|---|---|---|---|---|
| A | 7145 | 5713 | 0 | 0 | 0.00% | 0.00% | 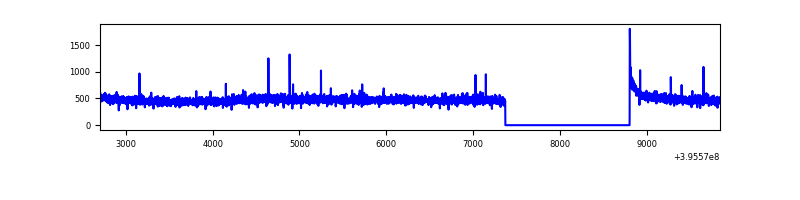 |
| B | 7145 | 5713 | 4 | 4 | 0.06% | 0.07% | 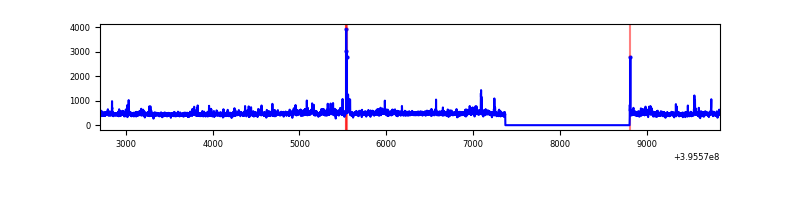 |
| C | 7145 | 5713 | 81 | 81 | 1.13% | 1.42% | 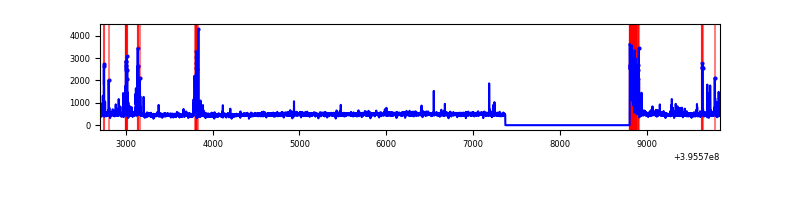 |
| D | 7145 | 5713 | 684 | 684 | 9.57% | 11.97% | 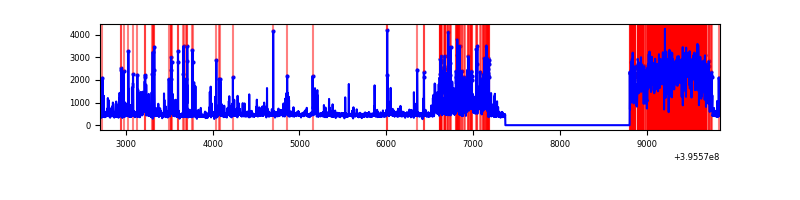 |
Top three noisy pixels from each quadrant. If the there are fewer than three noisy pixels in the level2.evt file, extra rows are filled as -1
| Pixel properties | Quadrant properties | ||||||
|---|---|---|---|---|---|---|---|
| Quadrant | DetID | PixID | Counts | Sigma | Mean | Median | Sigma |
| A | 10 | 83 | 188877 | 1426.34 | 648 | 633 | 132.0 |
| A | 9 | 143 | 12366 | 88.9 | 648 | 633 | 132.0 |
| A | 13 | 254 | 9787 | 69.36 | 648 | 633 | 132.0 |
| B | 0 | 221 | 52422 | 414.73 | 646 | 629 | 124.9 |
| B | 5 | 172 | 51598 | 408.14 | 646 | 629 | 124.9 |
| B | 0 | 213 | 43727 | 345.11 | 646 | 629 | 124.9 |
| C | 15 | 214 | 239924 | 1632.6 | 623 | 627 | 146.6 |
| C | 0 | 10 | 200779 | 1365.53 | 623 | 627 | 146.6 |
| C | 14 | 254 | 192144 | 1306.62 | 623 | 627 | 146.6 |
| D | 12 | 227 | 1693076 | 11351.84 | 608 | 591 | 149.1 |
| D | 12 | 6 | 351148 | 2351.26 | 608 | 591 | 149.1 |
| D | 13 | 171 | 193565 | 1294.32 | 608 | 591 | 149.1 |
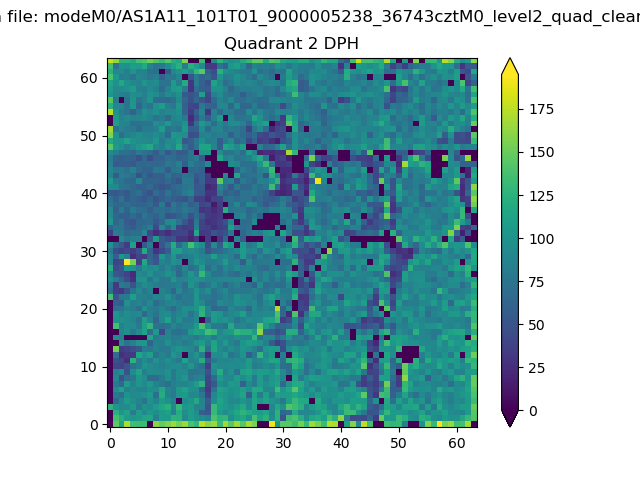
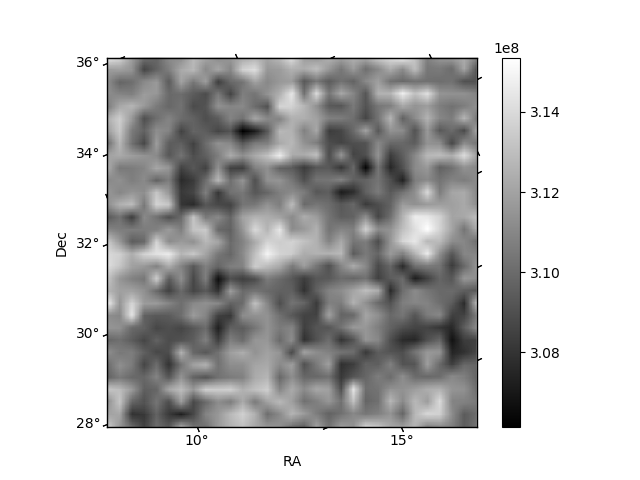
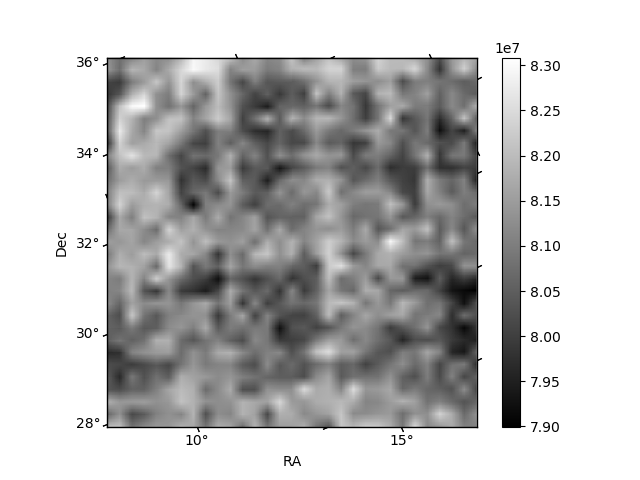
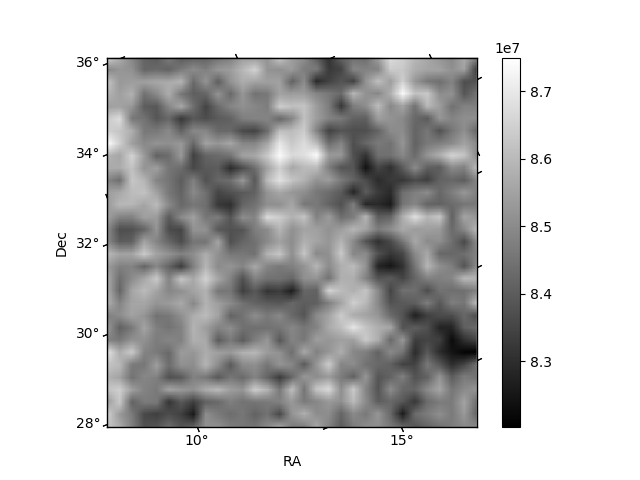
Histogram calculated using DETX and DETY for each event in the final _common_clean file
| Quadrant A | 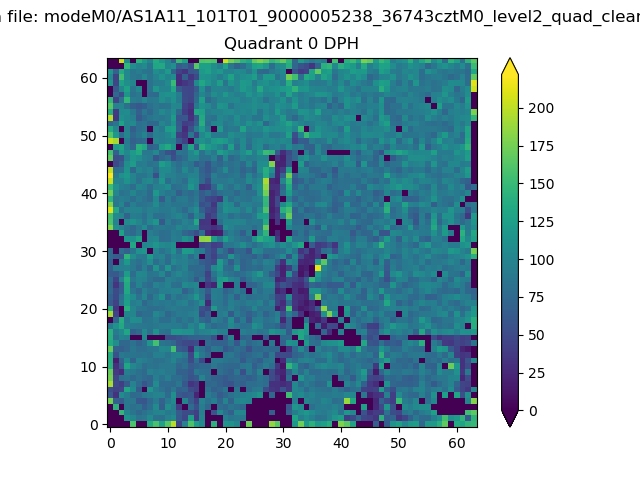 |
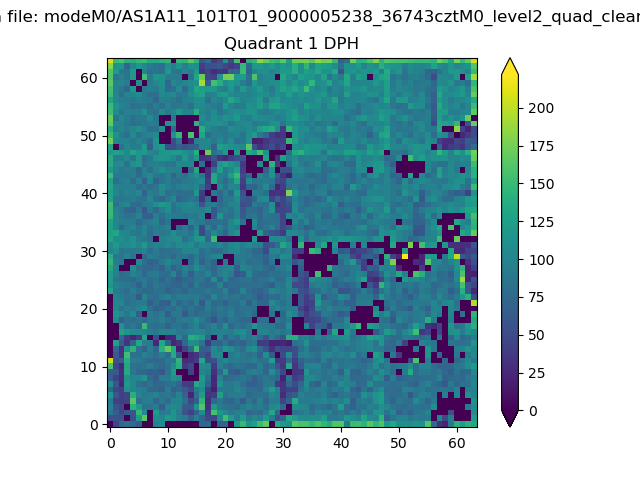 |
Quadrant B |
|---|---|---|---|
| Quadrant D | 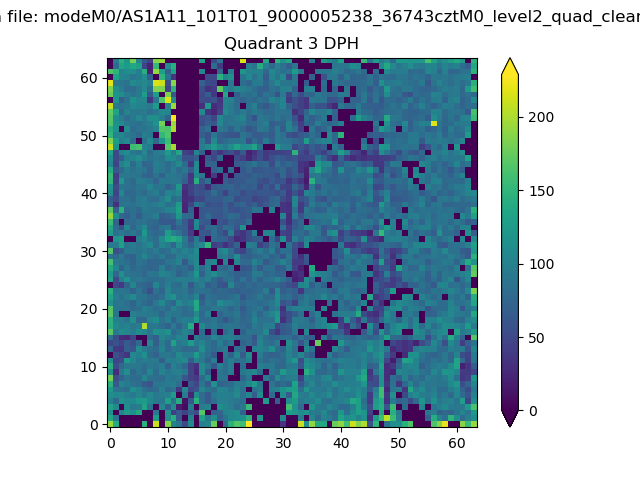 |
 |
Quadrant C |
| Plot type | Count rate plots | Images |
|---|---|---|
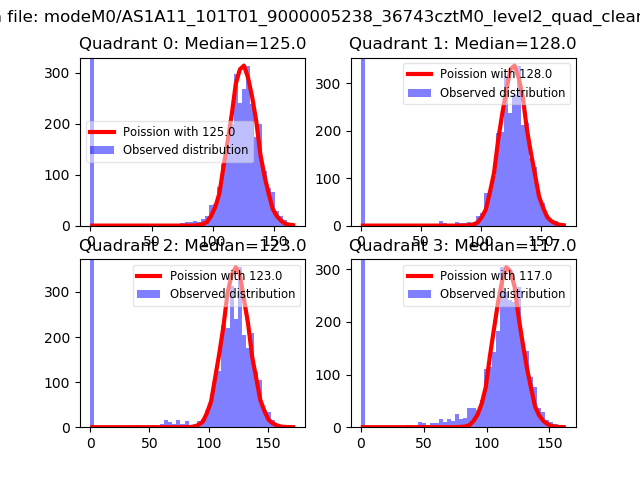
| Comparison with Poisson distribution Blue bars denote a histogram of data divided into 1 sec bins. Red curve is a Poisson curve with rate = median count rate of data. |
 |
 |
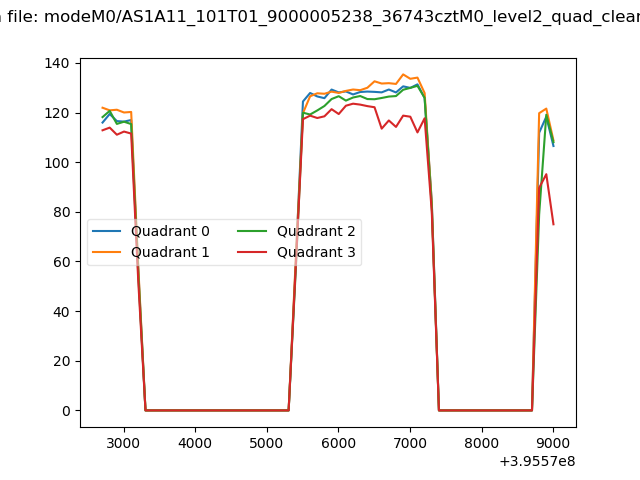
| Quadrant-wise count rates Data is divided into 100 sec bins |
 |
|
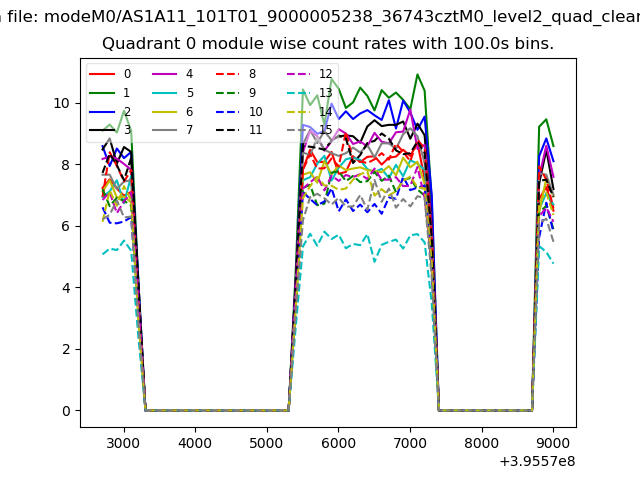
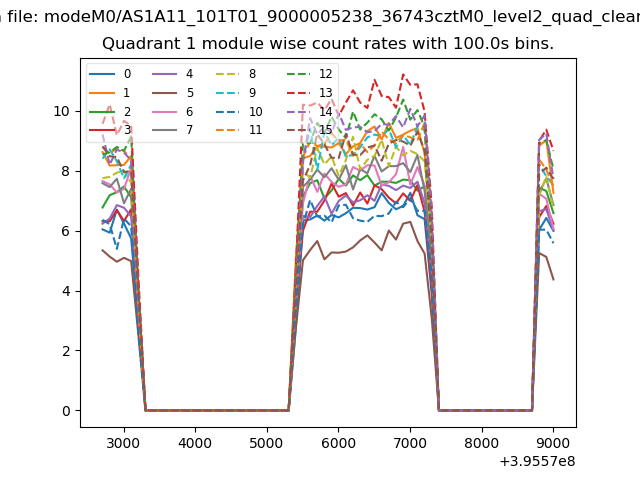
| Module-wise count rates for Quadrant A Data is divided into 100 sec bins |
 |
 |
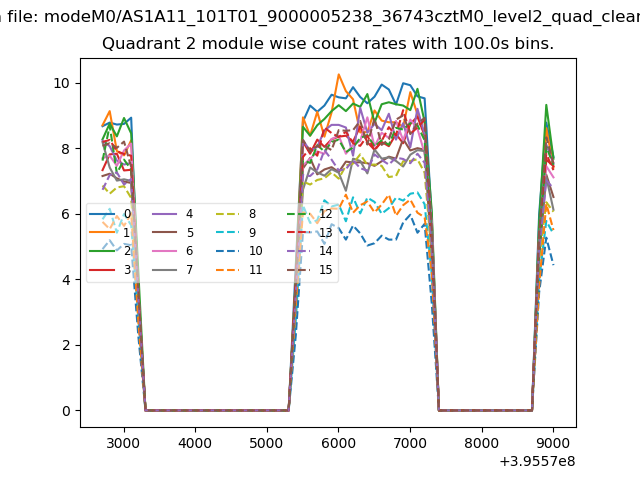
| Module-wise count rates for Quadrant B Data is divided into 100 sec bins |
 |
 |
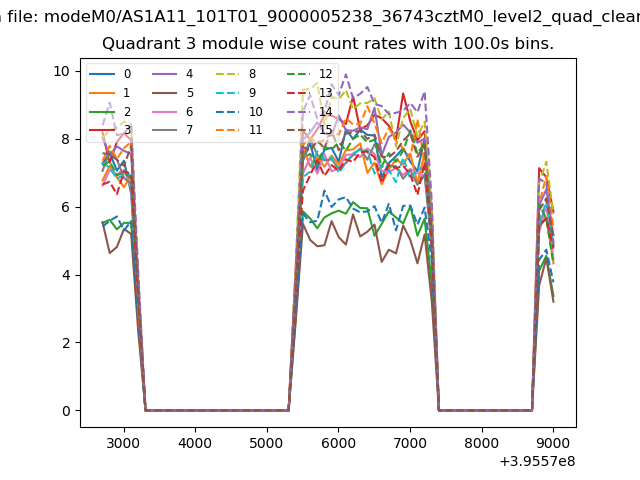
| Module-wise count rates for Quadrant C Data is divided into 100 sec bins |
 |
 |
| Module-wise count rates for Quadrant D Data is divided into 100 sec bins |
 |
 |
| Parameter | Plot |
|---|---|
| CZT HV Monitor | 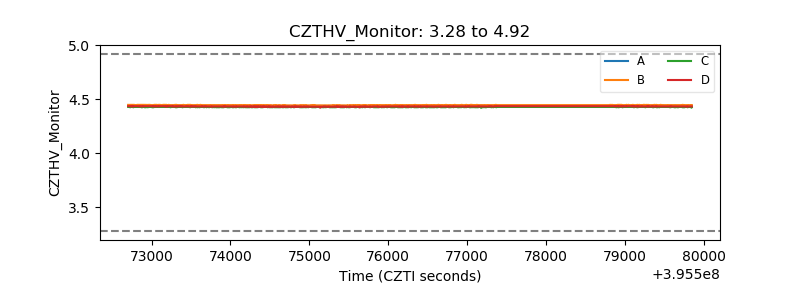 |
| D_VDD | 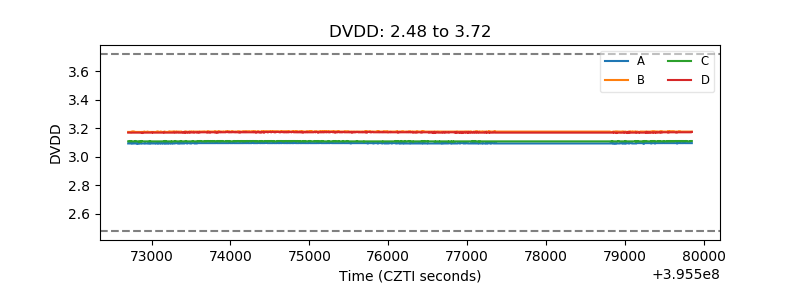 |
| Temperature 1 | 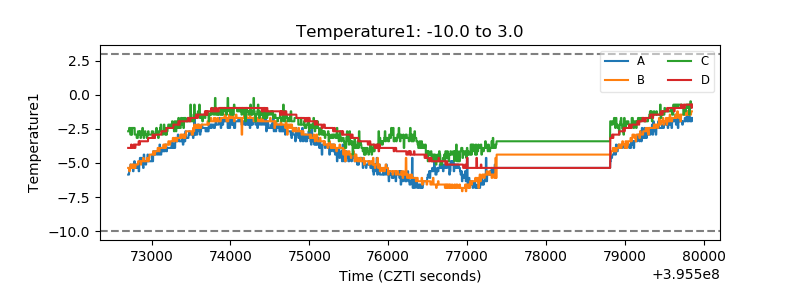 |
| Veto HV Monitor | 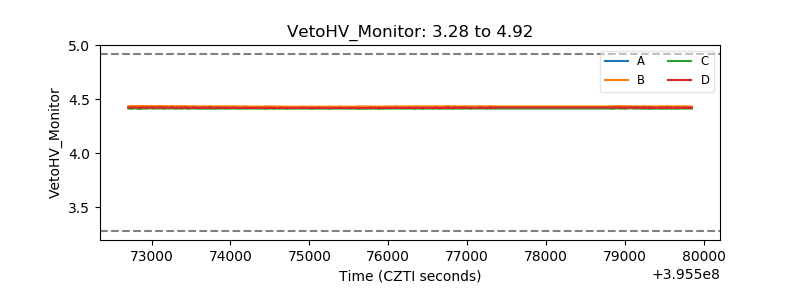 |
| Veto LLD | 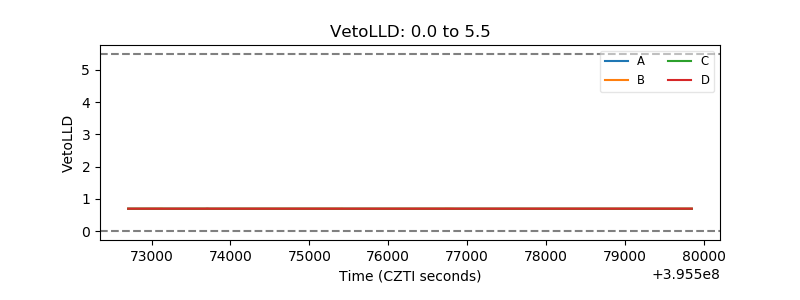 |
| Alpha Counter | 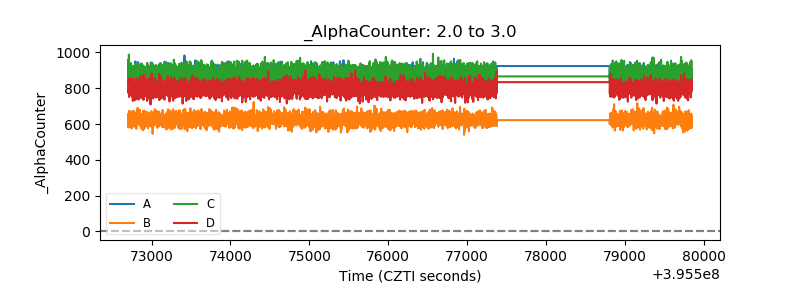 |
| _CPM_Rate | 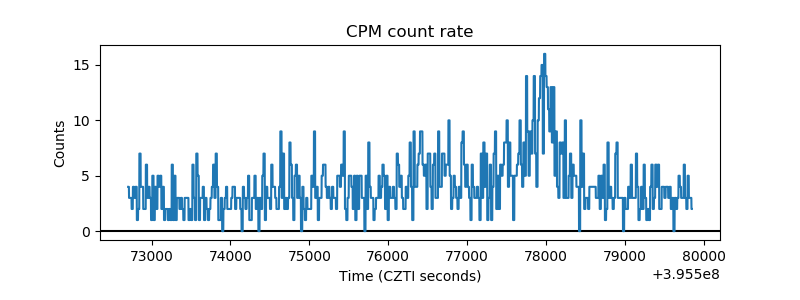 |
| CZT Counter | 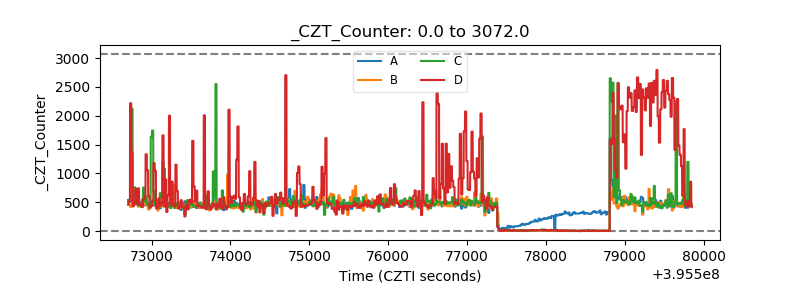 |
| +2.5 Volts monitor |  |
| +5 Volts monitor |  |
| _ROLL_ROT | 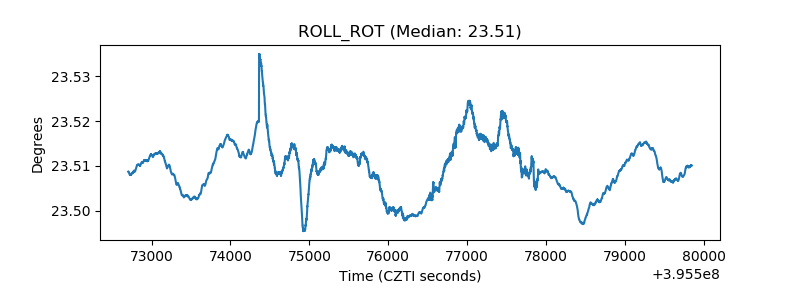 |
| _Roll_DEC | 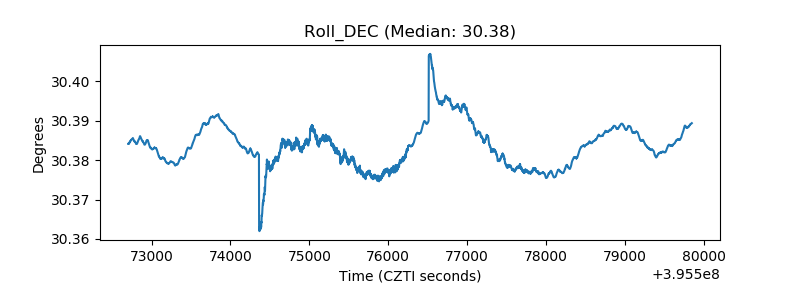 |
| _Roll_RA | 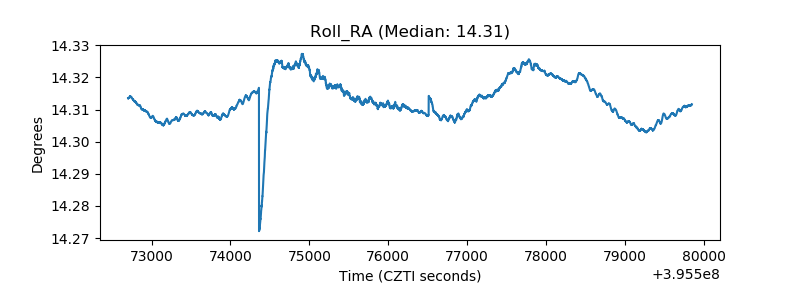 |
| Veto Counter | 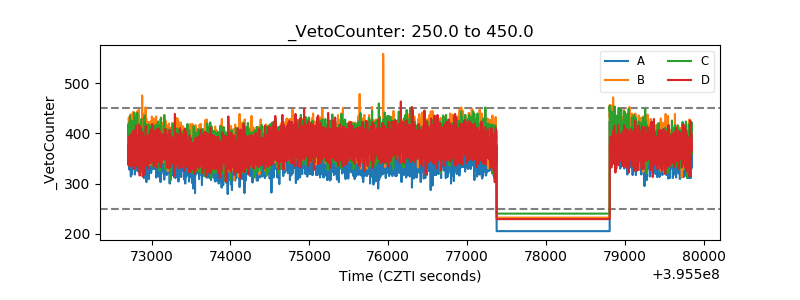 |