| Param | Original file | Final file |
|---|---|---|
| Filename | modeM0/AS1A11_101T01_9000005238_36744cztM0_level2.evt | modeM0/AS1A11_101T01_9000005238_36744cztM0_level2_quad_clean.evt |
| Size (bytes) | 625,867,200 | 56,701,440 |
| Size | 596.9 MB | 54.1 MB |
| Events in quadrant A | 2,895,180 | 342,632 |
| Events in quadrant B | 3,214,998 | 341,876 |
| Events in quadrant C | 3,311,783 | 330,842 |
| Events in quadrant D | 9,127,546 | 282,902 |
| Mode M0 | |||
|---|---|---|---|
| Quadrant | BADHDUFLAG | Total packets | Discarded packets |
| A | 0 | 12333 | 3 |
| B | 0 | 13300 | 2 |
| C | 0 | 13450 | 2 |
| D | 0 | 31266 | 2 |
| Mode SS | |||
|---|---|---|---|
| Quadrant | BADHDUFLAG | Total packets | Discarded packets |
| A | 0 | 122 | 0 |
| B | 0 | 122 | 0 |
| C | 0 | 122 | 0 |
| D | 0 | 122 | 0 |
| Mode M9 | |||
|---|---|---|---|
| Quadrant | BADHDUFLAG | Total packets | Discarded packets |
| A | 0 | 13 | 0 |
| B | 0 | 13 | 0 |
| C | 0 | 13 | 0 |
| D | 0 | 14 | 0 |
| Quadrant | Total seconds | Saturated seconds | Saturation percentage |
|---|---|---|---|
| A | 5984 | 4 | 0.066845% |
| B | 5984 | 95 | 1.587567% |
| C | 5984 | 113 | 1.888369% |
| D | 5984 | 1895 | 31.667781% |
Noise dominated data is calculated using 1-second bins in cleaned event files. If a bin has >2000 counts, and if more than 50% of those come from <1% of pixels, then it is considered to be noise-dominated and hence unusable.
| Quadrant | # 1 sec bins | Bins with >0 counts | Bins with >2000 counts | High rate bins dominated by noise | Noise dominated (total time) | Noise dominated (detector-on time) | Marked lightcurve |
|---|---|---|---|---|---|---|---|
| A | 7298 | 5985 | 0 | 0 | 0.00% | 0.00% | 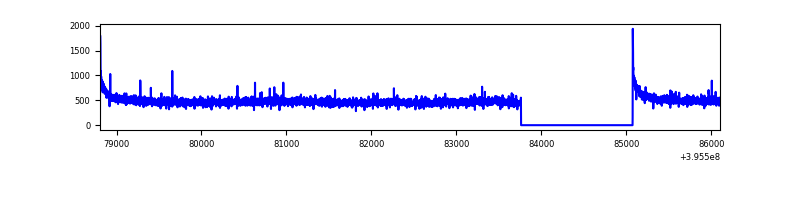 |
| B | 7298 | 5985 | 67 | 67 | 0.92% | 1.12% | 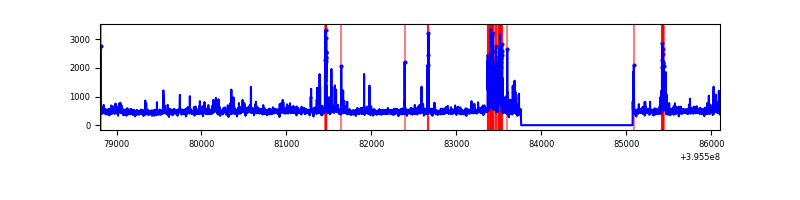 |
| C | 7298 | 5985 | 93 | 93 | 1.27% | 1.55% | 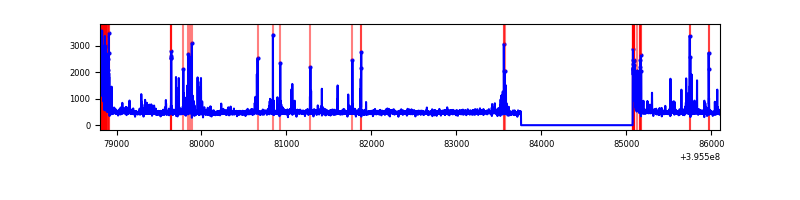 |
| D | 7298 | 5985 | 1909 | 1909 | 26.16% | 31.90% | 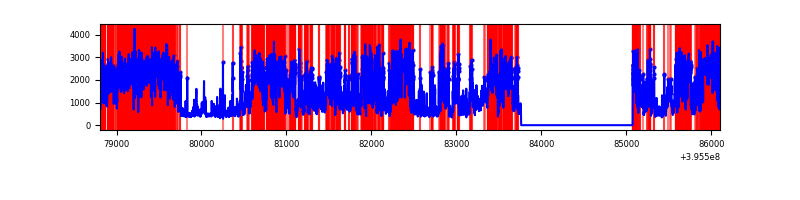 |
Top three noisy pixels from each quadrant. If the there are fewer than three noisy pixels in the level2.evt file, extra rows are filled as -1
| Pixel properties | Quadrant properties | ||||||
|---|---|---|---|---|---|---|---|
| Quadrant | DetID | PixID | Counts | Sigma | Mean | Median | Sigma |
| A | 10 | 83 | 239914 | 1716.49 | 682 | 668 | 139.4 |
| A | 13 | 6 | 11225 | 75.74 | 682 | 668 | 139.4 |
| A | 13 | 254 | 10552 | 70.91 | 682 | 668 | 139.4 |
| B | 5 | 255 | 194799 | 1492.29 | 674 | 655 | 130.1 |
| B | 0 | 213 | 120973 | 924.82 | 674 | 655 | 130.1 |
| B | 4 | 171 | 78996 | 602.17 | 674 | 655 | 130.1 |
| C | 0 | 10 | 289328 | 1875.1 | 653 | 657 | 153.9 |
| C | 15 | 214 | 254277 | 1647.43 | 653 | 657 | 153.9 |
| C | 14 | 254 | 211105 | 1367.0 | 653 | 657 | 153.9 |
| D | 12 | 227 | 6316254 | 42752.57 | 595 | 578 | 147.7 |
| D | 2 | 250 | 108802 | 732.6 | 595 | 578 | 147.7 |
| D | 13 | 249 | 93248 | 627.31 | 595 | 578 | 147.7 |
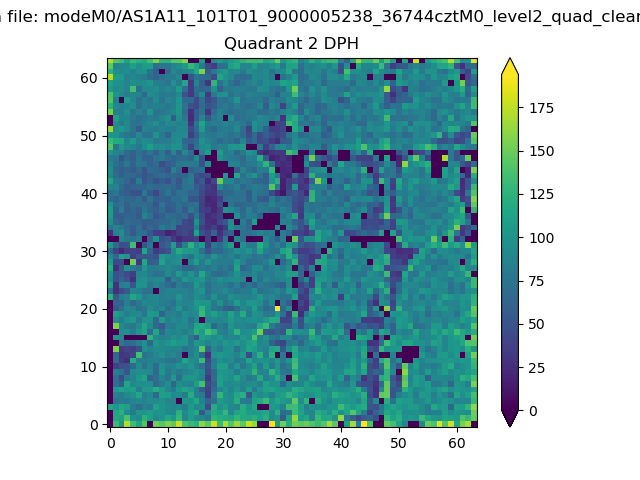
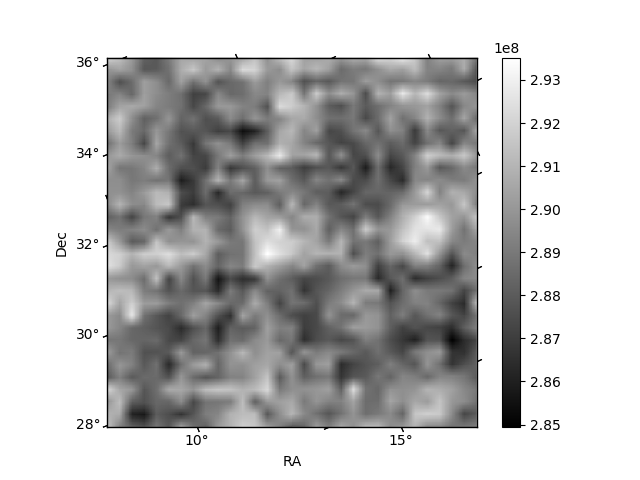
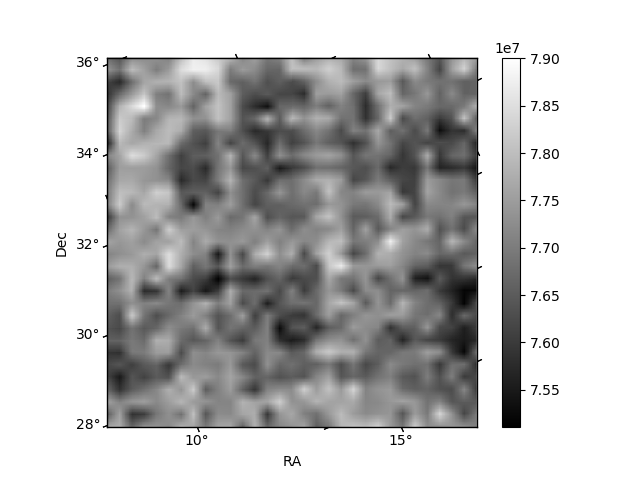
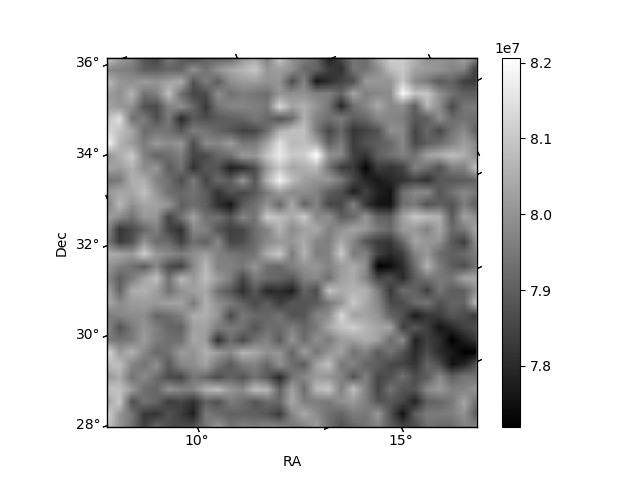
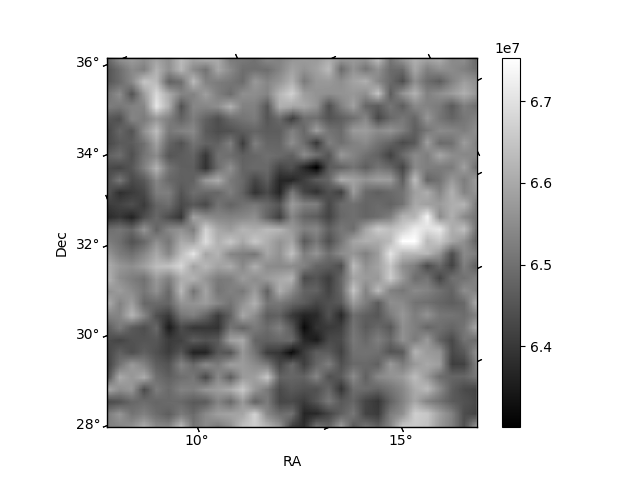
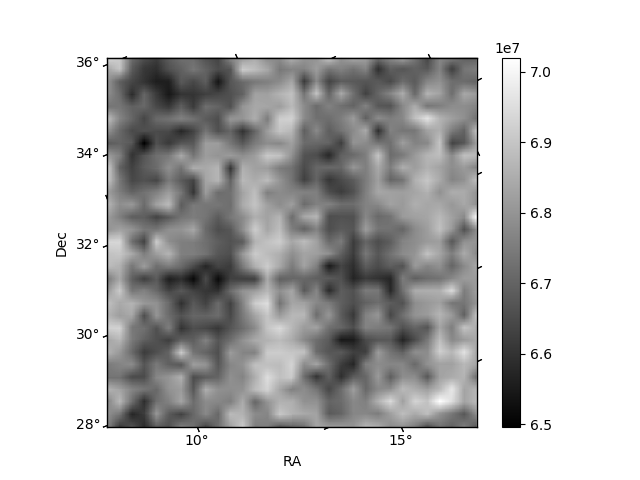
Histogram calculated using DETX and DETY for each event in the final _common_clean file
| Quadrant A | 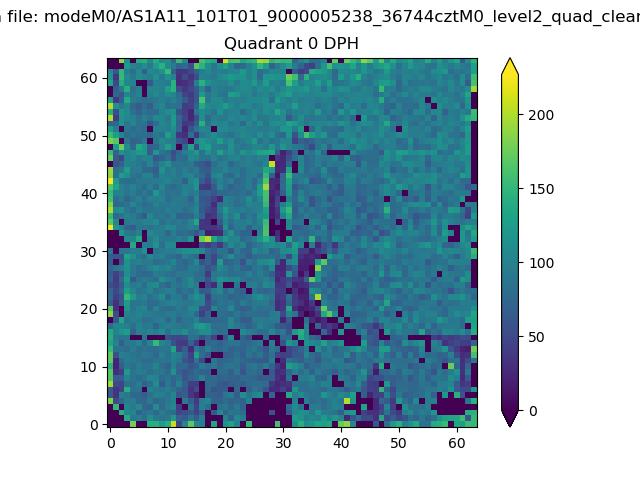 |
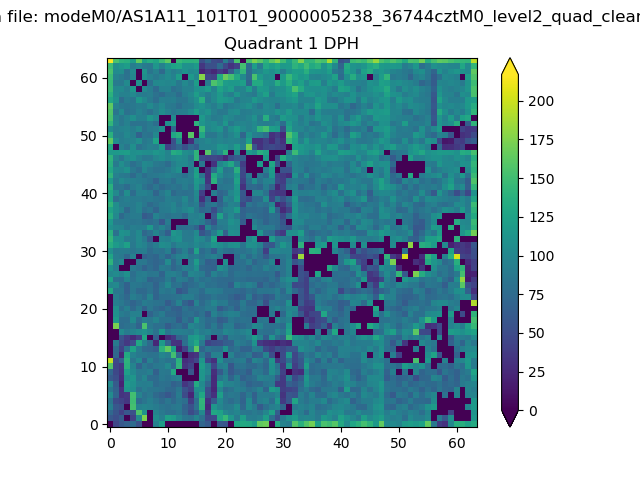 |
Quadrant B |
|---|---|---|---|
| Quadrant D | 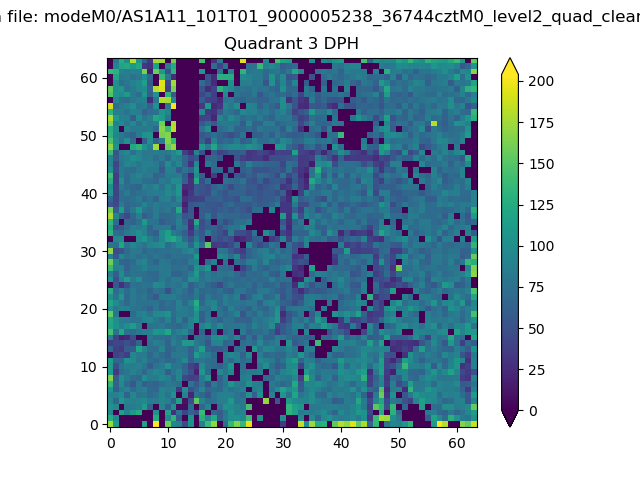 |
 |
Quadrant C |
| Plot type | Count rate plots | Images |
|---|---|---|
| Comparison with Poisson distribution Blue bars denote a histogram of data divided into 1 sec bins. Red curve is a Poisson curve with rate = median count rate of data. |
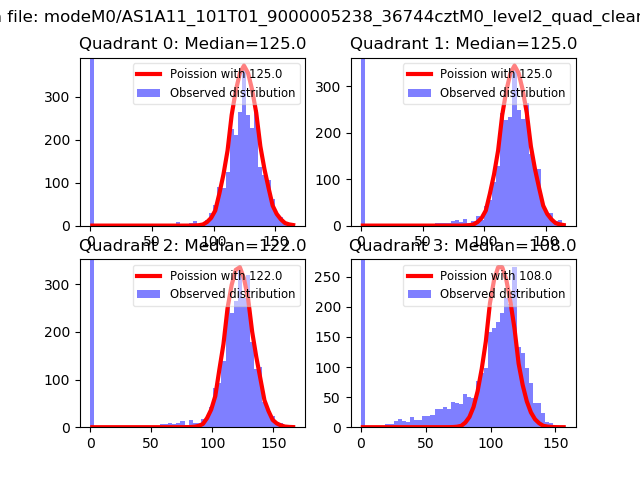 |
 |
| Quadrant-wise count rates Data is divided into 100 sec bins |
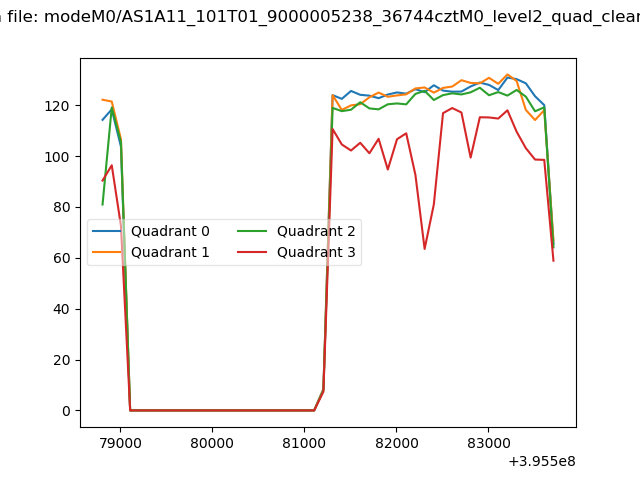 |
|
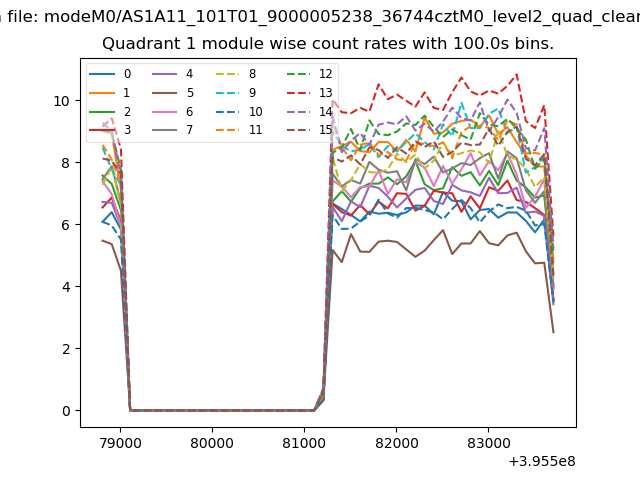
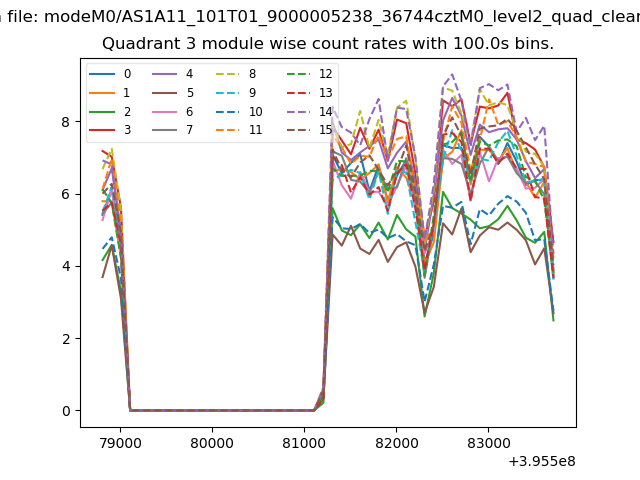
| Module-wise count rates for Quadrant A Data is divided into 100 sec bins |
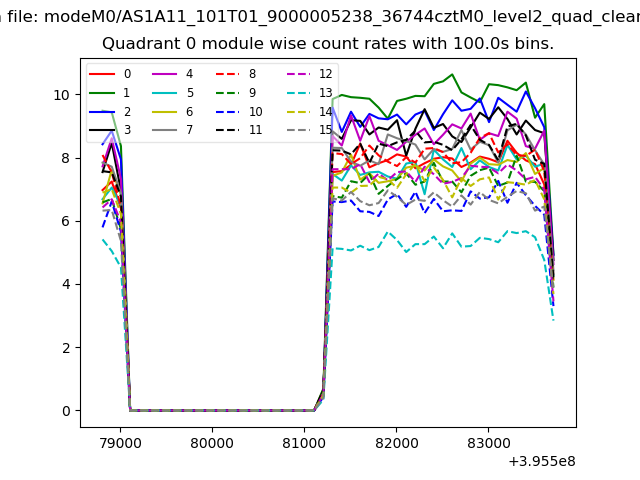 |
 |
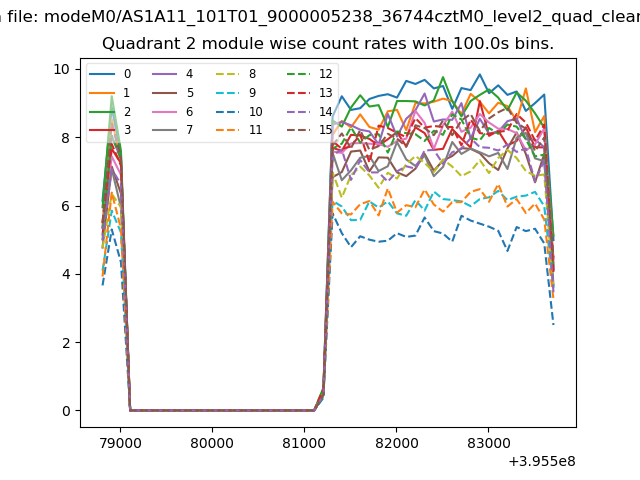
| Module-wise count rates for Quadrant B Data is divided into 100 sec bins |
 |
 |
| Module-wise count rates for Quadrant C Data is divided into 100 sec bins |
 |
 |
| Module-wise count rates for Quadrant D Data is divided into 100 sec bins |
 |
 |
| Parameter | Plot |
|---|---|
| CZT HV Monitor |  |
| D_VDD | 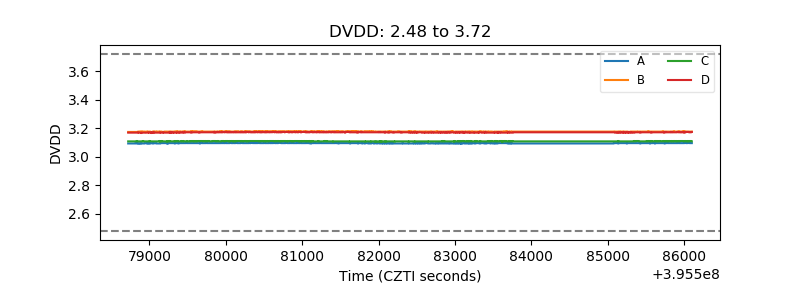 |
| Temperature 1 | 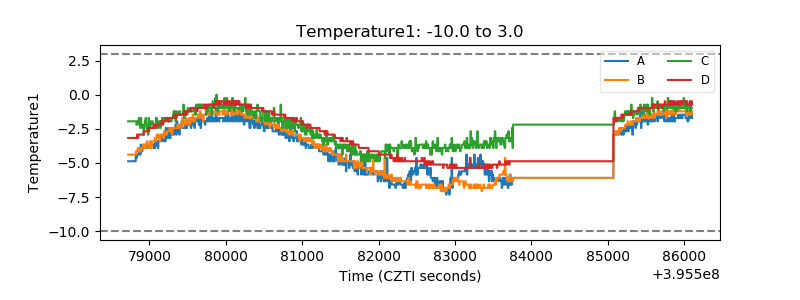 |
| Veto HV Monitor | 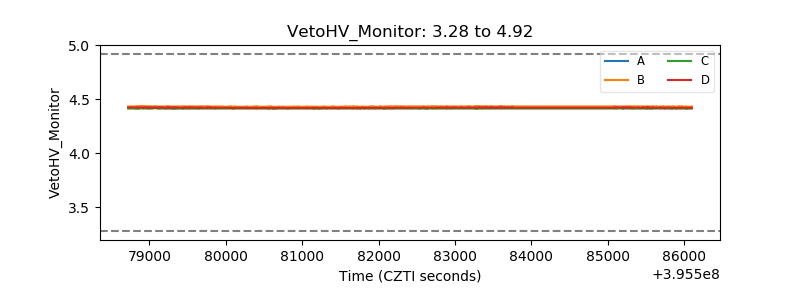 |
| Veto LLD |  |
| Alpha Counter | 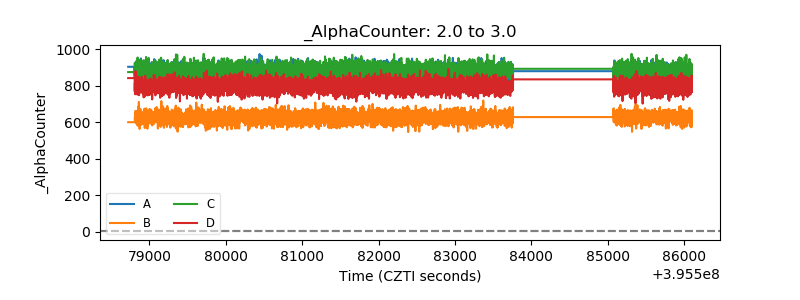 |
| _CPM_Rate | 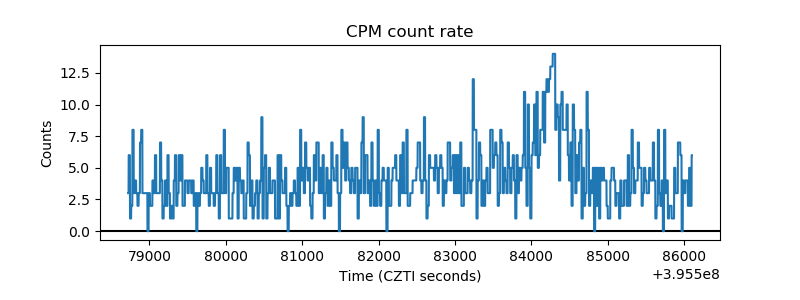 |
| CZT Counter | 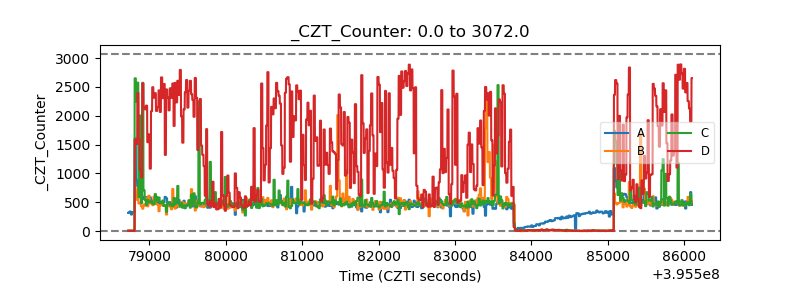 |
| +2.5 Volts monitor |  |
| +5 Volts monitor |  |
| _ROLL_ROT | 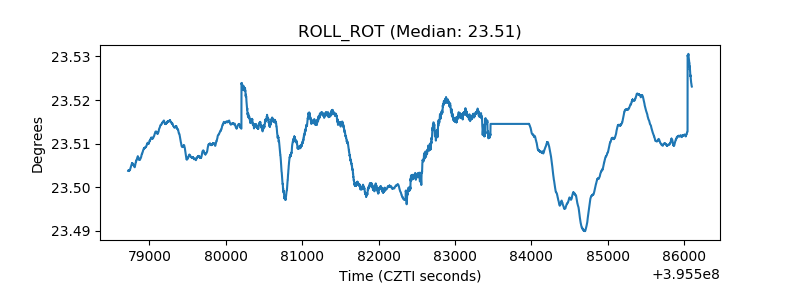 |
| _Roll_DEC | 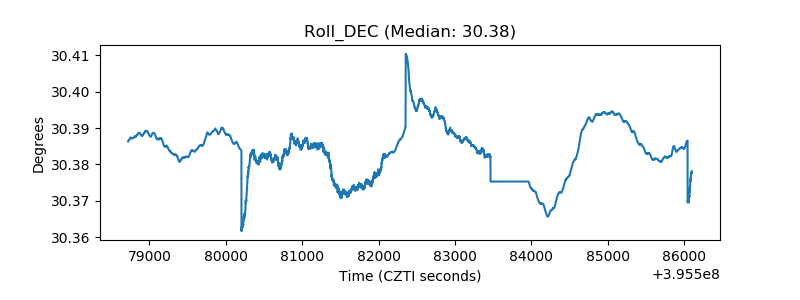 |
| _Roll_RA | 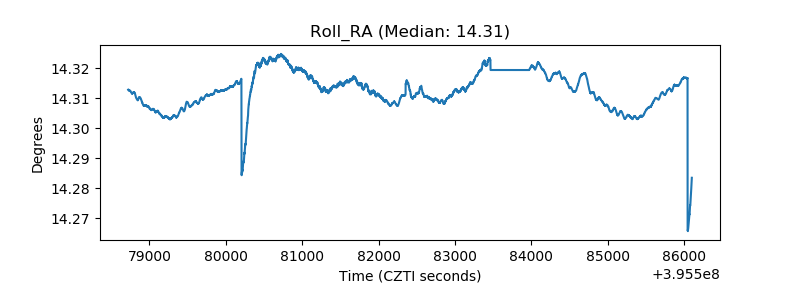 |
| Veto Counter | 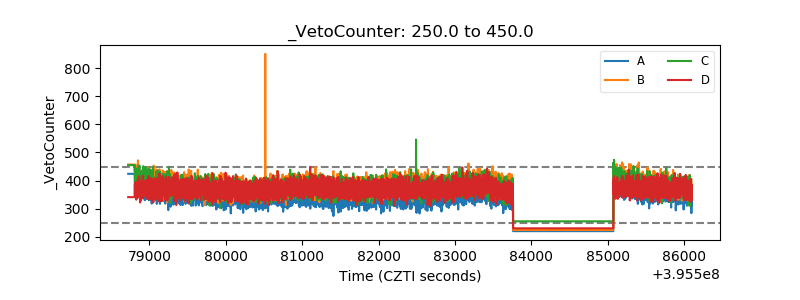 |