| Param | Original file | Final file |
|---|---|---|
| Filename | modeM0/AS1A11_101T01_9000005238_36747cztM0_level2.evt | modeM0/AS1A11_101T01_9000005238_36747cztM0_level2_quad_clean.evt |
| Size (bytes) | 1,534,305,600 | 186,399,360 |
| Size | 1.4 GB | 177.8 MB |
| Events in quadrant A | 7,607,294 | 1,199,363 |
| Events in quadrant B | 10,625,971 | 1,181,636 |
| Events in quadrant C | 9,770,580 | 1,141,025 |
| Events in quadrant D | 17,414,790 | 1,048,766 |
| Mode M0 | |||
|---|---|---|---|
| Quadrant | BADHDUFLAG | Total packets | Discarded packets |
| A | 0 | 32667 | 5 |
| B | 0 | 41781 | 4 |
| C | 0 | 38687 | 4 |
| D | 0 | 62362 | 4 |
| Mode SS | |||
|---|---|---|---|
| Quadrant | BADHDUFLAG | Total packets | Discarded packets |
| A | 0 | 318 | 0 |
| B | 0 | 318 | 0 |
| C | 0 | 318 | 0 |
| D | 0 | 318 | 0 |
| Mode M9 | |||
|---|---|---|---|
| Quadrant | BADHDUFLAG | Total packets | Discarded packets |
| A | 0 | 51 | 0 |
| B | 0 | 51 | 0 |
| C | 0 | 51 | 0 |
| D | 0 | 52 | 0 |
| Quadrant | Total seconds | Saturated seconds | Saturation percentage |
|---|---|---|---|
| A | 15556 | 29 | 0.186423% |
| B | 15556 | 882 | 5.669838% |
| C | 15556 | 577 | 3.709180% |
| D | 15556 | 3115 | 20.024428% |
Noise dominated data is calculated using 1-second bins in cleaned event files. If a bin has >2000 counts, and if more than 50% of those come from <1% of pixels, then it is considered to be noise-dominated and hence unusable.
| Quadrant | # 1 sec bins | Bins with >0 counts | Bins with >2000 counts | High rate bins dominated by noise | Noise dominated (total time) | Noise dominated (detector-on time) | Marked lightcurve |
|---|---|---|---|---|---|---|---|
| A | 19735 | 15559 | 10 | 10 | 0.05% | 0.06% | 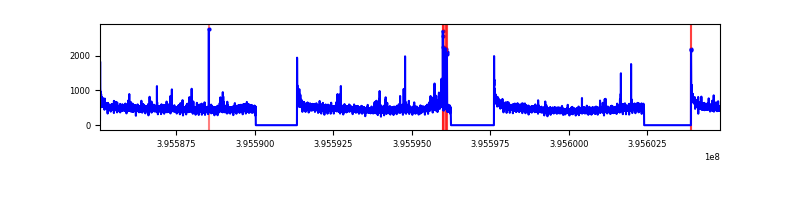 |
| B | 19735 | 15559 | 433 | 433 | 2.19% | 2.78% | 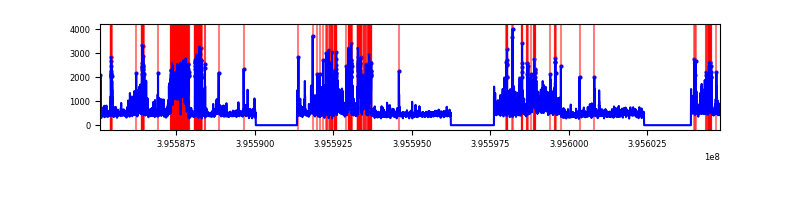 |
| C | 19735 | 15559 | 442 | 442 | 2.24% | 2.84% | 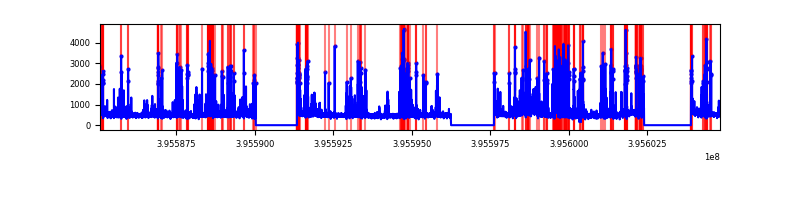 |
| D | 19735 | 15559 | 2930 | 2930 | 14.85% | 18.83% | 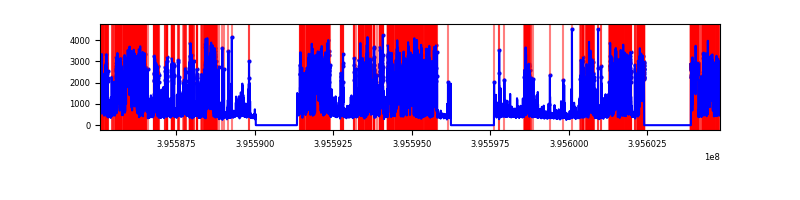 |
Top three noisy pixels from each quadrant. If the there are fewer than three noisy pixels in the level2.evt file, extra rows are filled as -1
| Pixel properties | Quadrant properties | ||||||
|---|---|---|---|---|---|---|---|
| Quadrant | DetID | PixID | Counts | Sigma | Mean | Median | Sigma |
| A | 10 | 83 | 568345 | 1592.4 | 1765 | 1727 | 355.8 |
| A | 7 | 3 | 145205 | 403.22 | 1765 | 1727 | 355.8 |
| A | 13 | 254 | 26060 | 68.38 | 1765 | 1727 | 355.8 |
| B | 5 | 200 | 2076855 | 6197.4 | 1739 | 1694 | 334.8 |
| B | 4 | 171 | 680280 | 2026.58 | 1739 | 1694 | 334.8 |
| B | 0 | 213 | 241367 | 715.78 | 1739 | 1694 | 334.8 |
| C | 14 | 254 | 1850567 | 4758.48 | 1679 | 1691 | 388.5 |
| C | 15 | 214 | 648061 | 1663.57 | 1679 | 1691 | 388.5 |
| C | 0 | 10 | 331520 | 848.89 | 1679 | 1691 | 388.5 |
| D | 12 | 227 | 8756647 | 22586.24 | 1580 | 1536 | 387.6 |
| D | 12 | 6 | 1032012 | 2658.4 | 1580 | 1536 | 387.6 |
| D | 13 | 171 | 474794 | 1220.9 | 1580 | 1536 | 387.6 |
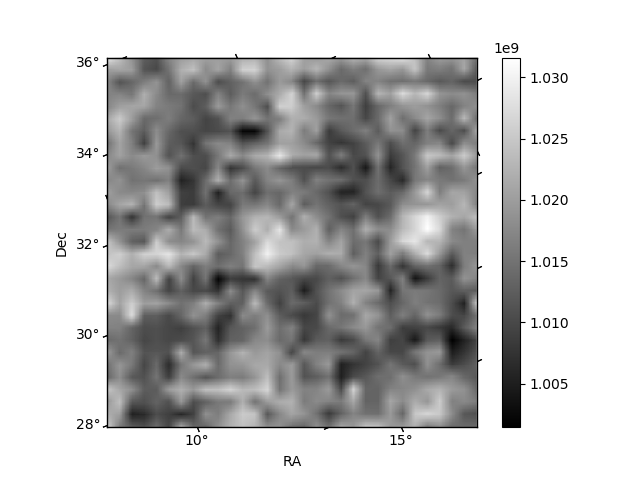
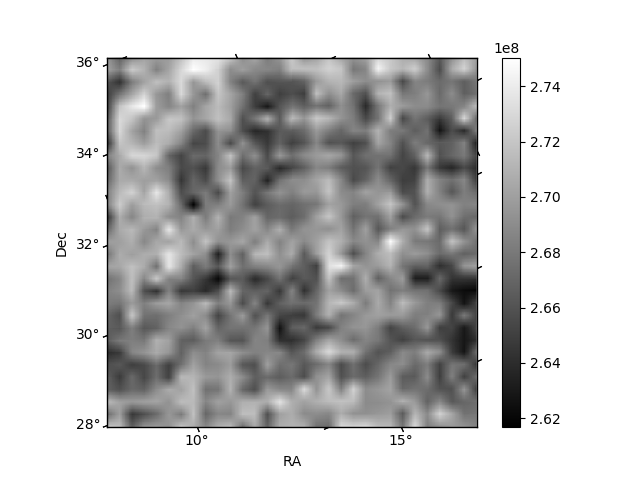
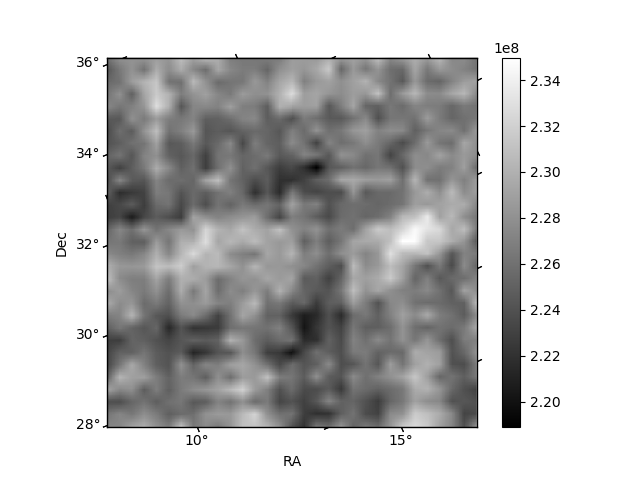
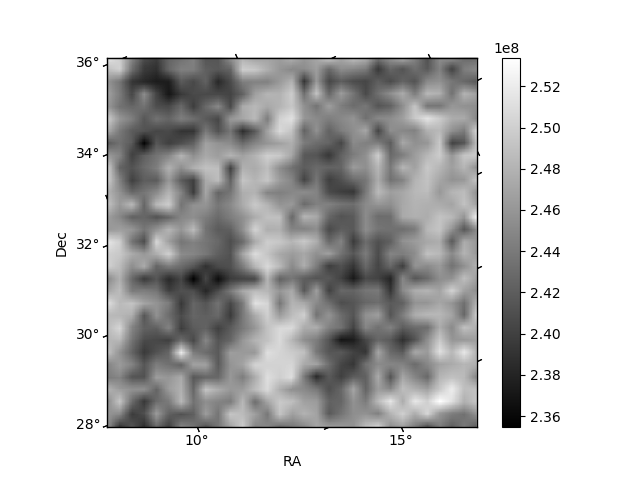
Histogram calculated using DETX and DETY for each event in the final _common_clean file
| Quadrant A | 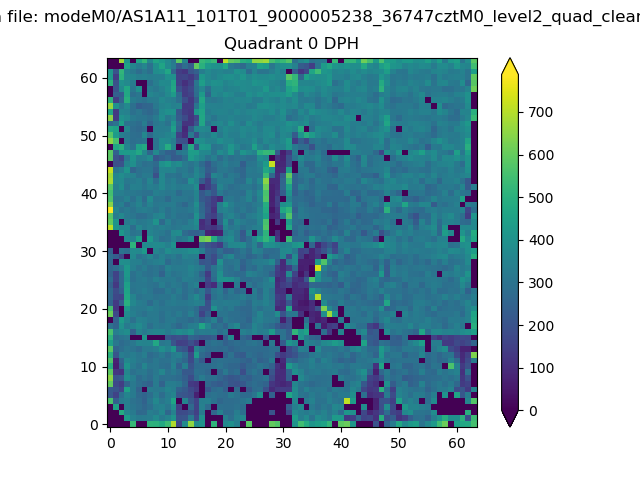 |
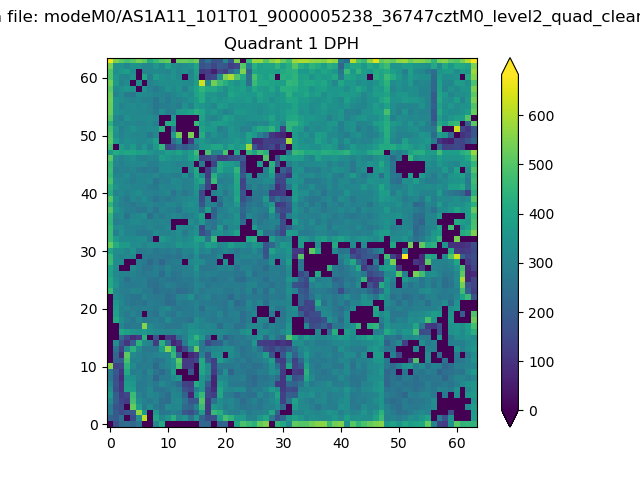 |
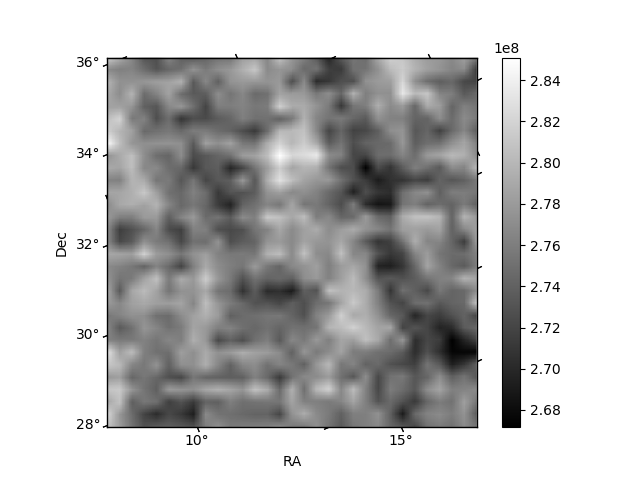
Quadrant B |
|---|---|---|---|
| Quadrant D | 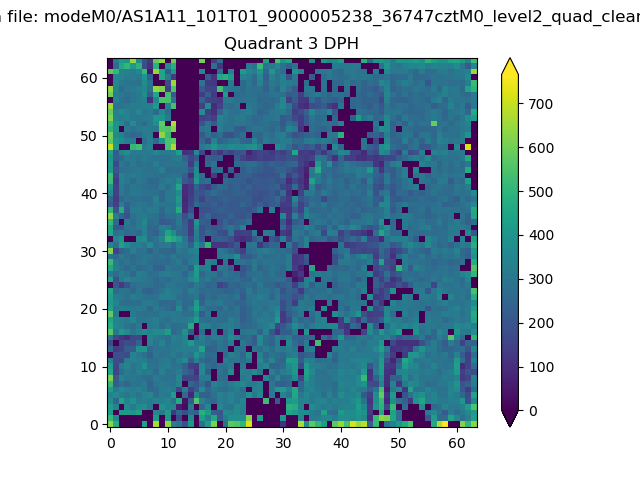 |
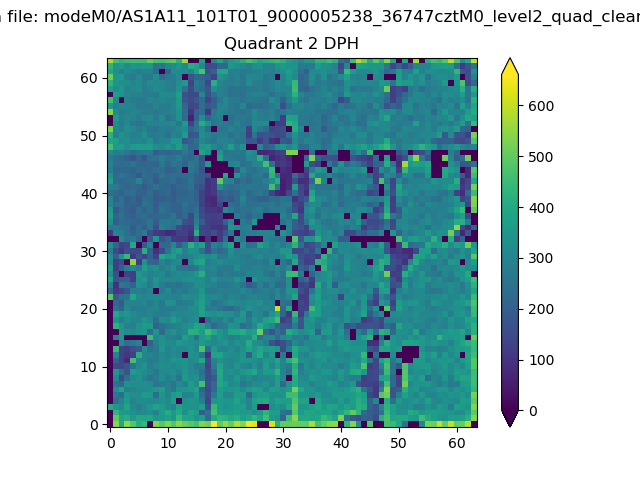 |
Quadrant C |
| Plot type | Count rate plots | Images |
|---|---|---|
| Comparison with Poisson distribution Blue bars denote a histogram of data divided into 1 sec bins. Red curve is a Poisson curve with rate = median count rate of data. |
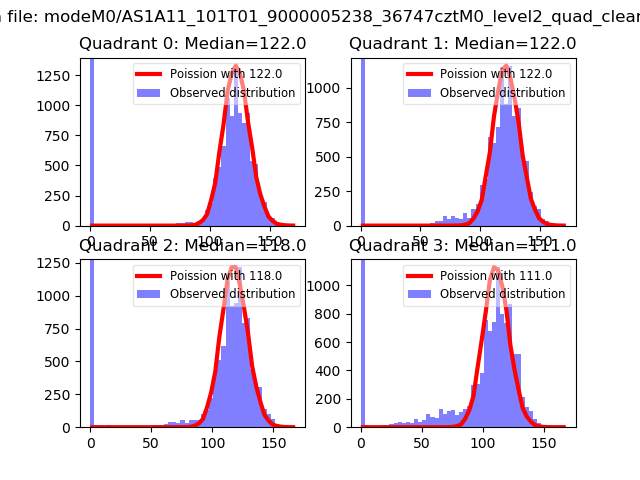 |
 |
| Quadrant-wise count rates Data is divided into 100 sec bins |
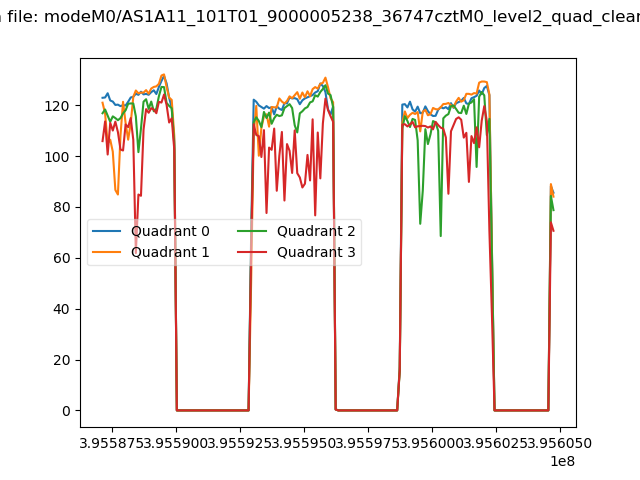 |
|
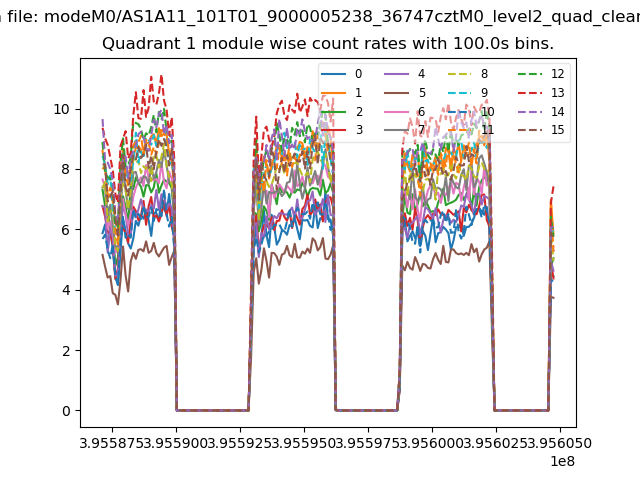
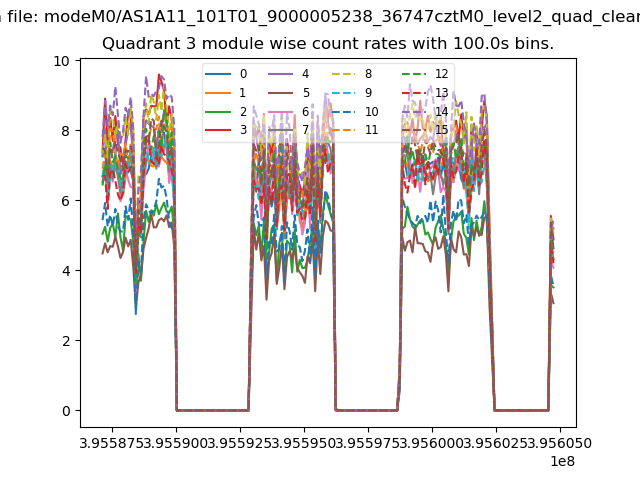
| Module-wise count rates for Quadrant A Data is divided into 100 sec bins |
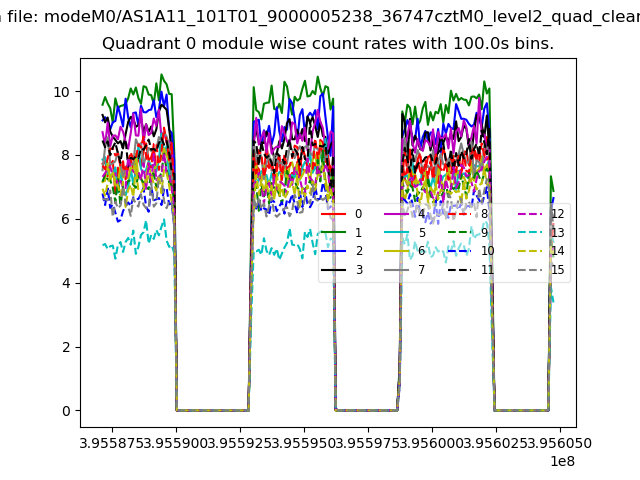 |
 |
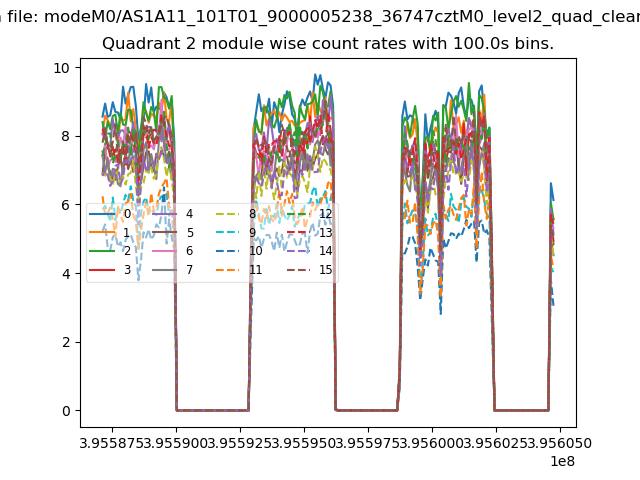
| Module-wise count rates for Quadrant B Data is divided into 100 sec bins |
 |
 |
| Module-wise count rates for Quadrant C Data is divided into 100 sec bins |
 |
 |
| Module-wise count rates for Quadrant D Data is divided into 100 sec bins |
 |
 |
| Parameter | Plot |
|---|---|
| CZT HV Monitor | 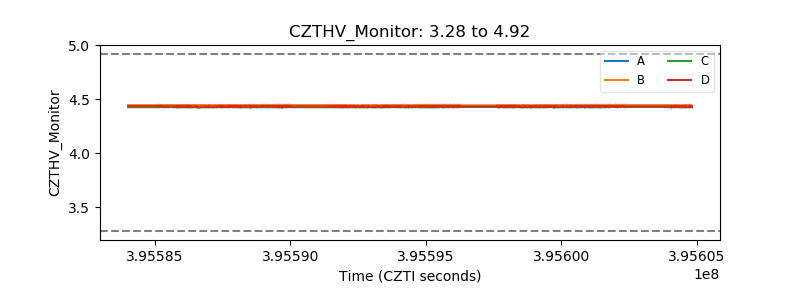 |
| D_VDD | 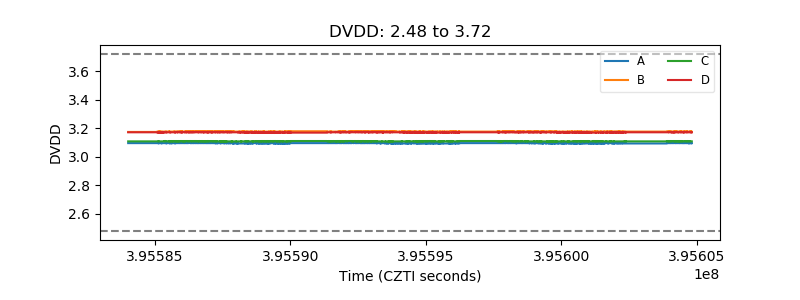 |
| Temperature 1 | 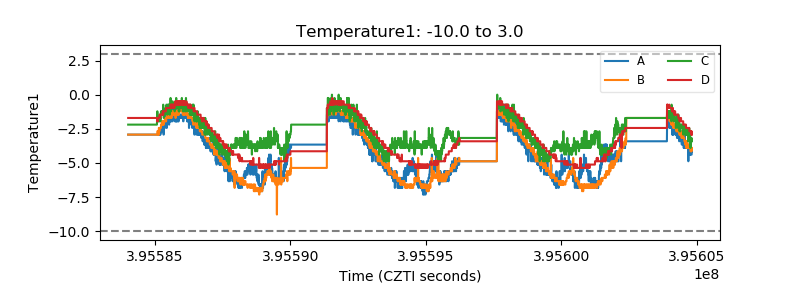 |
| Veto HV Monitor | 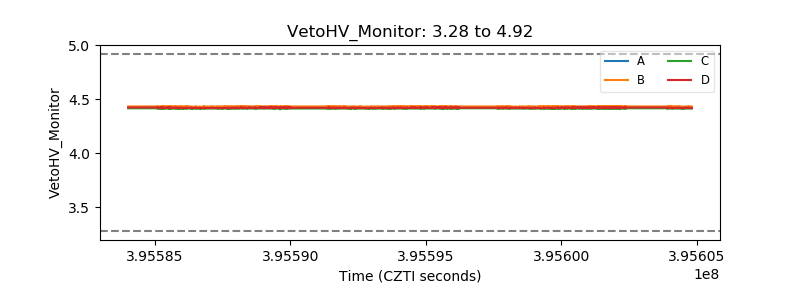 |
| Veto LLD | 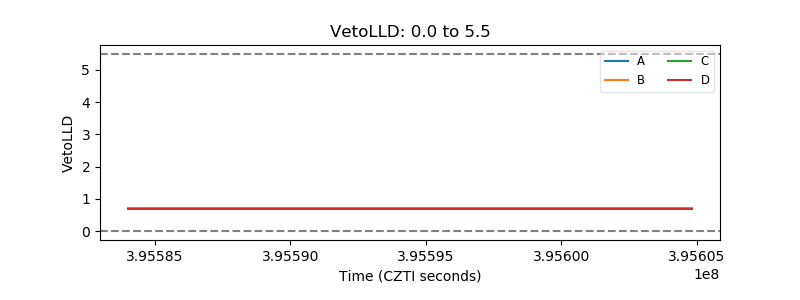 |
| Alpha Counter | 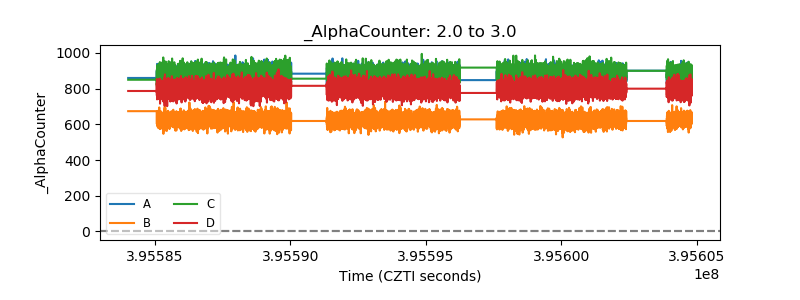 |
| _CPM_Rate | 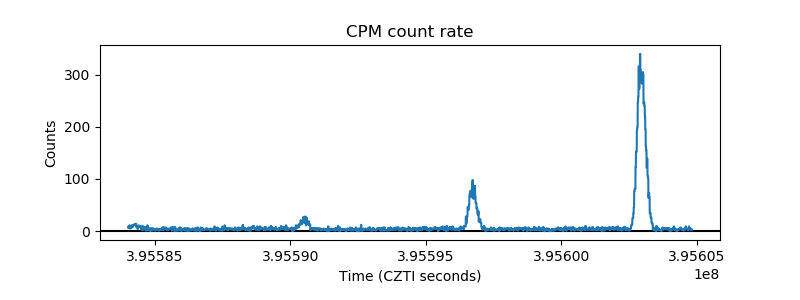 |
| CZT Counter | 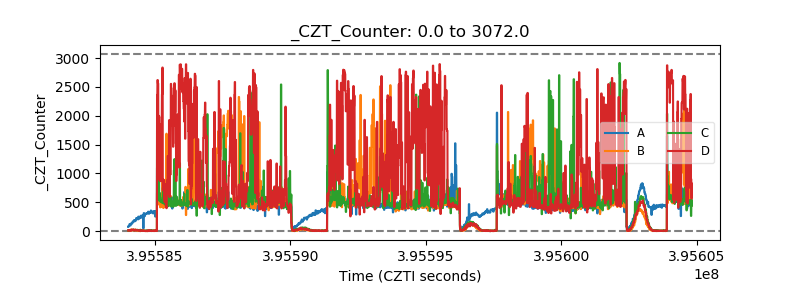 |
| +2.5 Volts monitor |  |
| +5 Volts monitor | 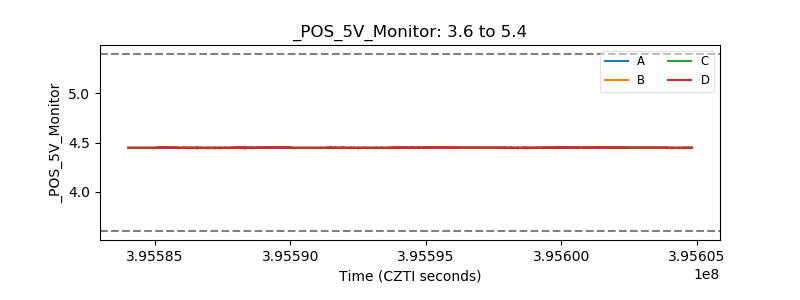 |
| _ROLL_ROT | 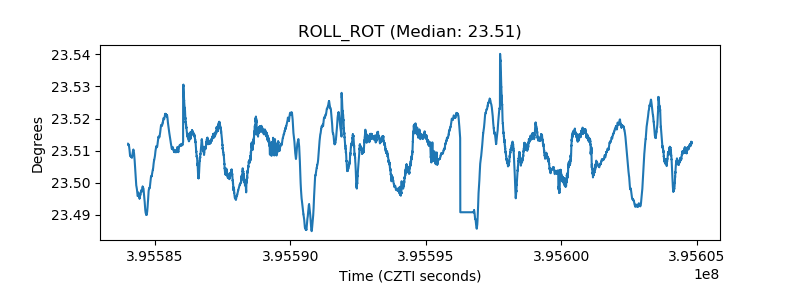 |
| _Roll_DEC | 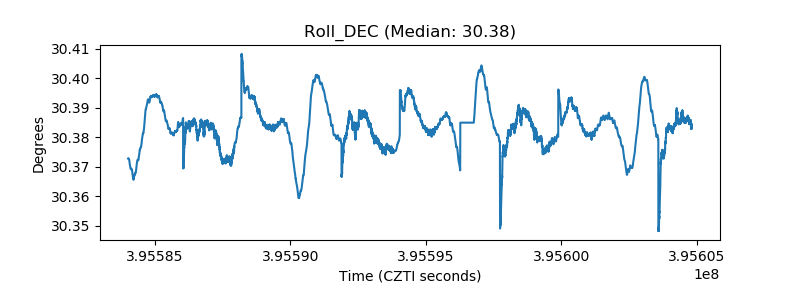 |
| _Roll_RA | 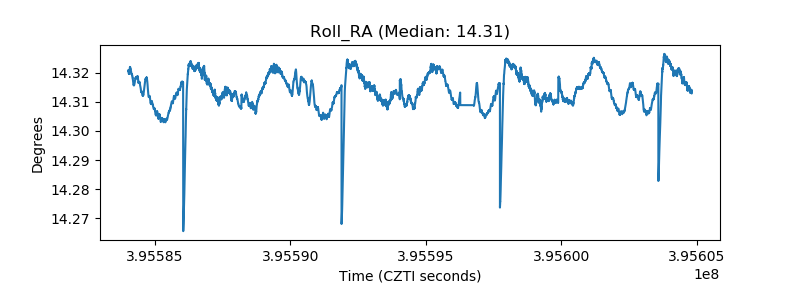 |
| Veto Counter | 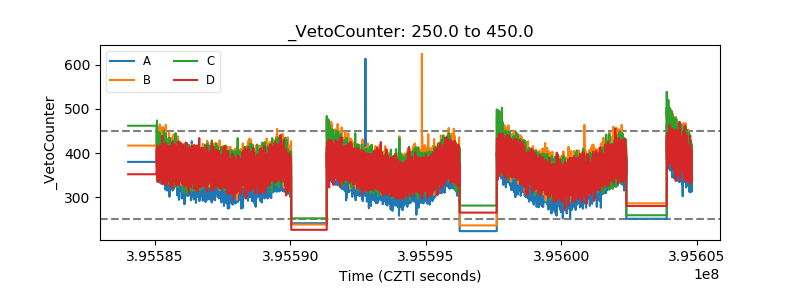 |