| Param | Original file | Final file |
|---|---|---|
| Filename | modeM0/AS1A11_101T01_9000005238_36748cztM0_level2.evt | modeM0/AS1A11_101T01_9000005238_36748cztM0_level2_quad_clean.evt |
| Size (bytes) | 523,702,080 | 78,598,080 |
| Size | 499.4 MB | 75.0 MB |
| Events in quadrant A | 2,820,947 | 516,093 |
| Events in quadrant B | 3,278,928 | 522,758 |
| Events in quadrant C | 3,178,743 | 503,679 |
| Events in quadrant D | 6,200,423 | 444,345 |
| Mode M0 | |||
|---|---|---|---|
| Quadrant | BADHDUFLAG | Total packets | Discarded packets |
| A | 0 | 12102 | 3 |
| B | 0 | 13522 | 2 |
| C | 0 | 12904 | 2 |
| D | 0 | 22281 | 2 |
| Mode SS | |||
|---|---|---|---|
| Quadrant | BADHDUFLAG | Total packets | Discarded packets |
| A | 0 | 116 | 0 |
| B | 0 | 116 | 0 |
| C | 0 | 116 | 0 |
| D | 0 | 116 | 0 |
| Mode M9 | |||
|---|---|---|---|
| Quadrant | BADHDUFLAG | Total packets | Discarded packets |
| A | 0 | 31 | 0 |
| B | 0 | 31 | 0 |
| C | 0 | 31 | 0 |
| D | 0 | 31 | 0 |
| Quadrant | Total seconds | Saturated seconds | Saturation percentage |
|---|---|---|---|
| A | 5619 | 18 | 0.320342% |
| B | 5619 | 175 | 3.114433% |
| C | 5619 | 72 | 1.281367% |
| D | 5619 | 1325 | 23.580708% |
Noise dominated data is calculated using 1-second bins in cleaned event files. If a bin has >2000 counts, and if more than 50% of those come from <1% of pixels, then it is considered to be noise-dominated and hence unusable.
| Quadrant | # 1 sec bins | Bins with >0 counts | Bins with >2000 counts | High rate bins dominated by noise | Noise dominated (total time) | Noise dominated (detector-on time) | Marked lightcurve |
|---|---|---|---|---|---|---|---|
| A | 8726 | 5621 | 7 | 7 | 0.08% | 0.12% | 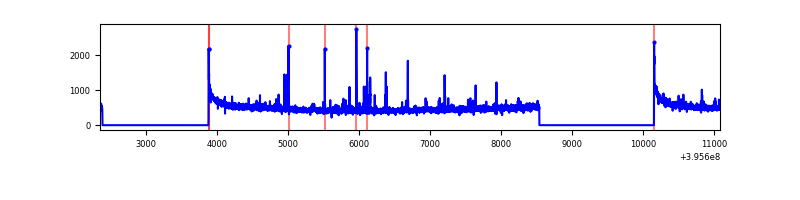 |
| B | 8726 | 5621 | 62 | 62 | 0.71% | 1.10% | 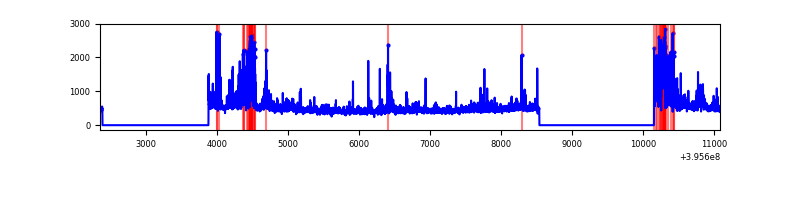 |
| C | 8726 | 5621 | 55 | 55 | 0.63% | 0.98% | 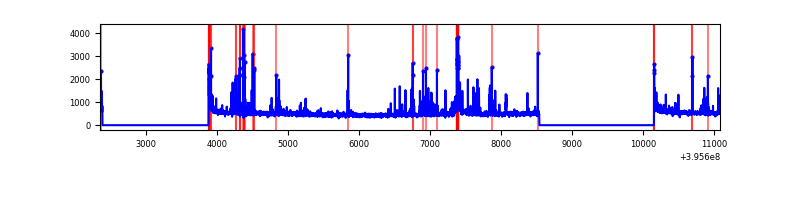 |
| D | 8725 | 5620 | 1268 | 1268 | 14.53% | 22.56% | 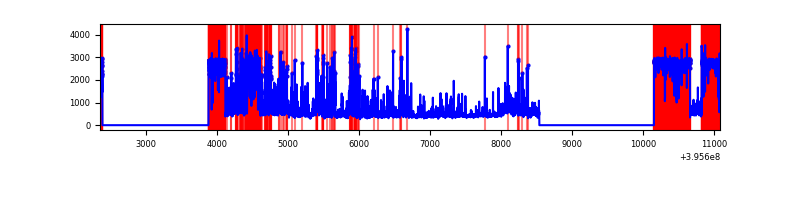 |
Top three noisy pixels from each quadrant. If the there are fewer than three noisy pixels in the level2.evt file, extra rows are filled as -1
| Pixel properties | Quadrant properties | ||||||
|---|---|---|---|---|---|---|---|
| Quadrant | DetID | PixID | Counts | Sigma | Mean | Median | Sigma |
| A | 10 | 83 | 233496 | 1769.04 | 643 | 629 | 131.6 |
| A | 9 | 143 | 75819 | 571.2 | 643 | 629 | 131.6 |
| A | 2 | 79 | 10425 | 74.42 | 643 | 629 | 131.6 |
| B | 4 | 171 | 445425 | 3605.12 | 638 | 621 | 123.4 |
| B | 5 | 172 | 85099 | 684.69 | 638 | 621 | 123.4 |
| B | 0 | 213 | 83346 | 670.48 | 638 | 621 | 123.4 |
| C | 14 | 254 | 256826 | 1734.25 | 626 | 628 | 147.7 |
| C | 15 | 214 | 238363 | 1609.27 | 626 | 628 | 147.7 |
| C | 0 | 207 | 178158 | 1201.73 | 626 | 628 | 147.7 |
| D | 12 | 227 | 3393961 | 26262.14 | 527 | 513 | 129.2 |
| D | 12 | 6 | 380332 | 2939.45 | 527 | 513 | 129.2 |
| D | 13 | 249 | 135963 | 1048.26 | 527 | 513 | 129.2 |
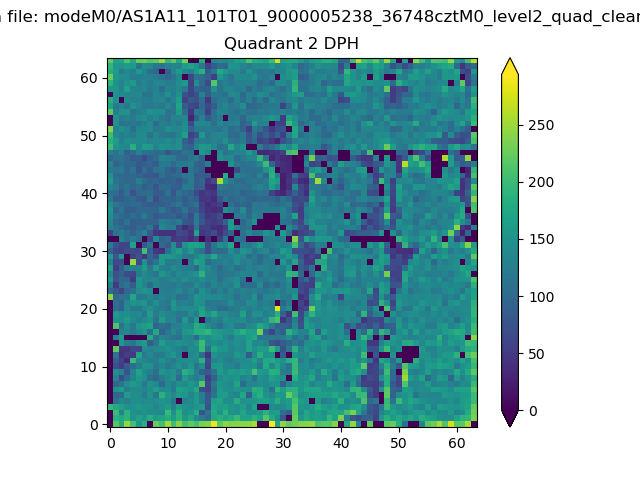
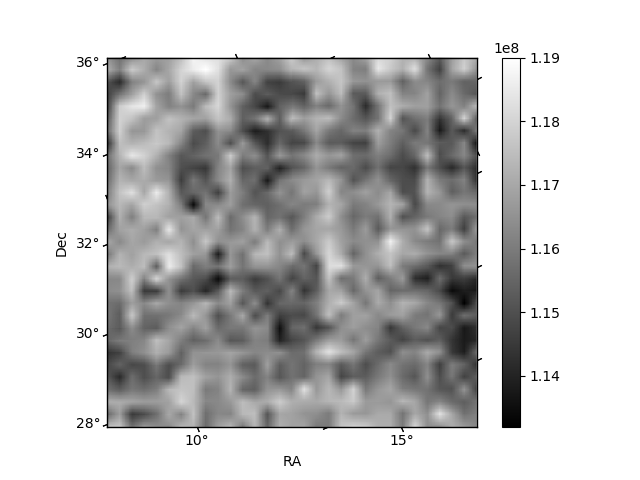
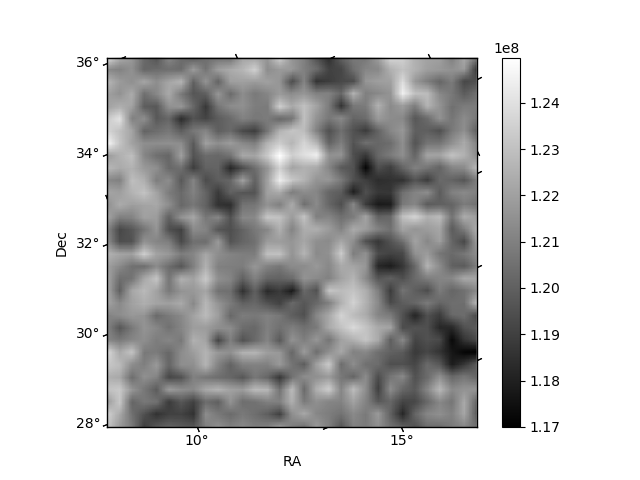
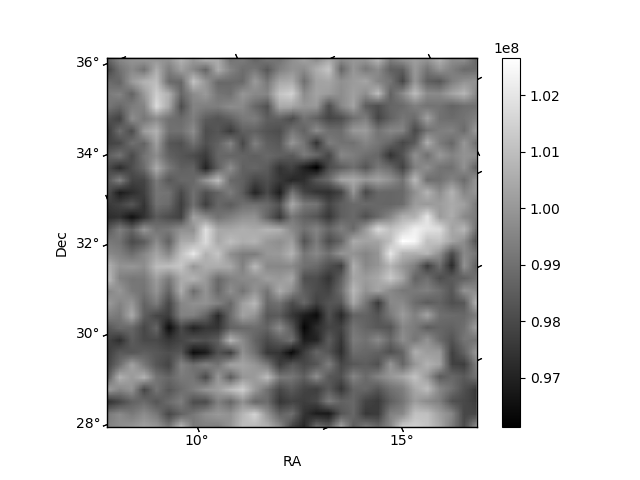
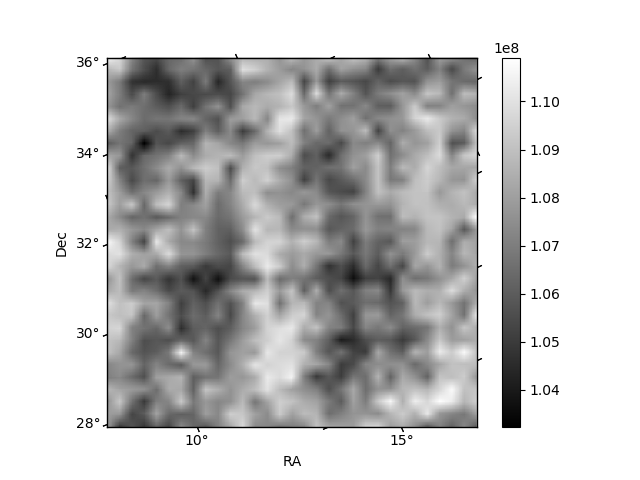
Histogram calculated using DETX and DETY for each event in the final _common_clean file
| Quadrant A | 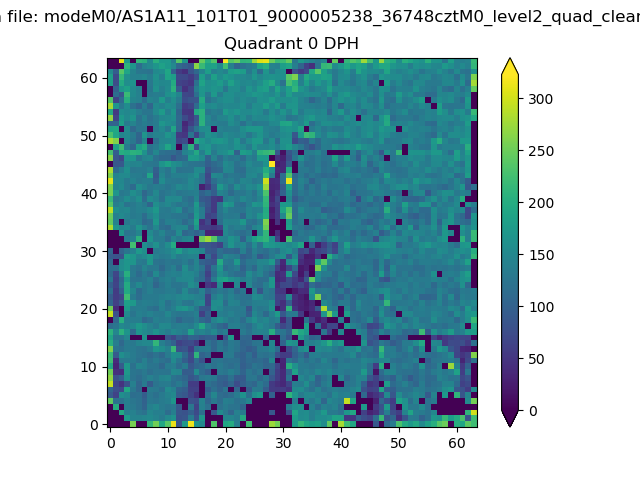 |
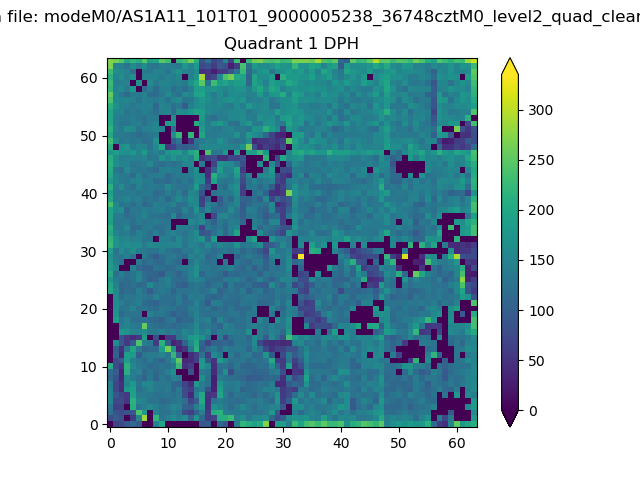 |
Quadrant B |
|---|---|---|---|
| Quadrant D | 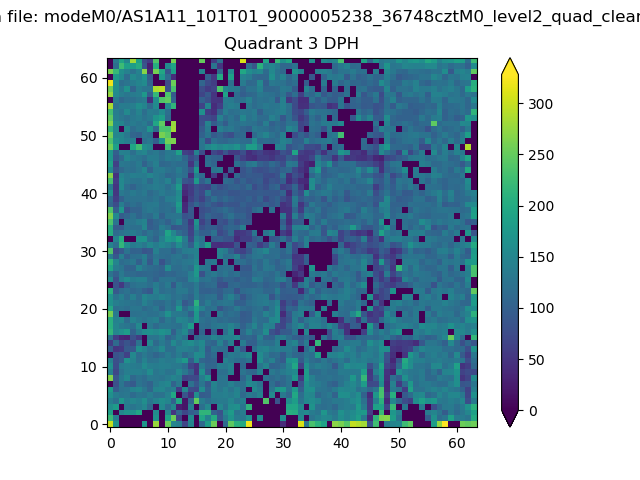 |
 |
Quadrant C |
| Plot type | Count rate plots | Images |
|---|---|---|
| Comparison with Poisson distribution Blue bars denote a histogram of data divided into 1 sec bins. Red curve is a Poisson curve with rate = median count rate of data. |
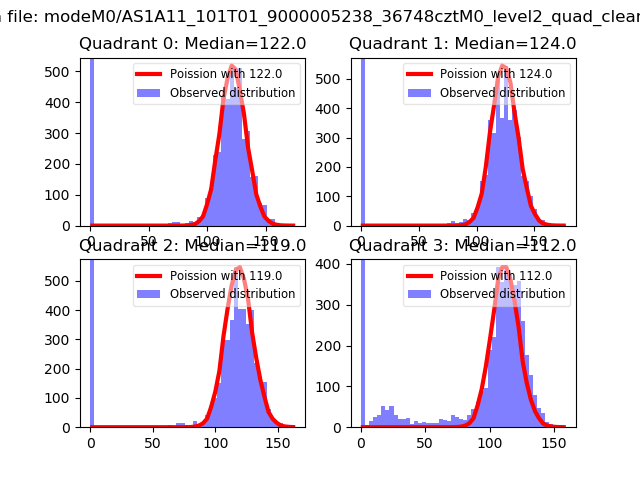 |
 |
| Quadrant-wise count rates Data is divided into 100 sec bins |
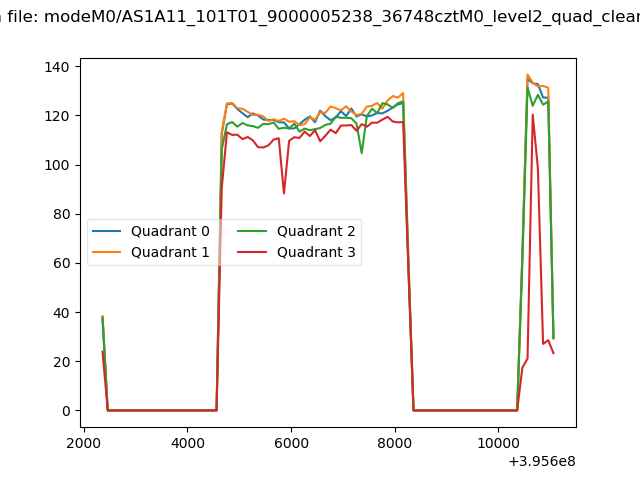 |
|
| Module-wise count rates for Quadrant A Data is divided into 100 sec bins |
 |
 |
| Module-wise count rates for Quadrant B Data is divided into 100 sec bins |
 |
 |
| Module-wise count rates for Quadrant C Data is divided into 100 sec bins |
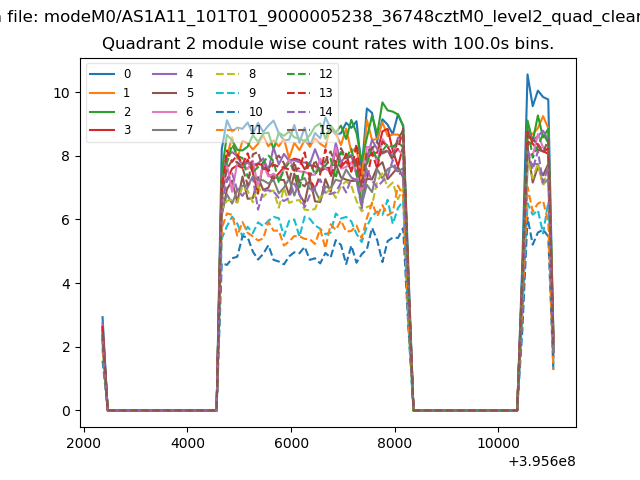 |
 |
| Module-wise count rates for Quadrant D Data is divided into 100 sec bins |
 |
 |
| Parameter | Plot |
|---|---|
| CZT HV Monitor | 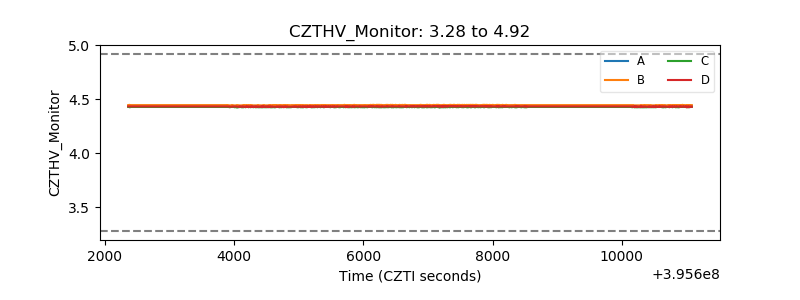 |
| D_VDD | 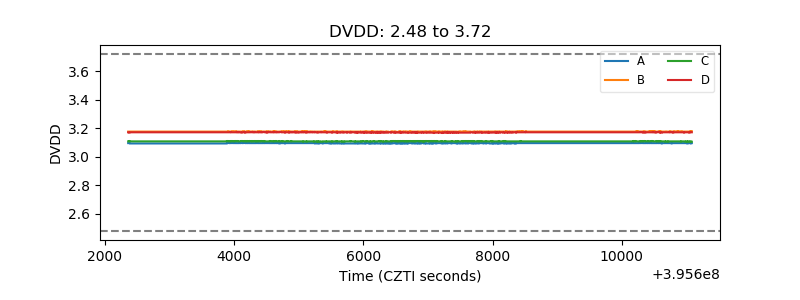 |
| Temperature 1 | 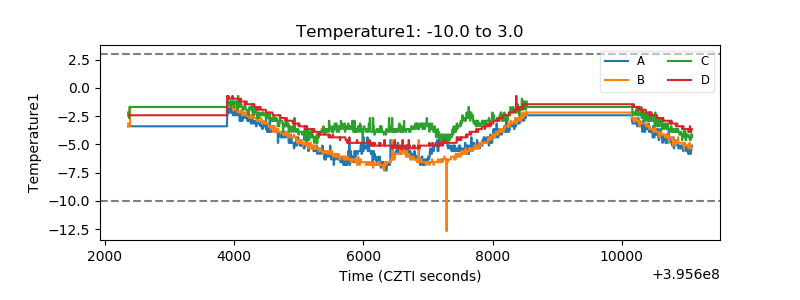 |
| Veto HV Monitor |  |
| Veto LLD | 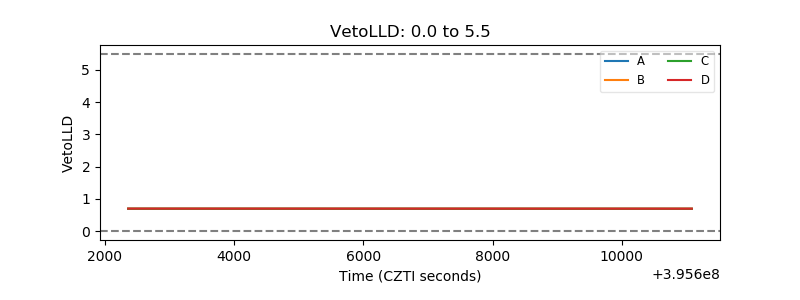 |
| Alpha Counter | 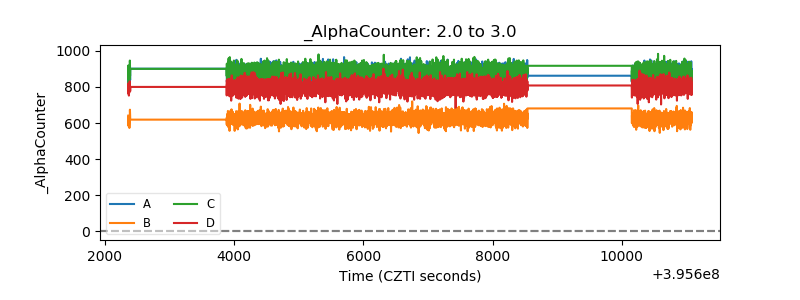 |
| _CPM_Rate | 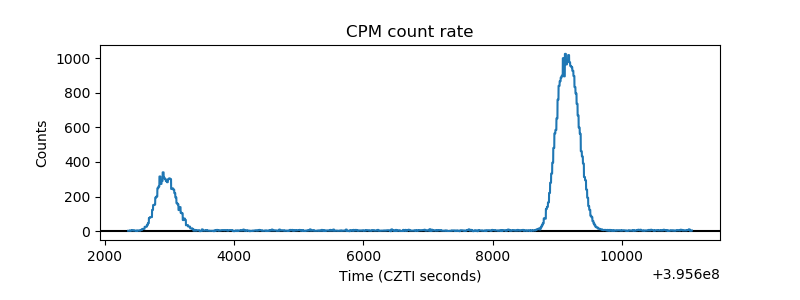 |
| CZT Counter |  |
| +2.5 Volts monitor | 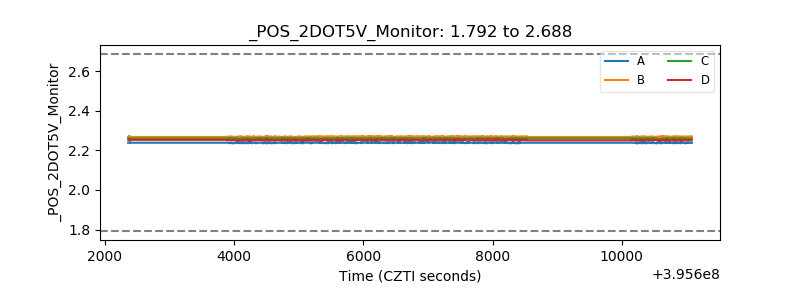 |
| +5 Volts monitor |  |
| _ROLL_ROT | 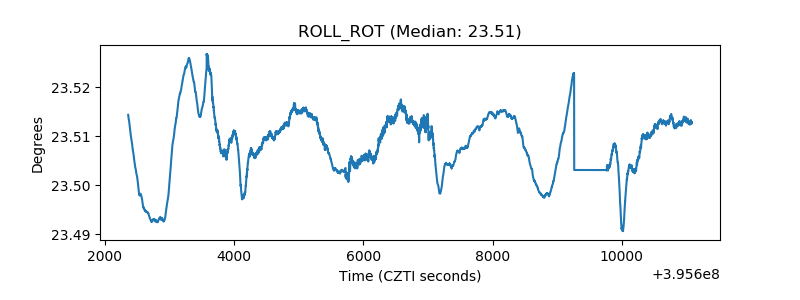 |
| _Roll_DEC | 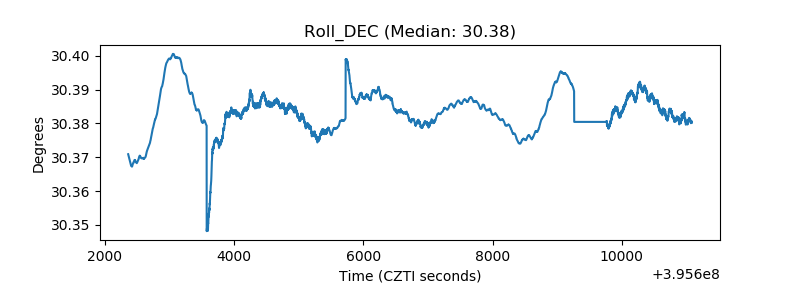 |
| _Roll_RA |  |
| Veto Counter | 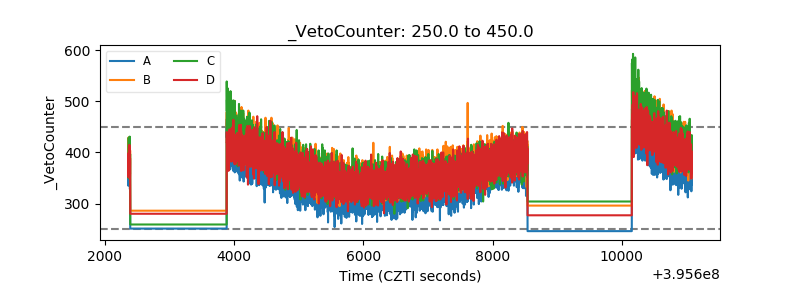 |