| Param | Original file | Final file |
|---|---|---|
| Filename | modeM0/AS1A11_101T01_9000005238_36751cztM0_level2.evt | modeM0/AS1A11_101T01_9000005238_36751cztM0_level2_quad_clean.evt |
| Size (bytes) | 449,150,400 | 85,789,440 |
| Size | 428.3 MB | 81.8 MB |
| Events in quadrant A | 2,591,078 | 573,423 |
| Events in quadrant B | 2,749,177 | 585,499 |
| Events in quadrant C | 2,956,516 | 573,807 |
| Events in quadrant D | 4,954,270 | 502,311 |
| Mode M0 | |||
|---|---|---|---|
| Quadrant | BADHDUFLAG | Total packets | Discarded packets |
| A | 0 | 11074 | 3 |
| B | 0 | 11577 | 2 |
| C | 0 | 11934 | 2 |
| D | 0 | 18142 | 2 |
| Mode SS | |||
|---|---|---|---|
| Quadrant | BADHDUFLAG | Total packets | Discarded packets |
| A | 0 | 104 | 0 |
| B | 0 | 104 | 0 |
| C | 0 | 104 | 0 |
| D | 0 | 104 | 0 |
| Mode M9 | |||
|---|---|---|---|
| Quadrant | BADHDUFLAG | Total packets | Discarded packets |
| A | 0 | 28 | 0 |
| B | 0 | 28 | 0 |
| C | 0 | 28 | 0 |
| D | 0 | 29 | 0 |
| Quadrant | Total seconds | Saturated seconds | Saturation percentage |
|---|---|---|---|
| A | 5184 | 8 | 0.154321% |
| B | 5184 | 63 | 1.215278% |
| C | 5184 | 63 | 1.215278% |
| D | 5184 | 673 | 12.982253% |
Noise dominated data is calculated using 1-second bins in cleaned event files. If a bin has >2000 counts, and if more than 50% of those come from <1% of pixels, then it is considered to be noise-dominated and hence unusable.
| Quadrant | # 1 sec bins | Bins with >0 counts | Bins with >2000 counts | High rate bins dominated by noise | Noise dominated (total time) | Noise dominated (detector-on time) | Marked lightcurve |
|---|---|---|---|---|---|---|---|
| A | 7066 | 5185 | 5 | 5 | 0.07% | 0.10% | 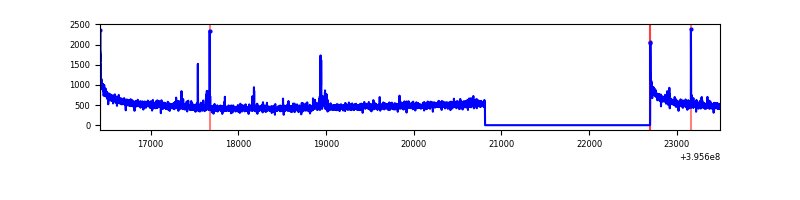 |
| B | 7066 | 5185 | 42 | 42 | 0.59% | 0.81% | 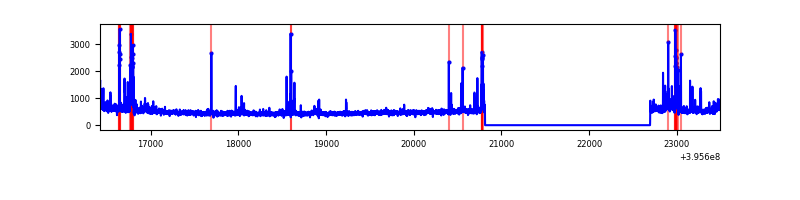 |
| C | 7066 | 5185 | 53 | 53 | 0.75% | 1.02% | 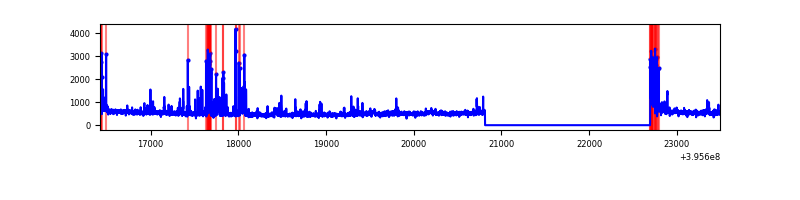 |
| D | 7066 | 5185 | 678 | 678 | 9.60% | 13.08% | 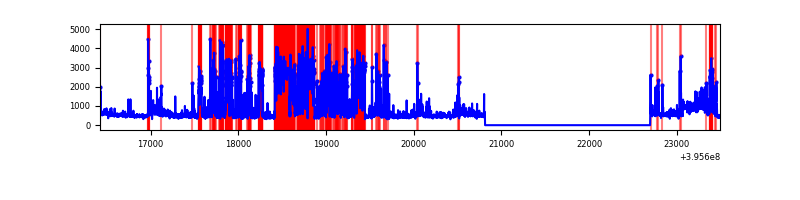 |
Top three noisy pixels from each quadrant. If the there are fewer than three noisy pixels in the level2.evt file, extra rows are filled as -1
| Pixel properties | Quadrant properties | ||||||
|---|---|---|---|---|---|---|---|
| Quadrant | DetID | PixID | Counts | Sigma | Mean | Median | Sigma |
| A | 10 | 83 | 211448 | 1733.62 | 602 | 591 | 121.6 |
| A | 9 | 143 | 48513 | 394.0 | 602 | 591 | 121.6 |
| A | 13 | 254 | 7796 | 59.24 | 602 | 591 | 121.6 |
| B | 0 | 213 | 112386 | 972.41 | 602 | 586 | 115.0 |
| B | 4 | 171 | 84696 | 731.57 | 602 | 586 | 115.0 |
| B | 5 | 255 | 56417 | 485.61 | 602 | 586 | 115.0 |
| C | 14 | 254 | 228352 | 1645.12 | 591 | 594 | 138.4 |
| C | 15 | 214 | 220549 | 1588.76 | 591 | 594 | 138.4 |
| C | 0 | 10 | 124472 | 894.79 | 591 | 594 | 138.4 |
| D | 12 | 227 | 2108710 | 15506.94 | 560 | 545 | 135.9 |
| D | 7 | 223 | 170083 | 1247.06 | 560 | 545 | 135.9 |
| D | 13 | 249 | 130163 | 953.43 | 560 | 545 | 135.9 |
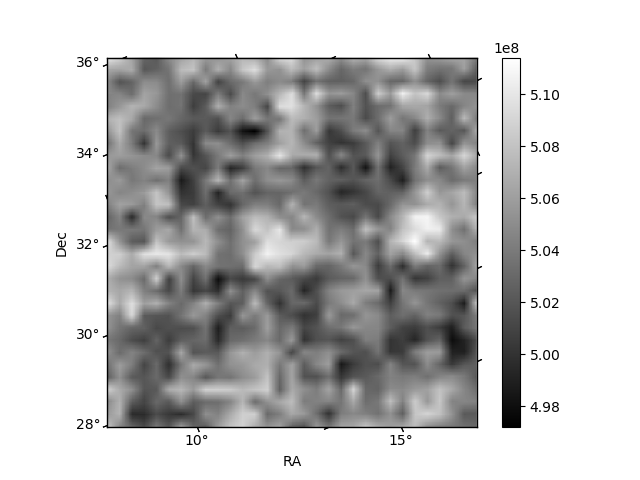
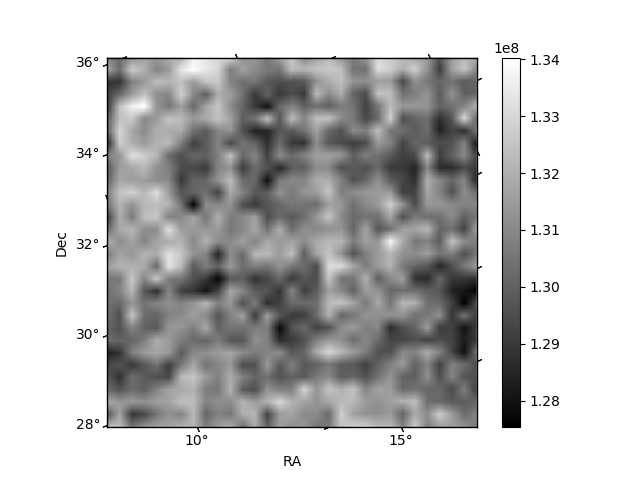
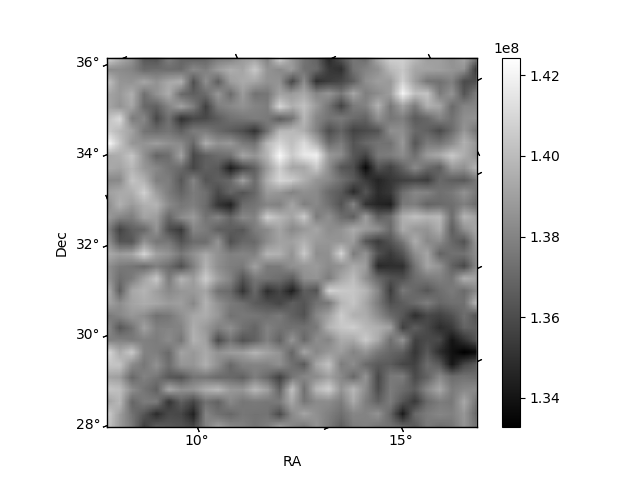
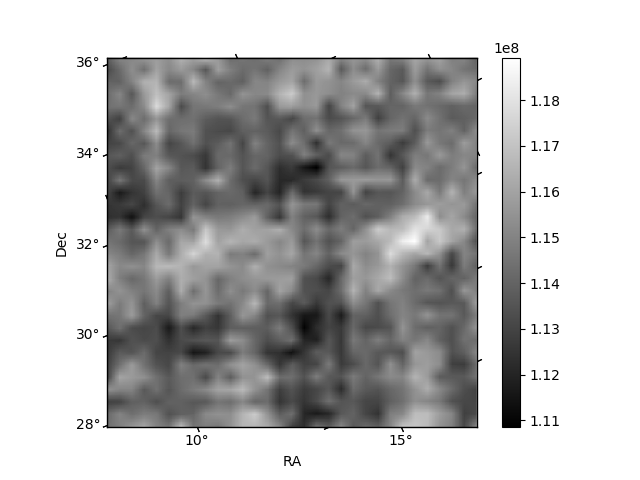
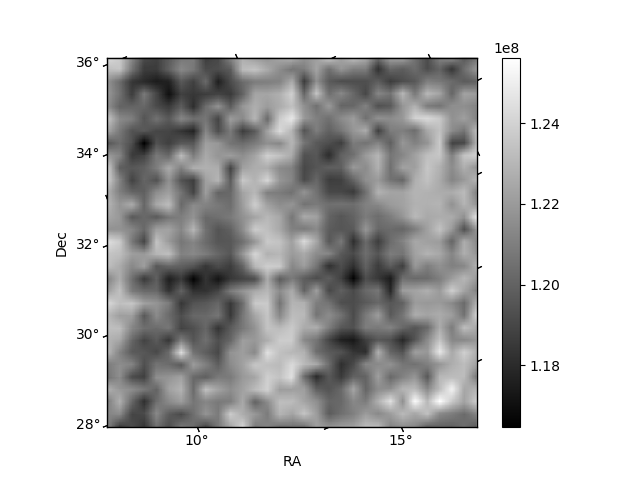
Histogram calculated using DETX and DETY for each event in the final _common_clean file
| Quadrant A | 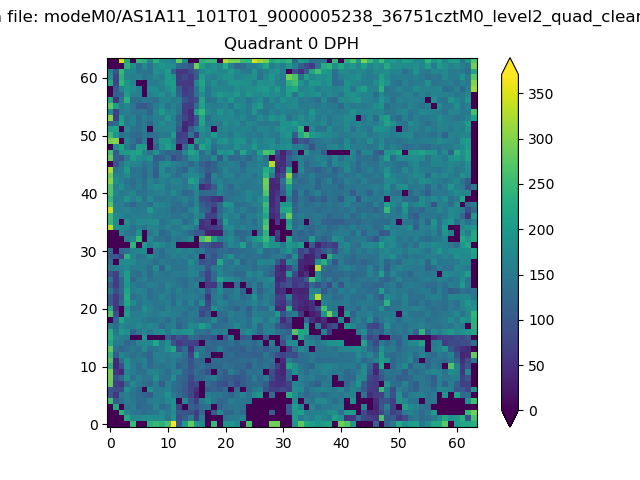 |
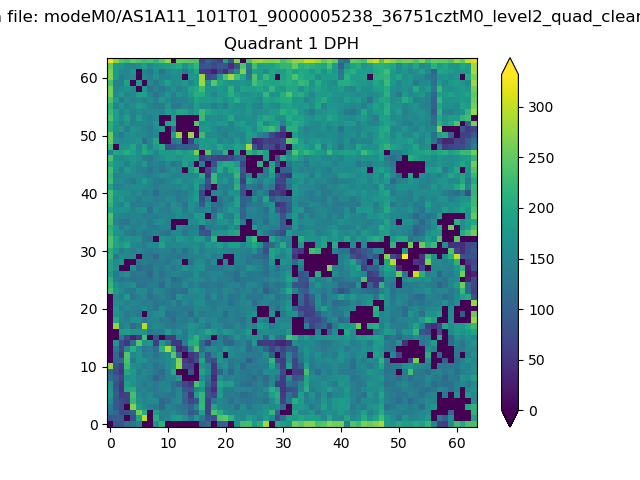 |
Quadrant B |
|---|---|---|---|
| Quadrant D | 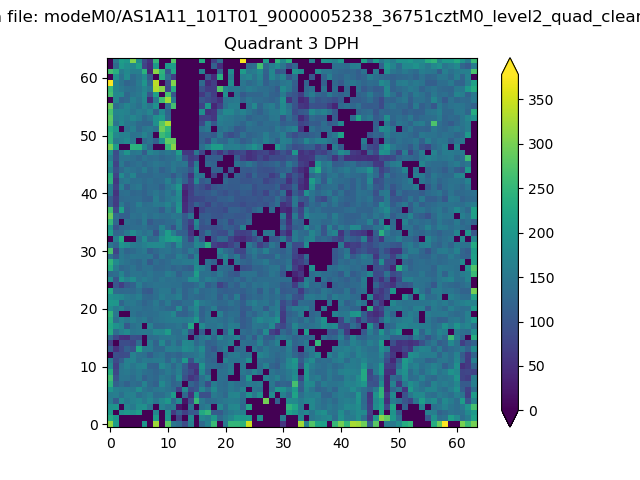 |
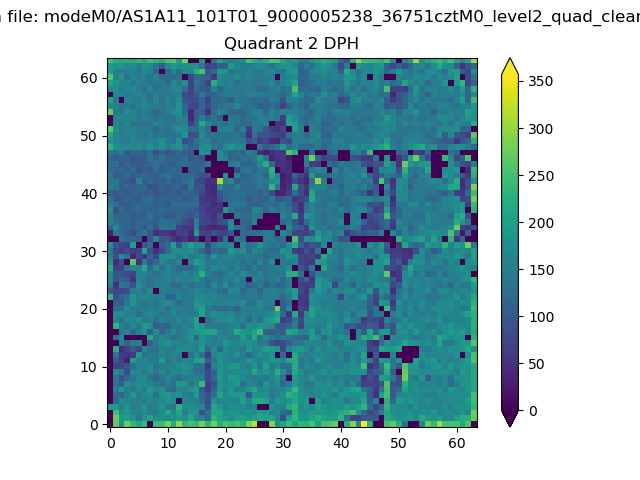 |
Quadrant C |
| Plot type | Count rate plots | Images |
|---|---|---|
| Comparison with Poisson distribution Blue bars denote a histogram of data divided into 1 sec bins. Red curve is a Poisson curve with rate = median count rate of data. |
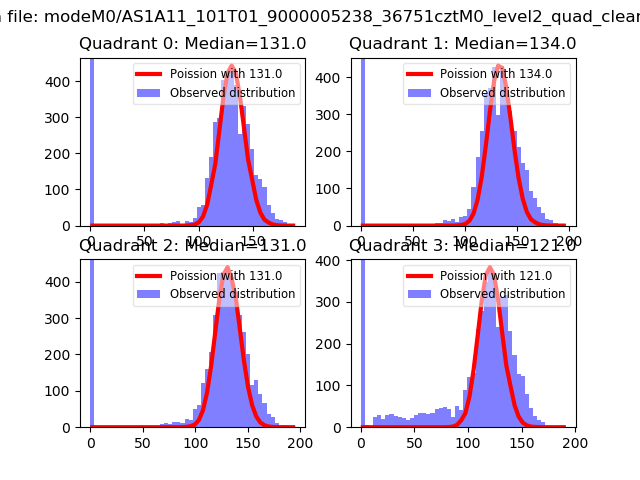 |
 |
| Quadrant-wise count rates Data is divided into 100 sec bins |
 |
|
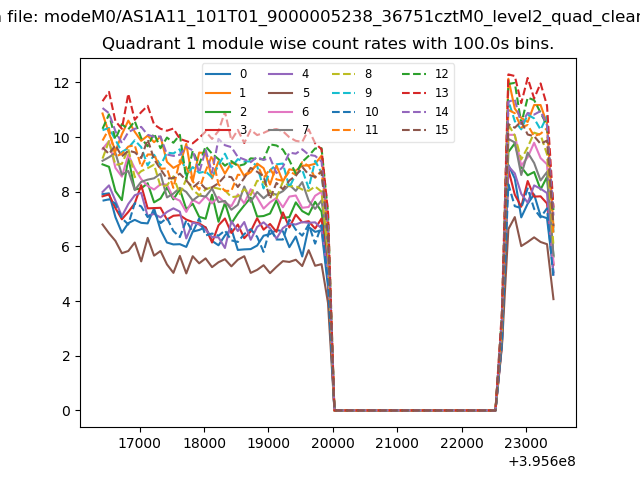
| Module-wise count rates for Quadrant A Data is divided into 100 sec bins |
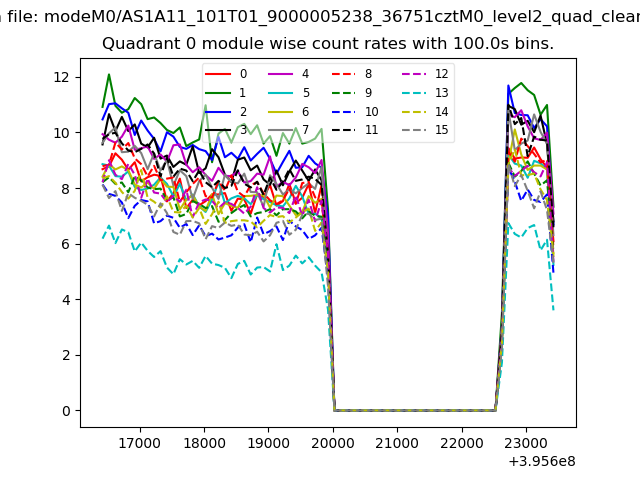 |
 |
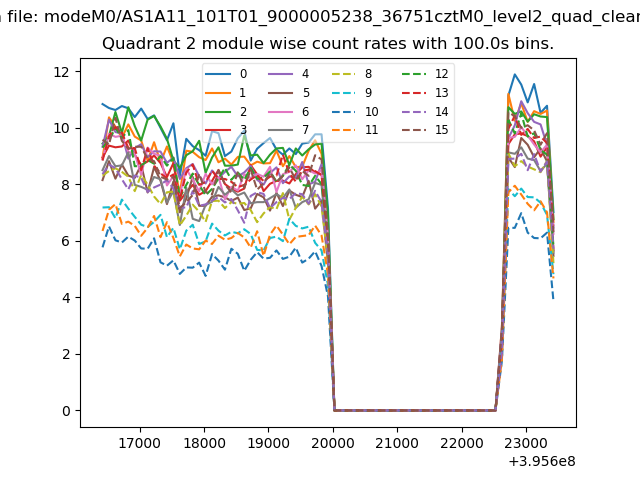
| Module-wise count rates for Quadrant B Data is divided into 100 sec bins |
 |
 |
| Module-wise count rates for Quadrant C Data is divided into 100 sec bins |
 |
 |
| Module-wise count rates for Quadrant D Data is divided into 100 sec bins |
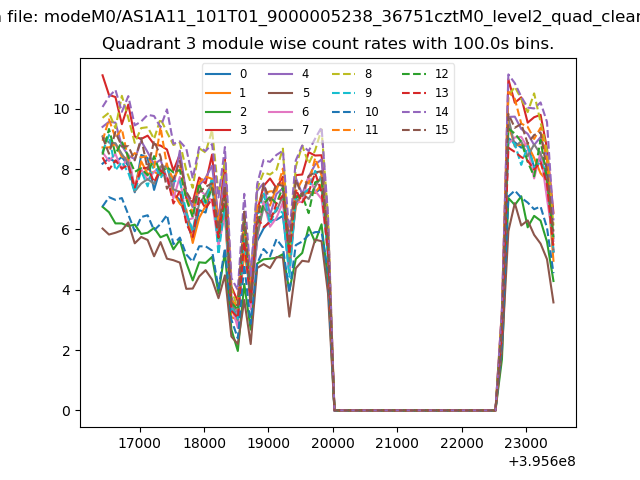 |
 |
| Parameter | Plot |
|---|---|
| CZT HV Monitor | 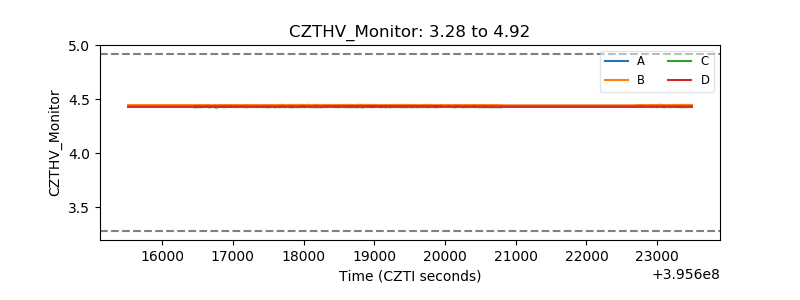 |
| D_VDD | 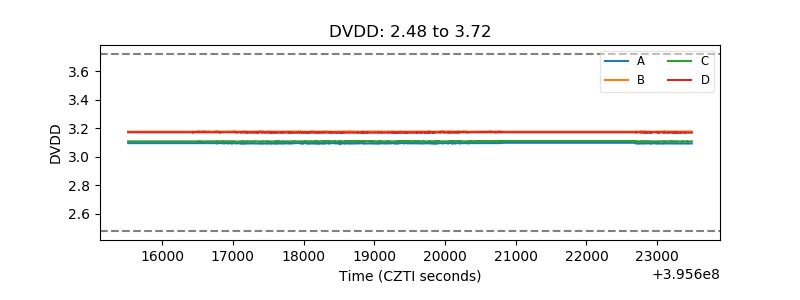 |
| Temperature 1 | 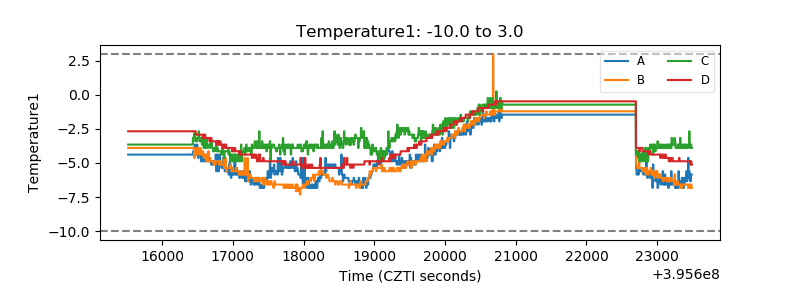 |
| Veto HV Monitor | 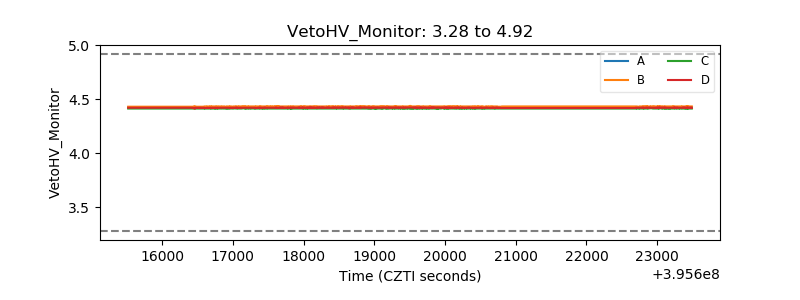 |
| Veto LLD | 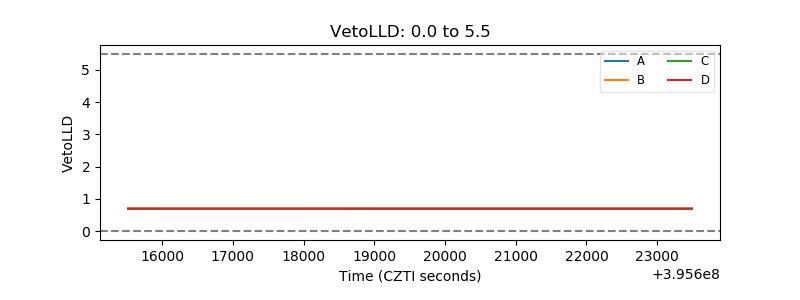 |
| Alpha Counter |  |
| _CPM_Rate | 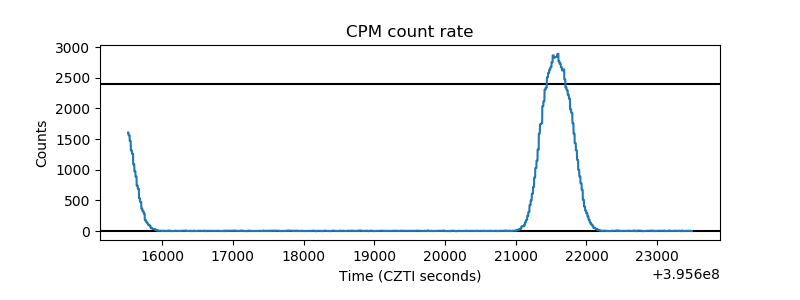 |
| CZT Counter | 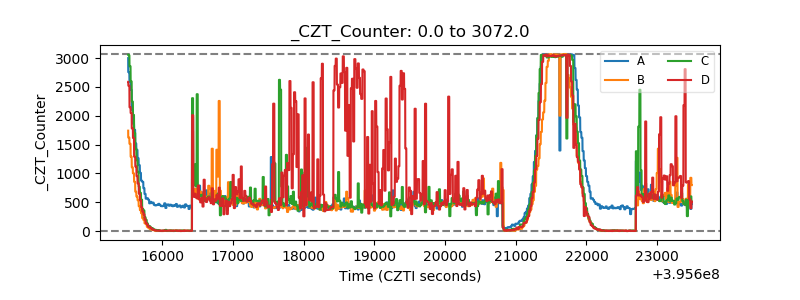 |
| +2.5 Volts monitor | 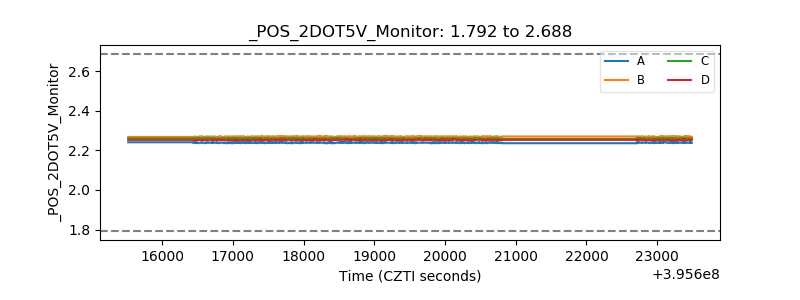 |
| +5 Volts monitor |  |
| _ROLL_ROT | 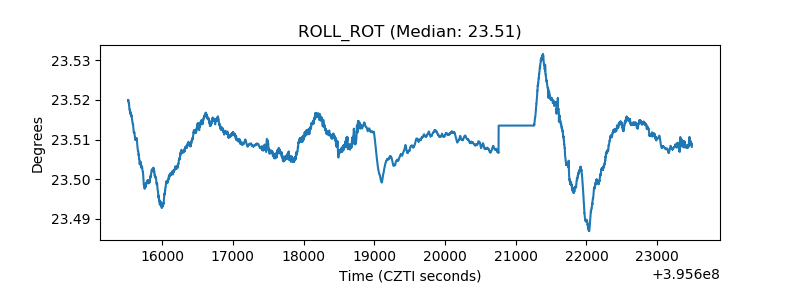 |
| _Roll_DEC | 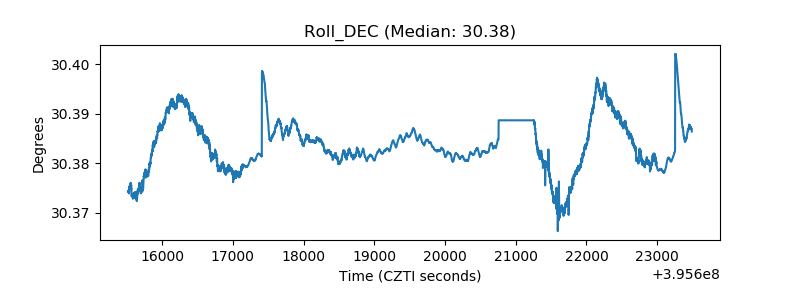 |
| _Roll_RA | 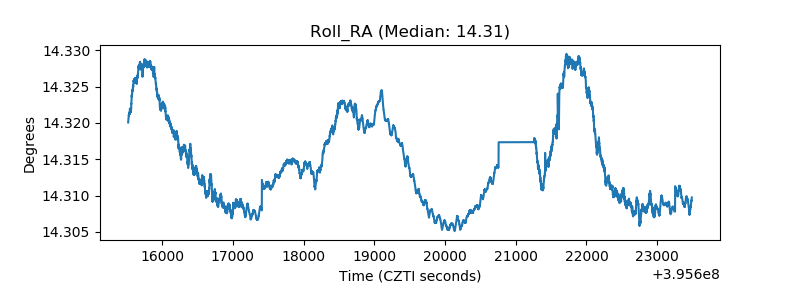 |
| Veto Counter | 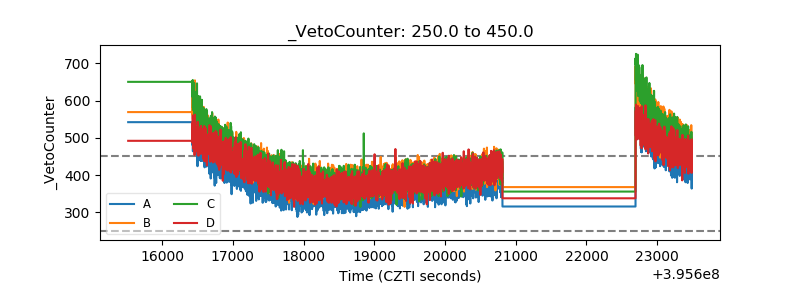 |