| Param | Original file | Final file |
|---|---|---|
| Filename | modeM0/AS1A11_101T01_9000005238_36755cztM0_level2.evt | modeM0/AS1A11_101T01_9000005238_36755cztM0_level2_quad_clean.evt |
| Size (bytes) | 458,838,720 | 44,069,760 |
| Size | 437.6 MB | 42.0 MB |
| Events in quadrant A | 1,934,609 | 350,699 |
| Events in quadrant B | 7,490,431 | 38,980 |
| Events in quadrant C | 2,414,667 | 338,623 |
| Events in quadrant D | 1,799,693 | 339,045 |
| Mode M0 | |||
|---|---|---|---|
| Quadrant | BADHDUFLAG | Total packets | Discarded packets |
| A | 0 | 9978 | 1815 |
| B | 0 | 30920 | 6333 |
| C | 0 | 11795 | 2247 |
| D | 0 | 9905 | 1847 |
| Mode SS | |||
|---|---|---|---|
| Quadrant | BADHDUFLAG | Total packets | Discarded packets |
| A | 0 | 100 | 17 |
| B | 0 | 96 | 16 |
| C | 0 | 97 | 11 |
| D | 0 | 103 | 22 |
| Mode M9 | |||
|---|---|---|---|
| Quadrant | BADHDUFLAG | Total packets | Discarded packets |
| A | 0 | 20 | 0 |
| B | 0 | 21 | 1 |
| C | 0 | 22 | 1 |
| D | 0 | 22 | 1 |
| Quadrant | Total seconds | Saturated seconds | Saturation percentage |
|---|---|---|---|
| A | 3840 | 11 | 0.286458% |
| B | 3489 | 3355 | 96.159358% |
| C | 3812 | 178 | 4.669465% |
| D | 3821 | 13 | 0.340225% |
Noise dominated data is calculated using 1-second bins in cleaned event files. If a bin has >2000 counts, and if more than 50% of those come from <1% of pixels, then it is considered to be noise-dominated and hence unusable.
| Quadrant | # 1 sec bins | Bins with >0 counts | Bins with >2000 counts | High rate bins dominated by noise | Noise dominated (total time) | Noise dominated (detector-on time) | Marked lightcurve |
|---|---|---|---|---|---|---|---|
| A | 7225 | 4110 | 8 | 8 | 0.11% | 0.19% | 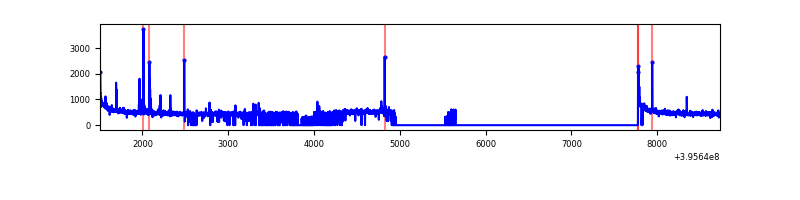 |
| B | 7224 | 3493 | 2529 | 2529 | 35.01% | 72.40% | 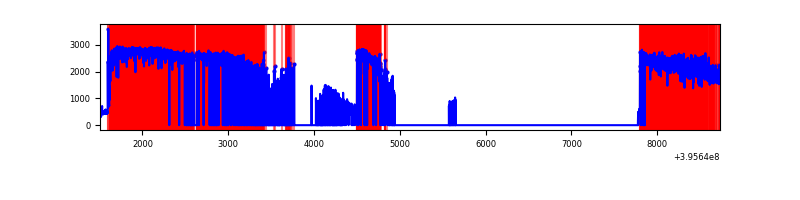 |
| C | 7225 | 4063 | 141 | 141 | 1.95% | 3.47% | 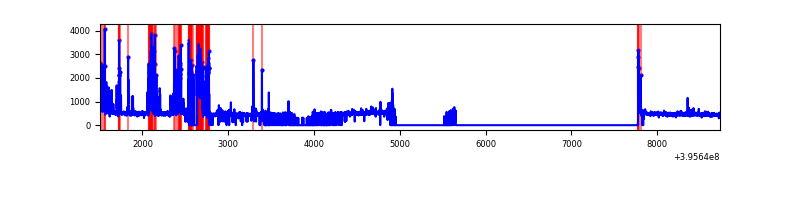 |
| D | 7226 | 4096 | 12 | 12 | 0.17% | 0.29% | 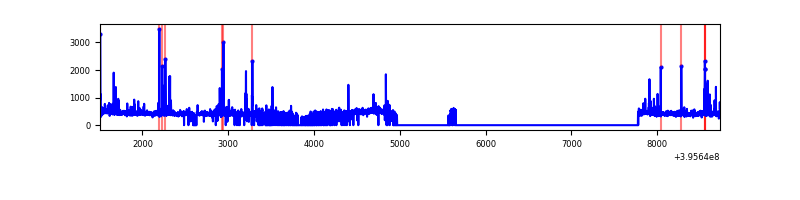 |
Top three noisy pixels from each quadrant. If the there are fewer than three noisy pixels in the level2.evt file, extra rows are filled as -1
| Pixel properties | Quadrant properties | ||||||
|---|---|---|---|---|---|---|---|
| Quadrant | DetID | PixID | Counts | Sigma | Mean | Median | Sigma |
| A | 10 | 83 | 183659 | 2064.45 | 435 | 428 | 88.8 |
| A | 9 | 143 | 54104 | 604.76 | 435 | 428 | 88.8 |
| A | 13 | 254 | 5537 | 57.56 | 435 | 428 | 88.8 |
| B | 12 | 1 | 7241424 | 598089.13 | 53 | 52 | 12.1 |
| B | 4 | 171 | 22589 | 1861.41 | 53 | 52 | 12.1 |
| B | 12 | 144 | 4191 | 341.85 | 53 | 52 | 12.1 |
| C | 14 | 254 | 553455 | 5870.96 | 406 | 409 | 94.2 |
| C | 15 | 214 | 164183 | 1738.57 | 406 | 409 | 94.2 |
| C | 0 | 10 | 102215 | 1080.74 | 406 | 409 | 94.2 |
| D | 13 | 249 | 82107 | 802.83 | 415 | 403 | 101.8 |
| D | 2 | 250 | 22276 | 214.93 | 415 | 403 | 101.8 |
| D | 12 | 6 | 21043 | 202.81 | 415 | 403 | 101.8 |
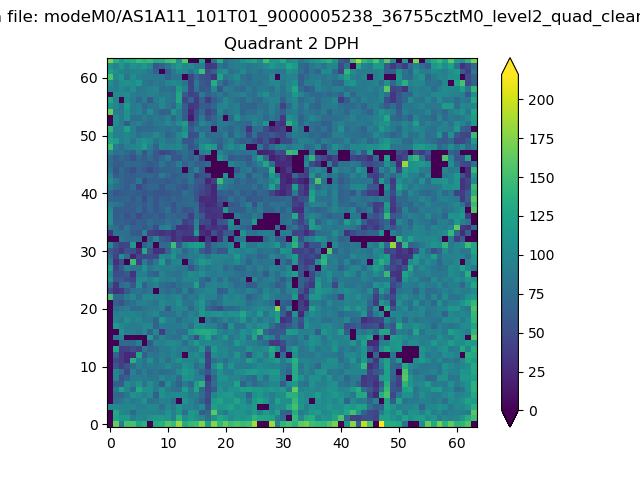
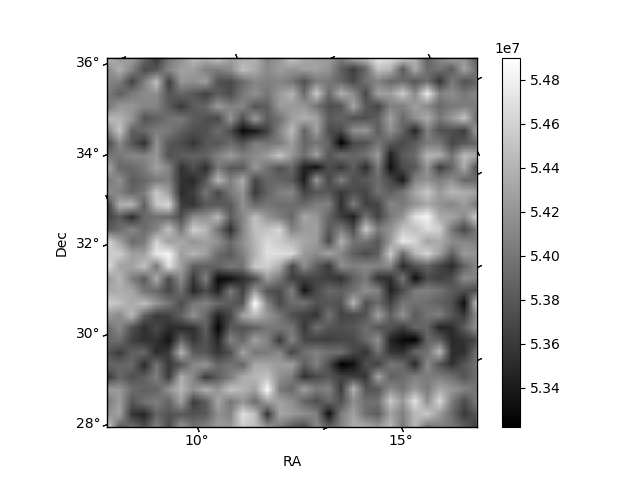
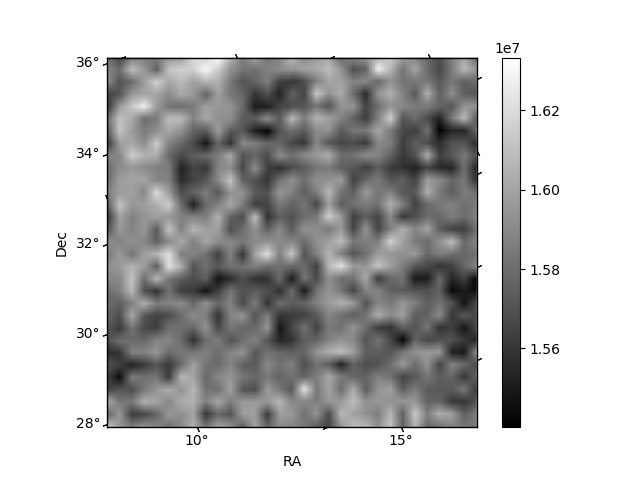
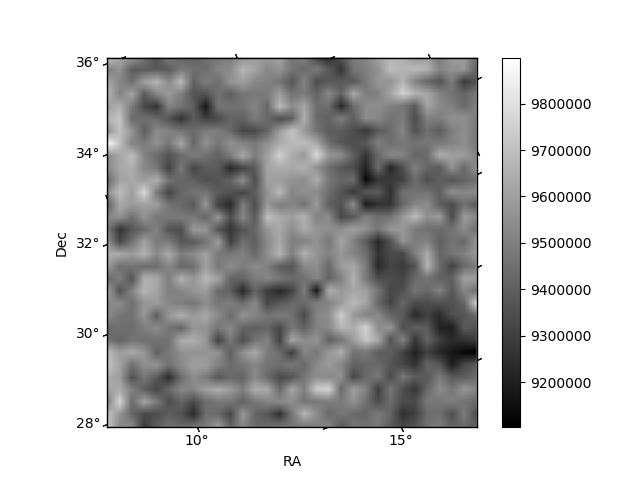
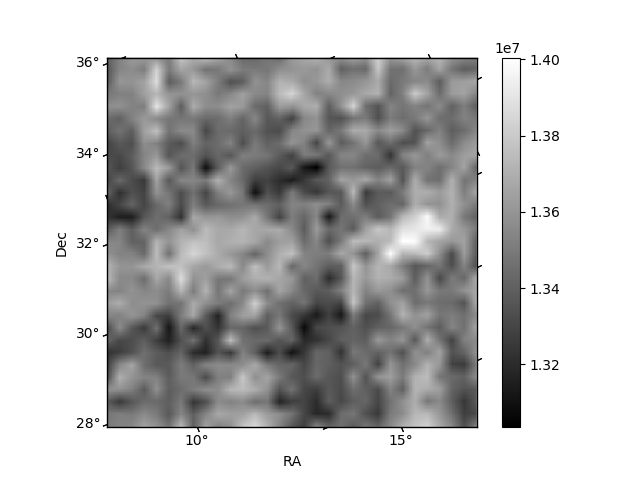
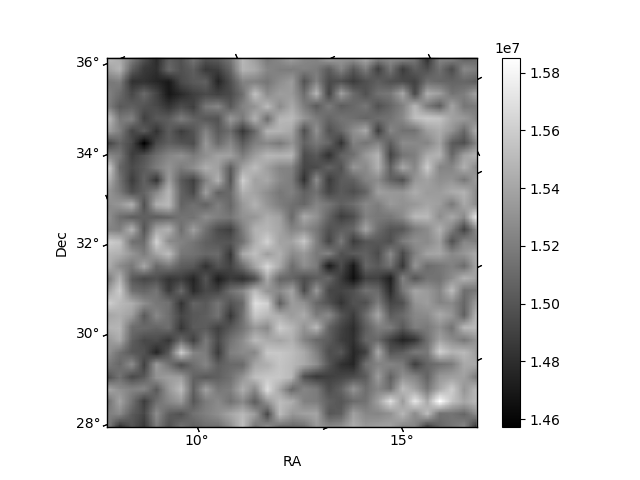
Histogram calculated using DETX and DETY for each event in the final _common_clean file
| Quadrant A | 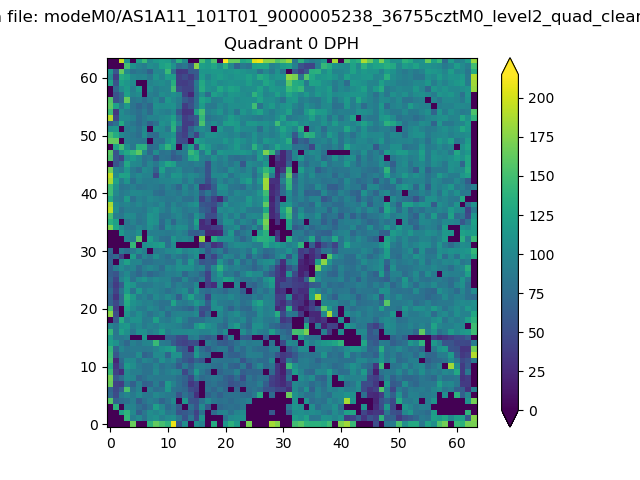 |
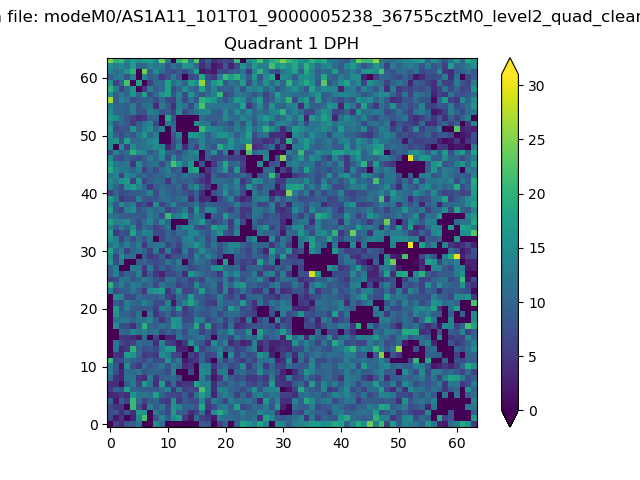 |
Quadrant B |
|---|---|---|---|
| Quadrant D | 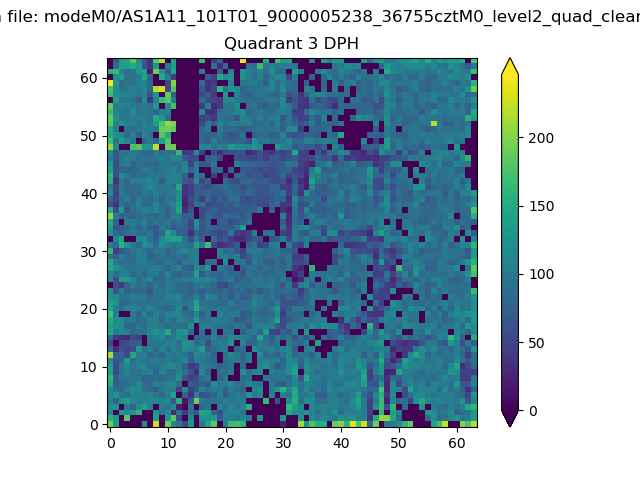 |
 |
Quadrant C |
| Plot type | Count rate plots | Images |
|---|---|---|
| Comparison with Poisson distribution Blue bars denote a histogram of data divided into 1 sec bins. Red curve is a Poisson curve with rate = median count rate of data. |
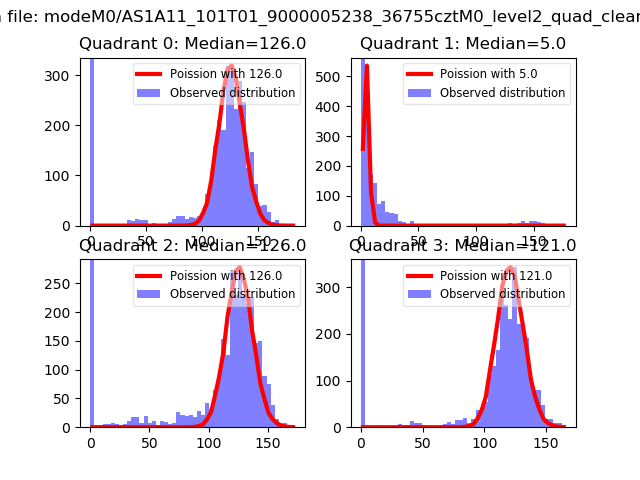 |
 |
| Quadrant-wise count rates Data is divided into 100 sec bins |
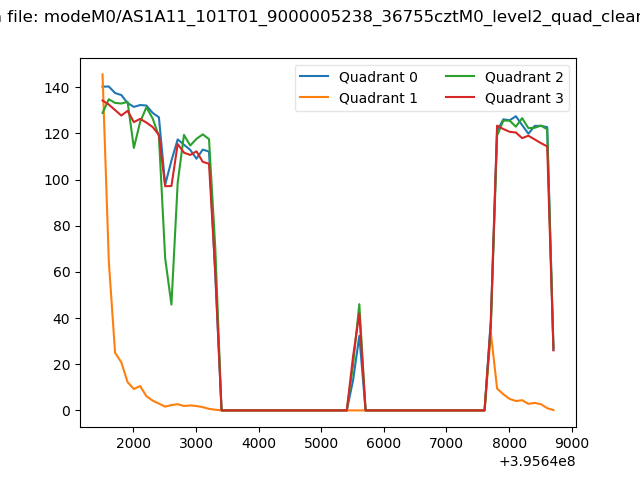 |
|
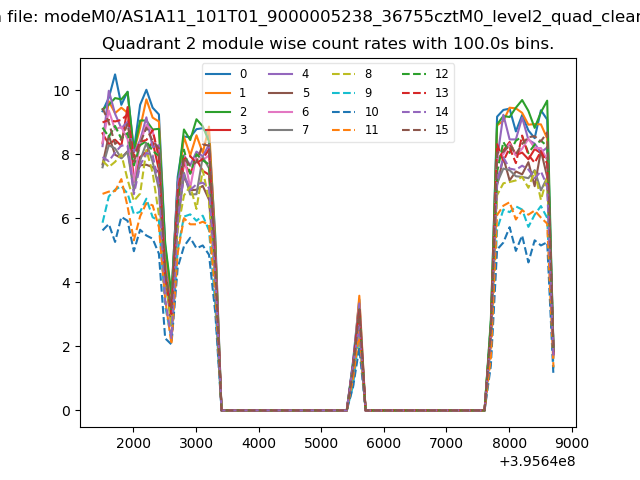
| Module-wise count rates for Quadrant A Data is divided into 100 sec bins |
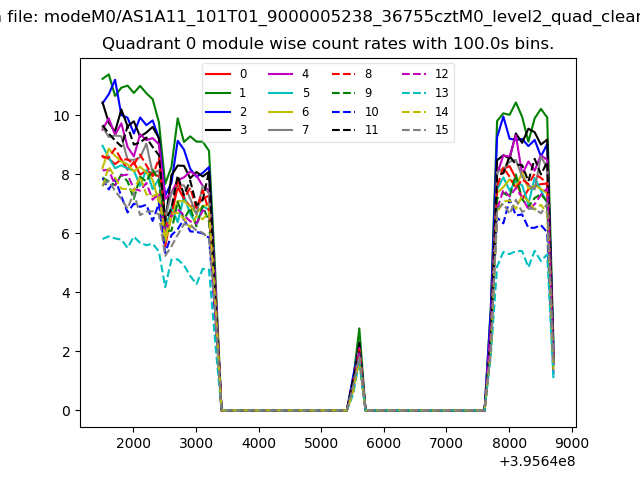 |
 |
| Module-wise count rates for Quadrant B Data is divided into 100 sec bins |
 |
 |
| Module-wise count rates for Quadrant C Data is divided into 100 sec bins |
 |
 |
| Module-wise count rates for Quadrant D Data is divided into 100 sec bins |
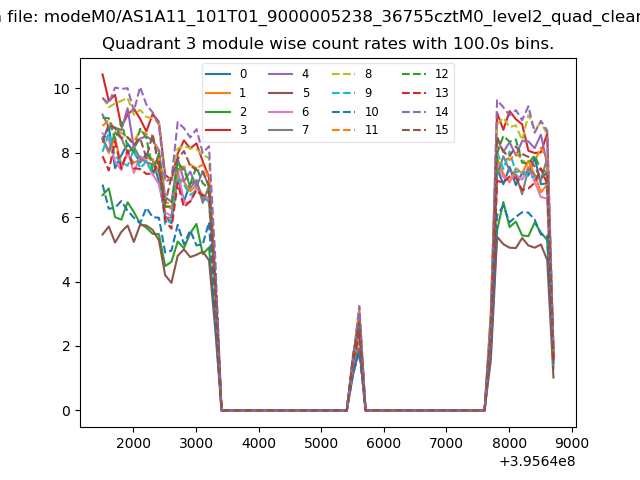 |
 |
| Parameter | Plot |
|---|---|
| CZT HV Monitor | 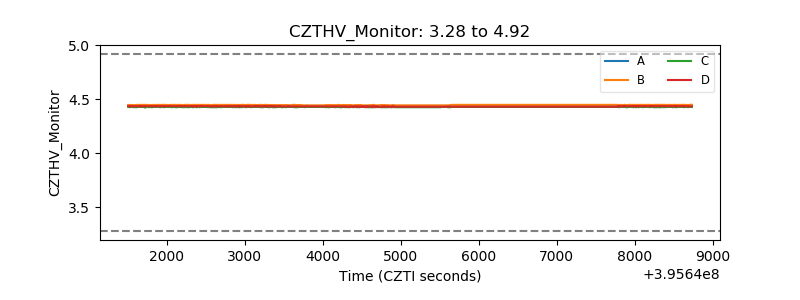 |
| D_VDD | 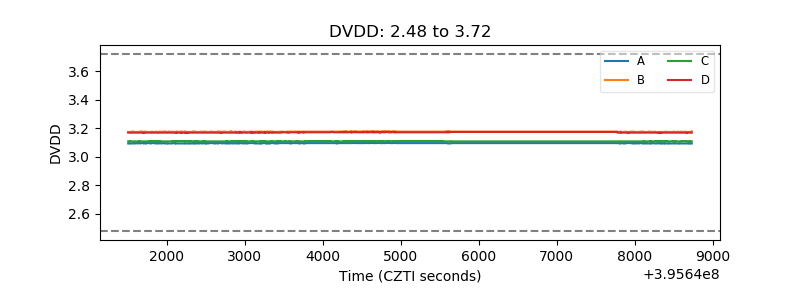 |
| Temperature 1 | 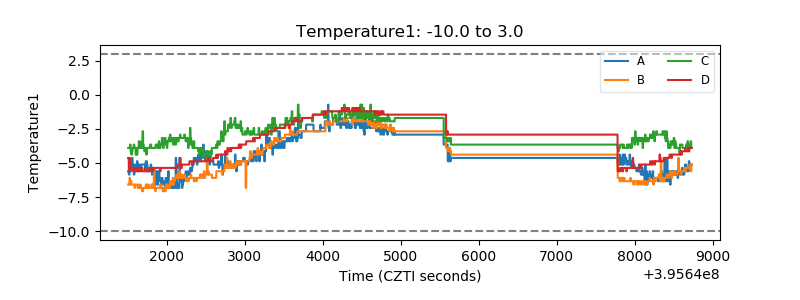 |
| Veto HV Monitor | 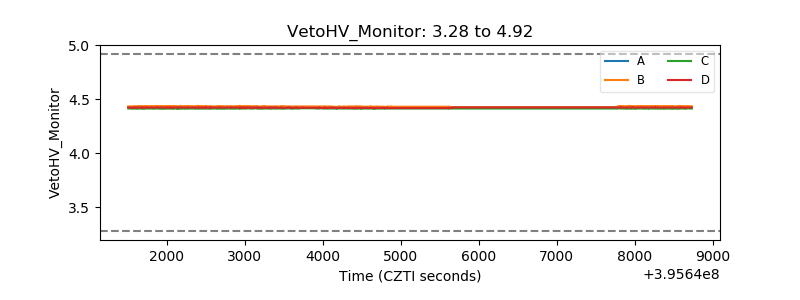 |
| Veto LLD | 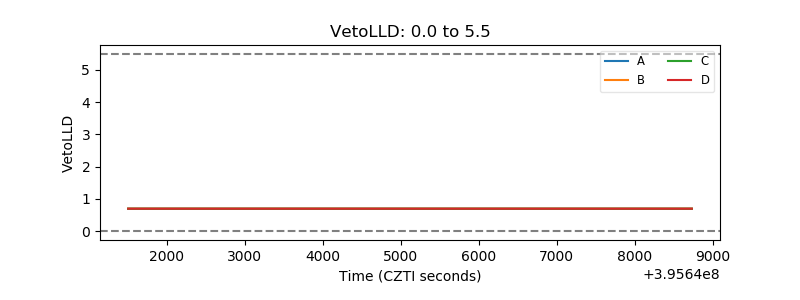 |
| Alpha Counter | 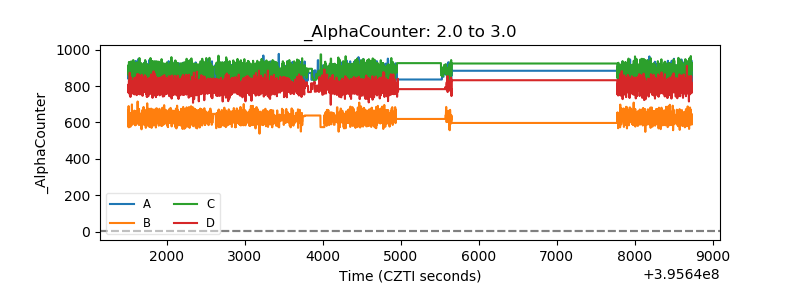 |
| _CPM_Rate | 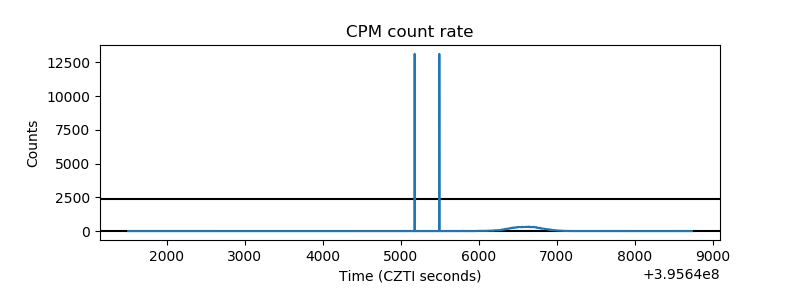 |
| CZT Counter | 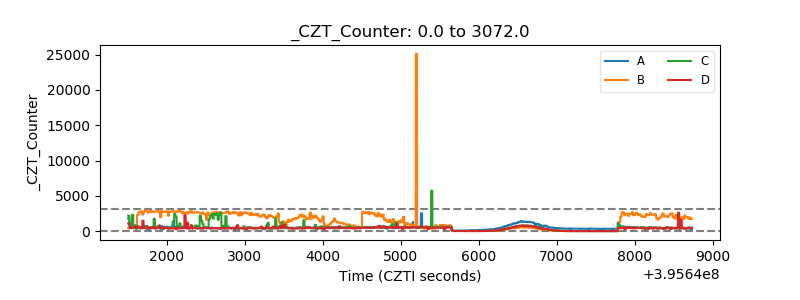 |
| +2.5 Volts monitor |  |
| +5 Volts monitor | 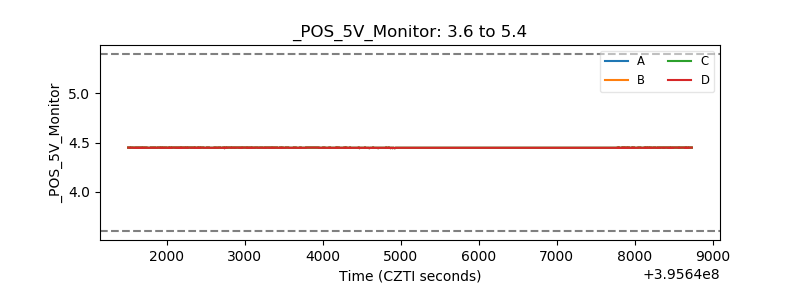 |
| _ROLL_ROT | 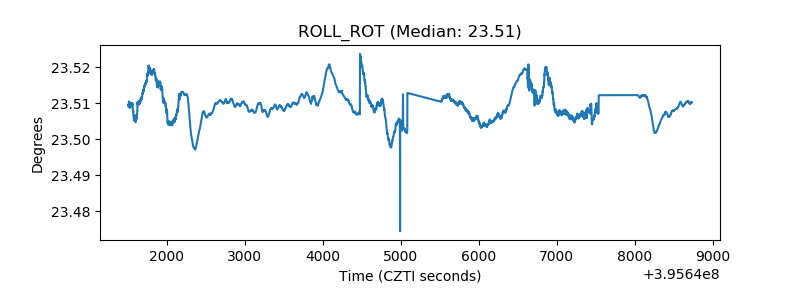 |
| _Roll_DEC | 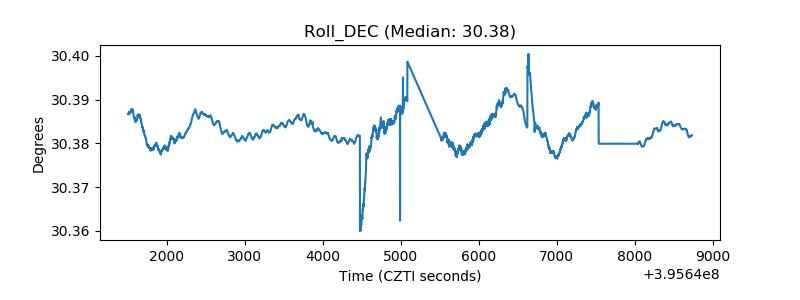 |
| _Roll_RA | 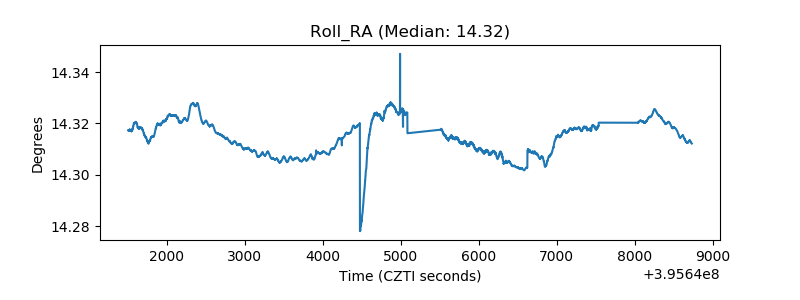 |
| Veto Counter | 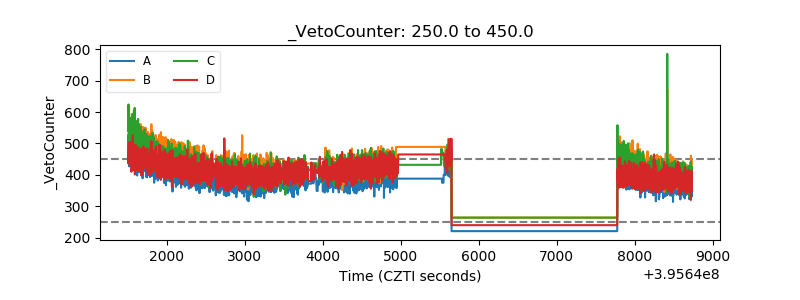 |