| Param | Original file | Final file |
|---|---|---|
| Filename | modeM0/AS1A11_101T01_9000005238_36756cztM0_level2.evt | modeM0/AS1A11_101T01_9000005238_36756cztM0_level2_quad_clean.evt |
| Size (bytes) | 381,859,200 | 33,840,000 |
| Size | 364.2 MB | 32.3 MB |
| Events in quadrant A | 1,972,973 | 248,657 |
| Events in quadrant B | 5,226,176 | 8,030 |
| Events in quadrant C | 2,033,643 | 243,765 |
| Events in quadrant D | 2,051,319 | 234,801 |
| Mode M0 | |||
|---|---|---|---|
| Quadrant | BADHDUFLAG | Total packets | Discarded packets |
| A | 0 | 9885 | 1452 |
| B | 0 | 26194 | 8015 |
| C | 0 | 10303 | 1749 |
| D | 0 | 10508 | 1532 |
| Mode SS | |||
|---|---|---|---|
| Quadrant | BADHDUFLAG | Total packets | Discarded packets |
| A | 0 | 101 | 11 |
| B | 0 | 97 | 11 |
| C | 0 | 101 | 13 |
| D | 0 | 100 | 13 |
| Mode M9 | |||
|---|---|---|---|
| Quadrant | BADHDUFLAG | Total packets | Discarded packets |
| A | 0 | 18 | 2 |
| B | 0 | 17 | 2 |
| C | 0 | 18 | 2 |
| D | 0 | 18 | 1 |
| Quadrant | Total seconds | Saturated seconds | Saturation percentage |
|---|---|---|---|
| A | 4164 | 3 | 0.072046% |
| B | 3842 | 3812 | 99.219157% |
| C | 4132 | 6 | 0.145208% |
| D | 4131 | 18 | 0.435730% |
Noise dominated data is calculated using 1-second bins in cleaned event files. If a bin has >2000 counts, and if more than 50% of those come from <1% of pixels, then it is considered to be noise-dominated and hence unusable.
| Quadrant | # 1 sec bins | Bins with >0 counts | Bins with >2000 counts | High rate bins dominated by noise | Noise dominated (total time) | Noise dominated (detector-on time) | Marked lightcurve |
|---|---|---|---|---|---|---|---|
| A | 6759 | 4377 | 0 | 0 | 0.00% | 0.00% | 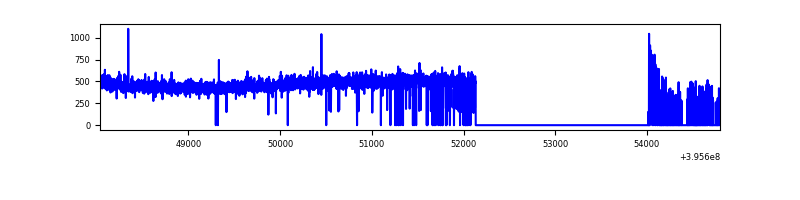 |
| B | 6630 | 3858 | 1076 | 1076 | 16.23% | 27.89% | 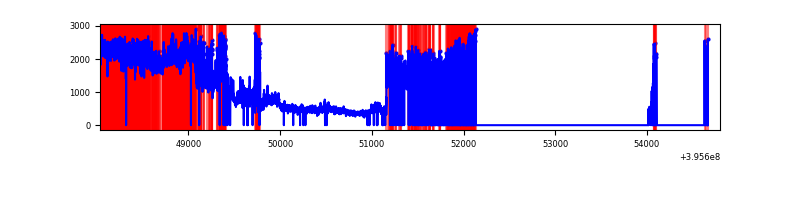 |
| C | 6758 | 4333 | 4 | 4 | 0.06% | 0.09% | 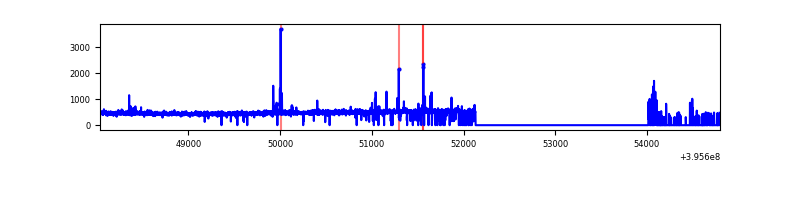 |
| D | 6760 | 4359 | 13 | 13 | 0.19% | 0.30% | 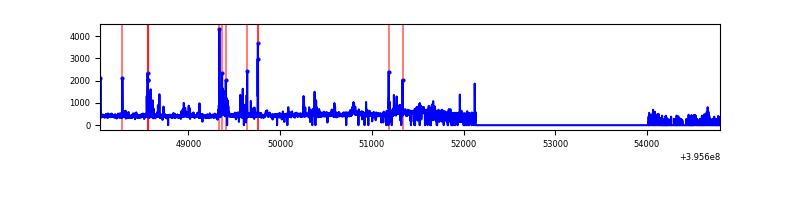 |
Top three noisy pixels from each quadrant. If the there are fewer than three noisy pixels in the level2.evt file, extra rows are filled as -1
| Pixel properties | Quadrant properties | ||||||
|---|---|---|---|---|---|---|---|
| Quadrant | DetID | PixID | Counts | Sigma | Mean | Median | Sigma |
| A | 10 | 83 | 115490 | 1159.67 | 480 | 470 | 99.2 |
| A | 13 | 254 | 6834 | 64.16 | 480 | 470 | 99.2 |
| A | 3 | 137 | 4961 | 45.28 | 480 | 470 | 99.2 |
| B | 12 | 1 | 5133199 | 1003473.08 | 17 | 17 | 5.1 |
| B | 12 | 2 | 10571 | 2063.18 | 17 | 17 | 5.1 |
| B | 12 | 144 | 6436 | 1254.83 | 17 | 17 | 5.1 |
| C | 15 | 214 | 171173 | 1585.35 | 457 | 458 | 107.7 |
| C | 14 | 254 | 55166 | 508.05 | 457 | 458 | 107.7 |
| C | 0 | 10 | 21106 | 191.75 | 457 | 458 | 107.7 |
| D | 2 | 249 | 91035 | 798.58 | 461 | 448 | 113.4 |
| D | 13 | 249 | 86186 | 755.83 | 461 | 448 | 113.4 |
| D | 13 | 171 | 39490 | 344.18 | 461 | 448 | 113.4 |
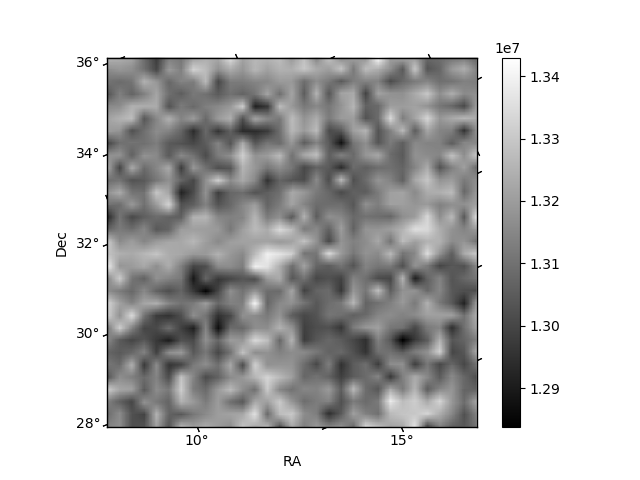
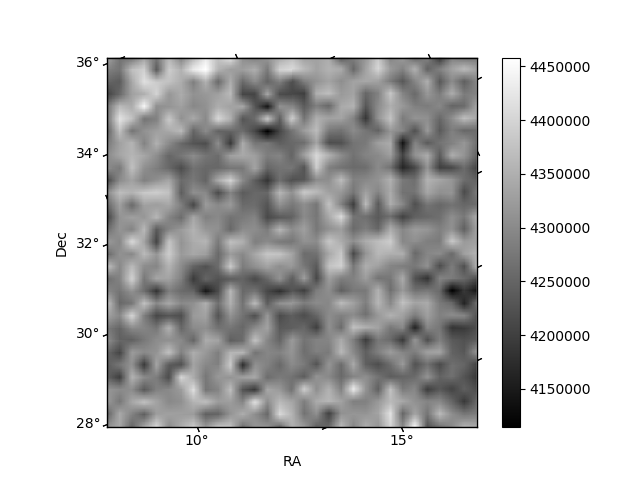
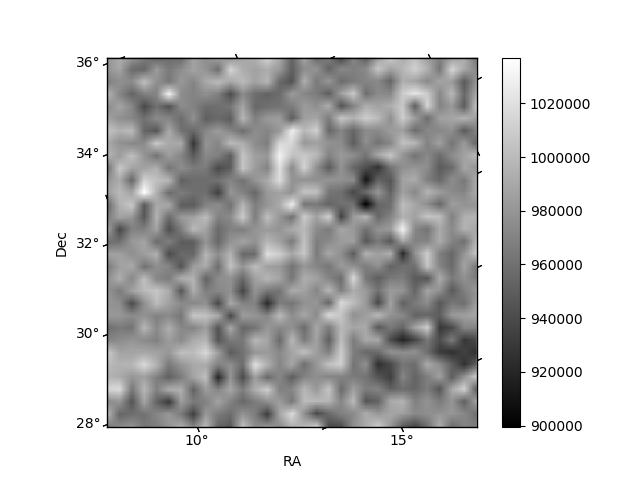
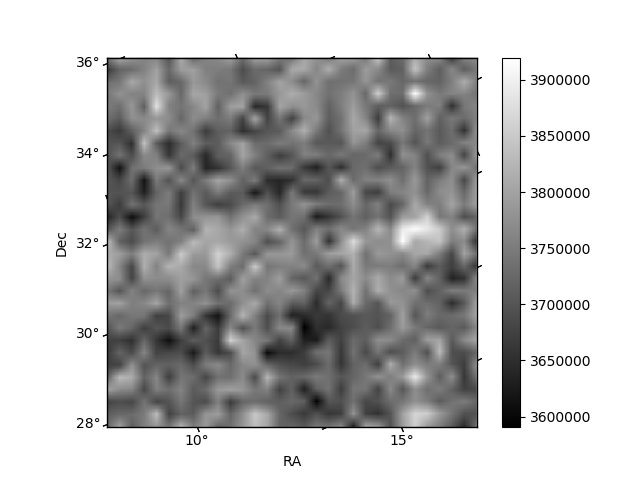
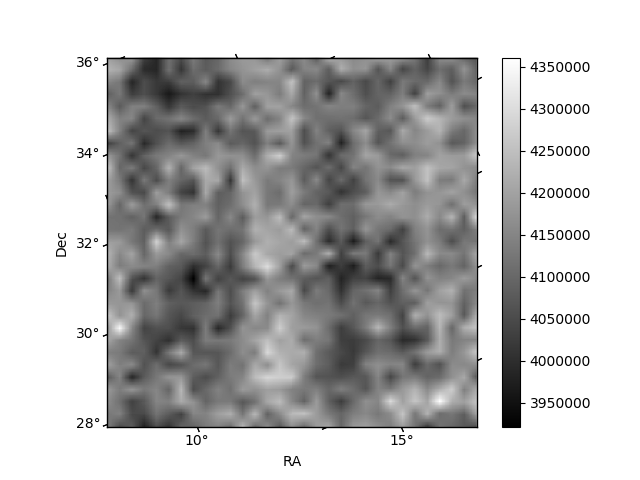
Histogram calculated using DETX and DETY for each event in the final _common_clean file
| Quadrant A | 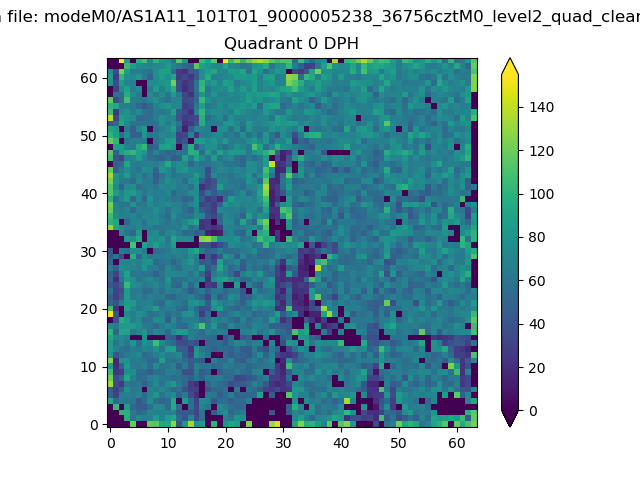 |
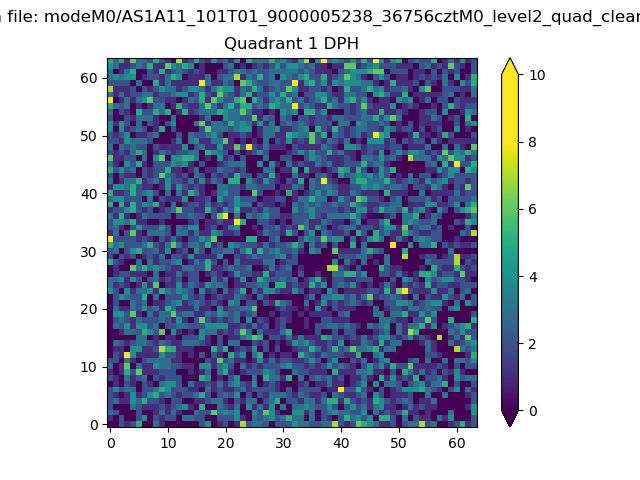 |
Quadrant B |
|---|---|---|---|
| Quadrant D | 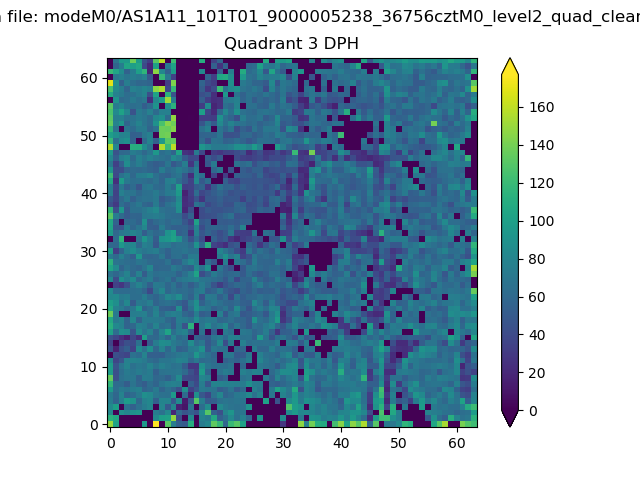 |
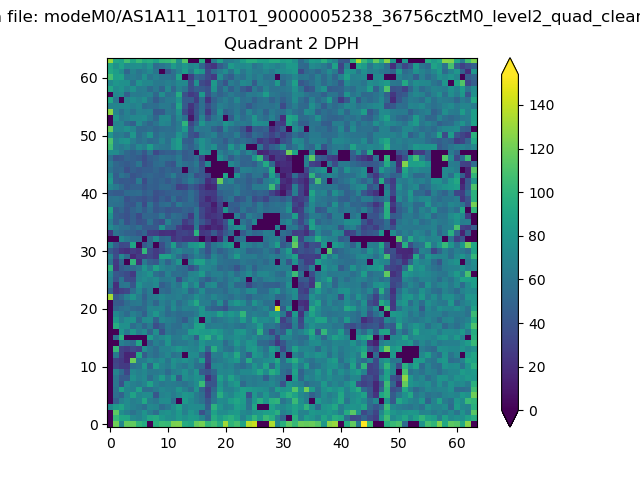 |
Quadrant C |
| Plot type | Count rate plots | Images |
|---|---|---|
| Comparison with Poisson distribution Blue bars denote a histogram of data divided into 1 sec bins. Red curve is a Poisson curve with rate = median count rate of data. |
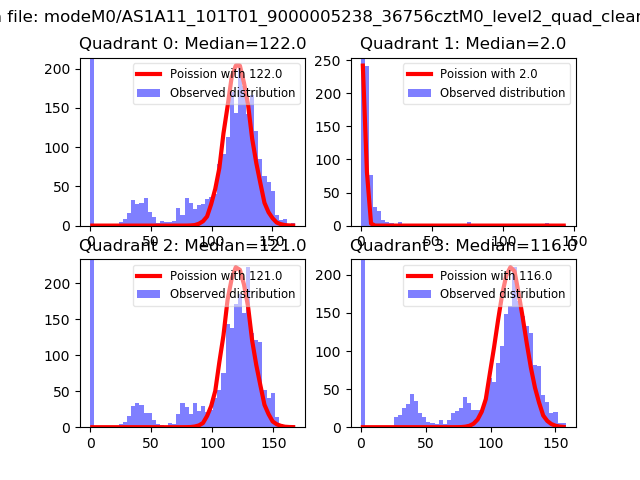 |
 |
| Quadrant-wise count rates Data is divided into 100 sec bins |
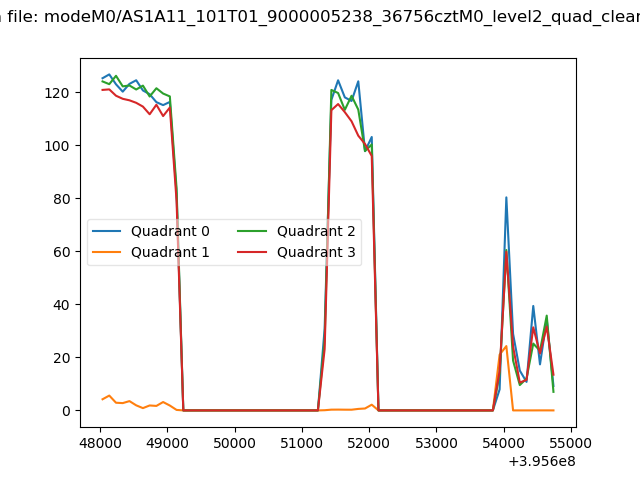 |
|
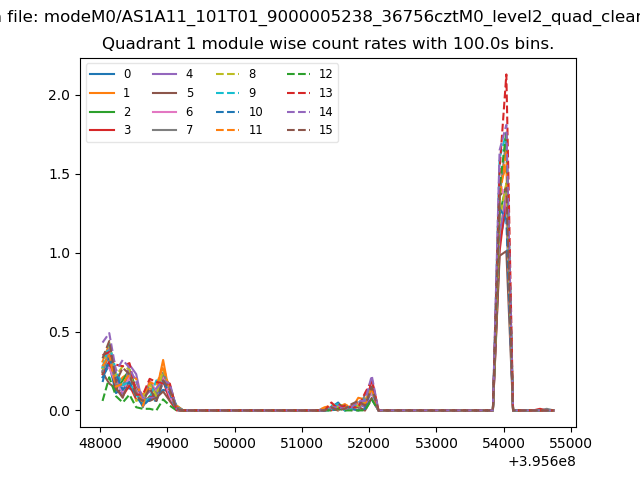
| Module-wise count rates for Quadrant A Data is divided into 100 sec bins |
 |
 |
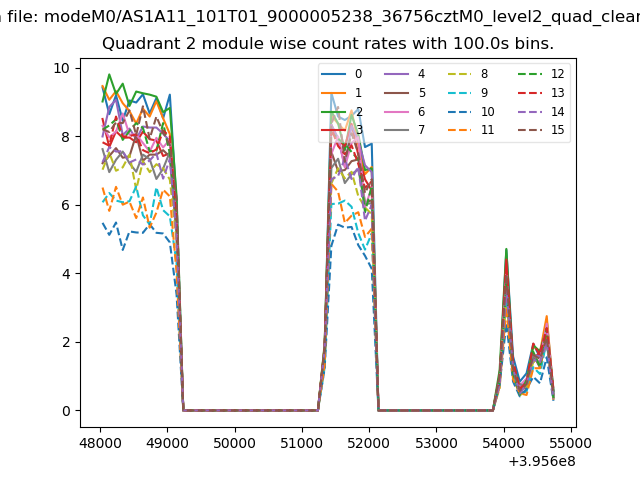
| Module-wise count rates for Quadrant B Data is divided into 100 sec bins |
 |
 |
| Module-wise count rates for Quadrant C Data is divided into 100 sec bins |
 |
 |
| Module-wise count rates for Quadrant D Data is divided into 100 sec bins |
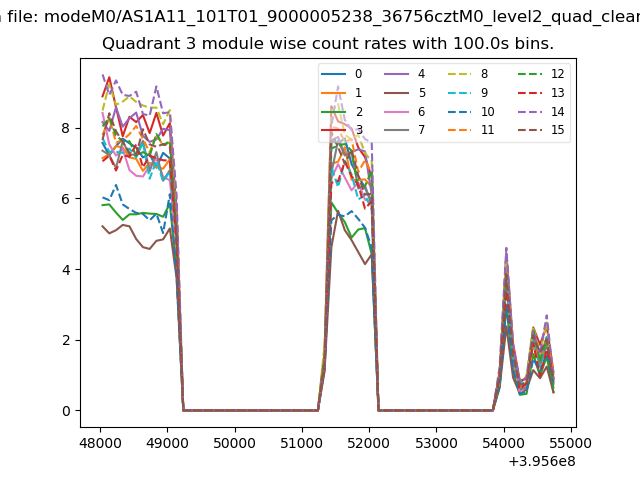 |
 |
| Parameter | Plot |
|---|---|
| CZT HV Monitor | 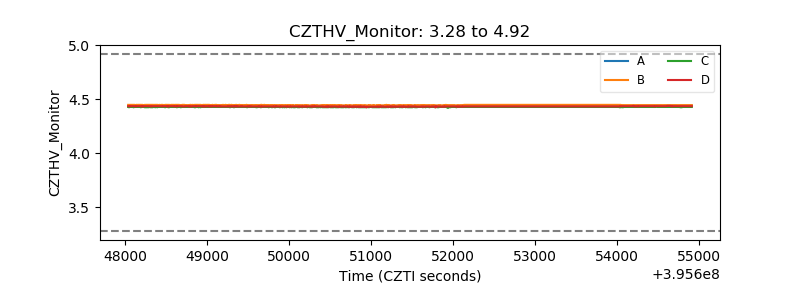 |
| D_VDD | 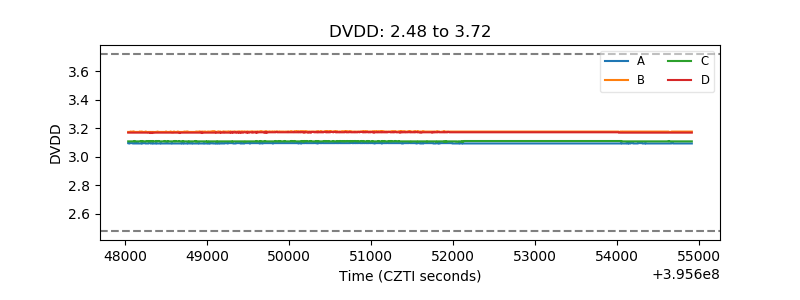 |
| Temperature 1 | 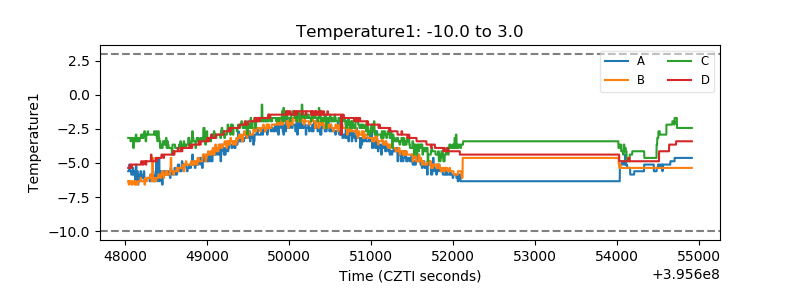 |
| Veto HV Monitor | 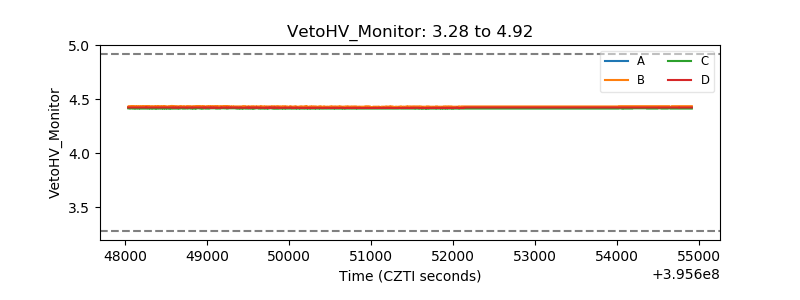 |
| Veto LLD | 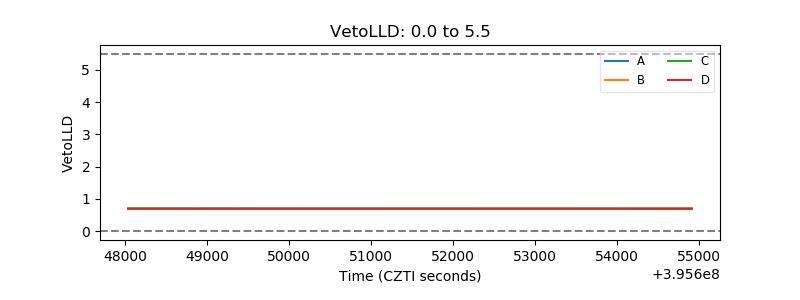 |
| Alpha Counter | 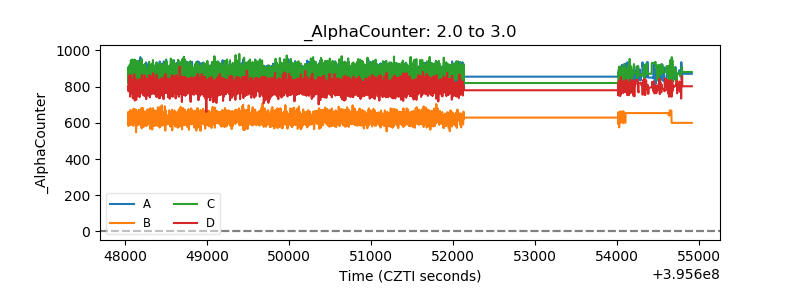 |
| _CPM_Rate | 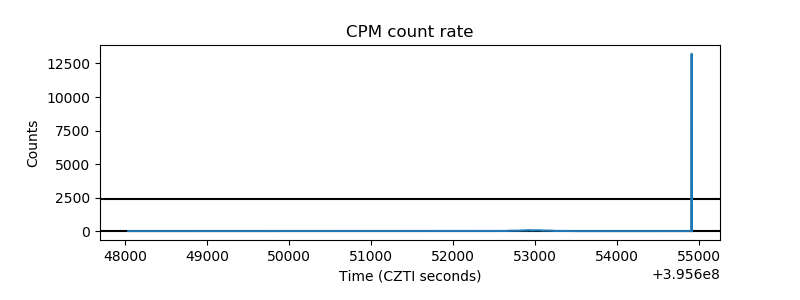 |
| CZT Counter | 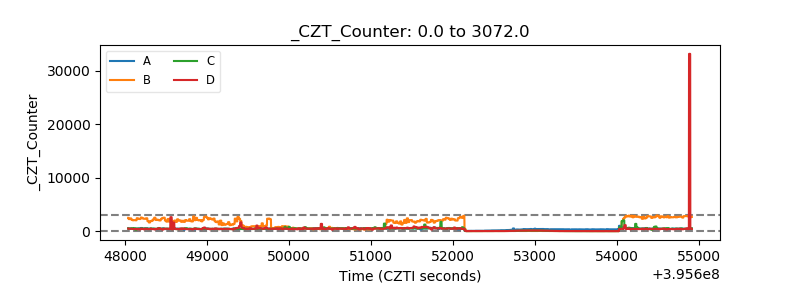 |
| +2.5 Volts monitor |  |
| +5 Volts monitor | 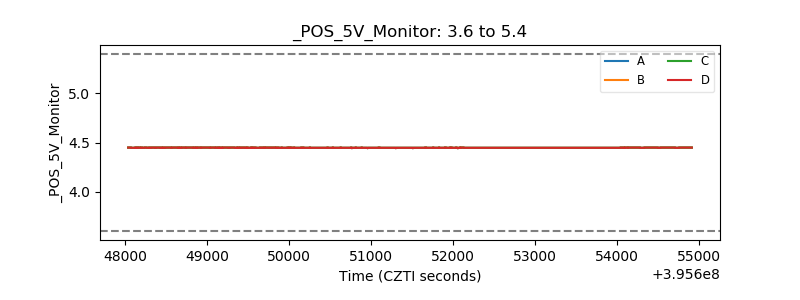 |
| _ROLL_ROT | 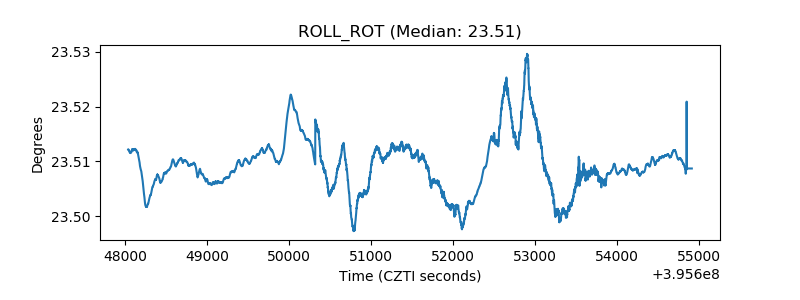 |
| _Roll_DEC | 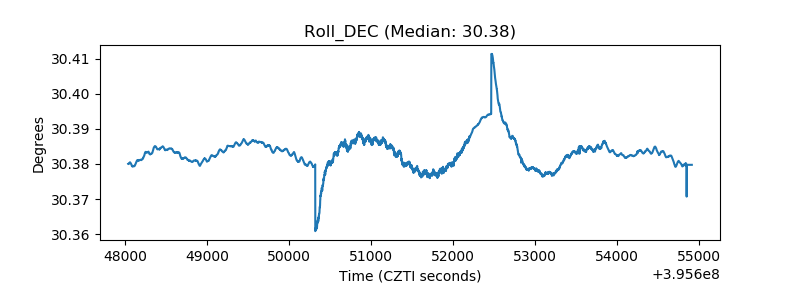 |
| _Roll_RA | 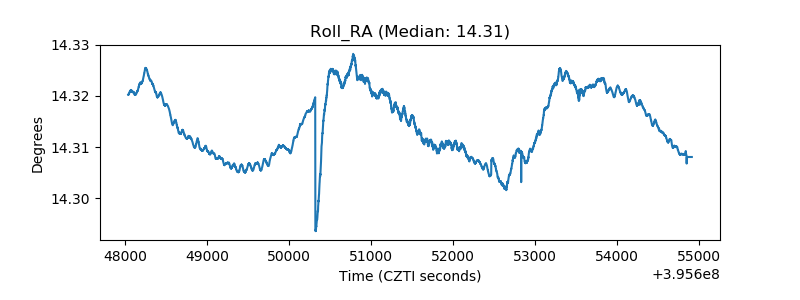 |
| Veto Counter | 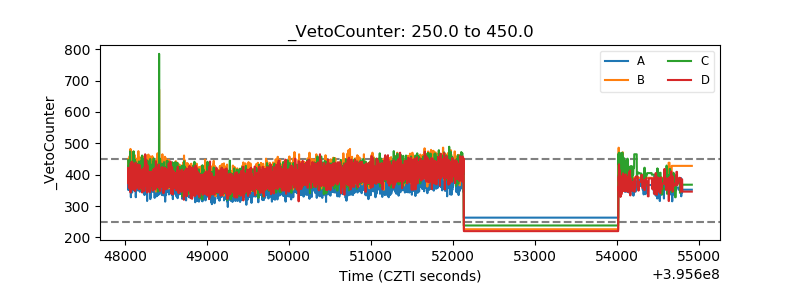 |