| Param | Original file | Final file |
|---|---|---|
| Filename | modeM0/AS1A11_101T01_9000005238_36759cztM0_level2.evt | modeM0/AS1A11_101T01_9000005238_36759cztM0_level2_quad_clean.evt |
| Size (bytes) | 631,088,640 | 47,629,440 |
| Size | 601.9 MB | 45.4 MB |
| Events in quadrant A | 2,991,620 | 345,664 |
| Events in quadrant B | 8,996,607 | 11,906 |
| Events in quadrant C | 3,648,064 | 332,694 |
| Events in quadrant D | 3,062,640 | 326,996 |
| Mode M0 | |||
|---|---|---|---|
| Quadrant | BADHDUFLAG | Total packets | Discarded packets |
| A | 0 | 12623 | 3 |
| B | 0 | 30896 | 2 |
| C | 0 | 14511 | 2 |
| D | 0 | 13238 | 2 |
| Mode SS | |||
|---|---|---|---|
| Quadrant | BADHDUFLAG | Total packets | Discarded packets |
| A | 0 | 122 | 0 |
| B | 0 | 122 | 0 |
| C | 0 | 122 | 0 |
| D | 0 | 122 | 0 |
| Mode M9 | |||
|---|---|---|---|
| Quadrant | BADHDUFLAG | Total packets | Discarded packets |
| A | 0 | 13 | 0 |
| B | 0 | 13 | 0 |
| C | 0 | 13 | 0 |
| D | 0 | 13 | 0 |
| Quadrant | Total seconds | Saturated seconds | Saturation percentage |
|---|---|---|---|
| A | 6063 | 11 | 0.181428% |
| B | 6063 | 5968 | 98.433119% |
| C | 6063 | 75 | 1.237011% |
| D | 6064 | 63 | 1.038918% |
Noise dominated data is calculated using 1-second bins in cleaned event files. If a bin has >2000 counts, and if more than 50% of those come from <1% of pixels, then it is considered to be noise-dominated and hence unusable.
| Quadrant | # 1 sec bins | Bins with >0 counts | Bins with >2000 counts | High rate bins dominated by noise | Noise dominated (total time) | Noise dominated (detector-on time) | Marked lightcurve |
|---|---|---|---|---|---|---|---|
| A | 7346 | 6064 | 3 | 3 | 0.04% | 0.05% | 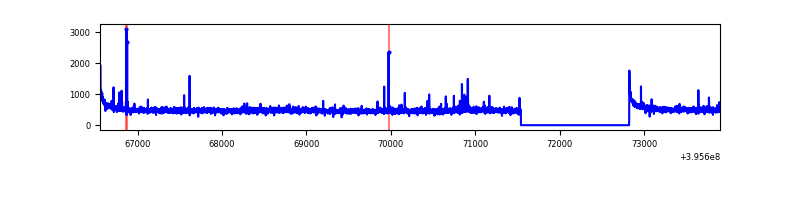 |
| B | 7345 | 6062 | 2497 | 2497 | 34.00% | 41.19% | 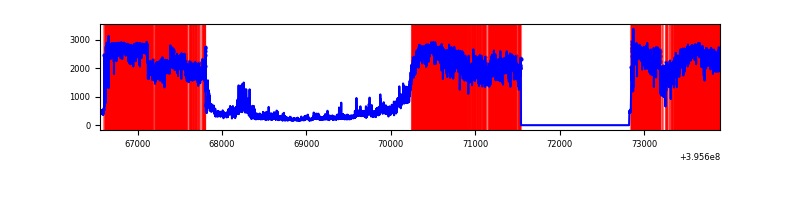 |
| C | 7346 | 6064 | 78 | 78 | 1.06% | 1.29% | 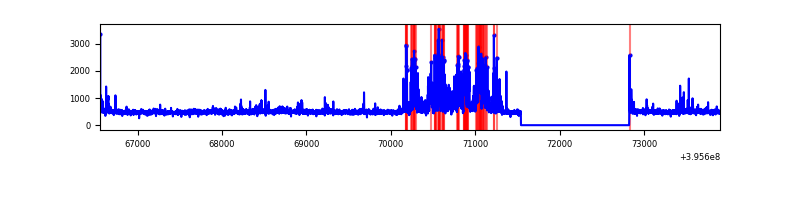 |
| D | 7347 | 6065 | 54 | 54 | 0.73% | 0.89% | 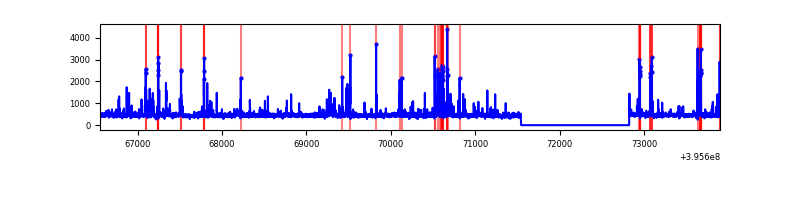 |
Top three noisy pixels from each quadrant. If the there are fewer than three noisy pixels in the level2.evt file, extra rows are filled as -1
| Pixel properties | Quadrant properties | ||||||
|---|---|---|---|---|---|---|---|
| Quadrant | DetID | PixID | Counts | Sigma | Mean | Median | Sigma |
| A | 10 | 83 | 240718 | 1700.36 | 695 | 680 | 141.2 |
| A | 9 | 143 | 47974 | 335.02 | 695 | 680 | 141.2 |
| A | 13 | 6 | 13783 | 92.82 | 695 | 680 | 141.2 |
| B | 12 | 1 | 8753526 | 880526.0 | 41 | 40 | 9.9 |
| B | 12 | 2 | 41131 | 4133.4 | 41 | 40 | 9.9 |
| B | 4 | 171 | 9631 | 964.77 | 41 | 40 | 9.9 |
| C | 14 | 254 | 729222 | 4674.12 | 668 | 672 | 155.9 |
| C | 15 | 214 | 261788 | 1675.23 | 668 | 672 | 155.9 |
| C | 0 | 10 | 25035 | 156.3 | 668 | 672 | 155.9 |
| D | 13 | 249 | 181767 | 1082.26 | 672 | 652 | 167.3 |
| D | 2 | 250 | 98101 | 582.31 | 672 | 652 | 167.3 |
| D | 13 | 171 | 53807 | 317.63 | 672 | 652 | 167.3 |
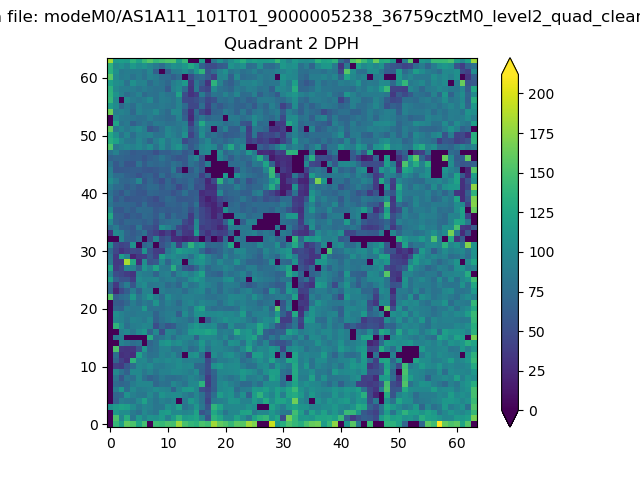
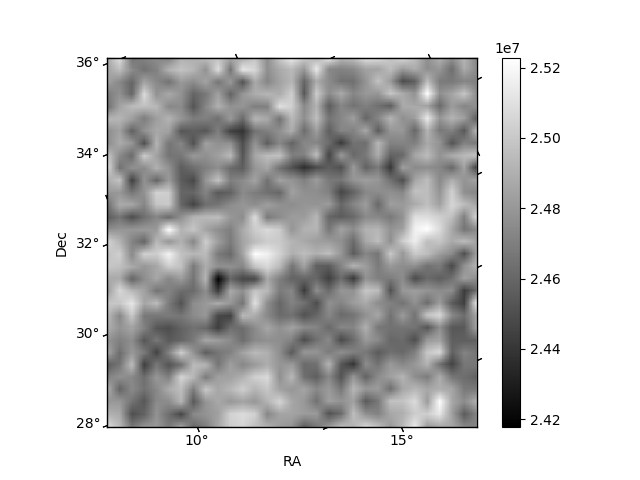
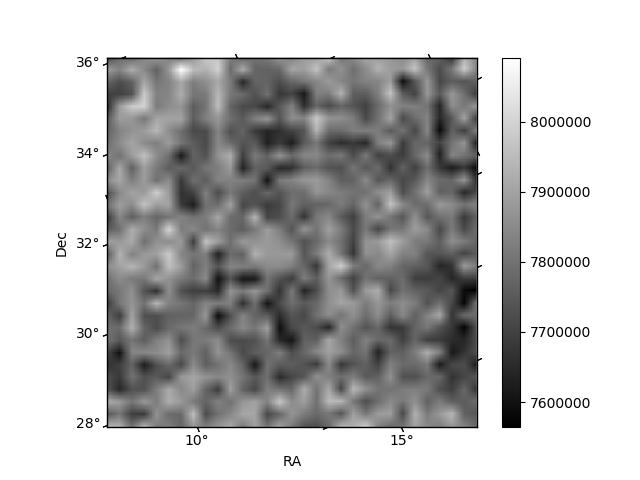
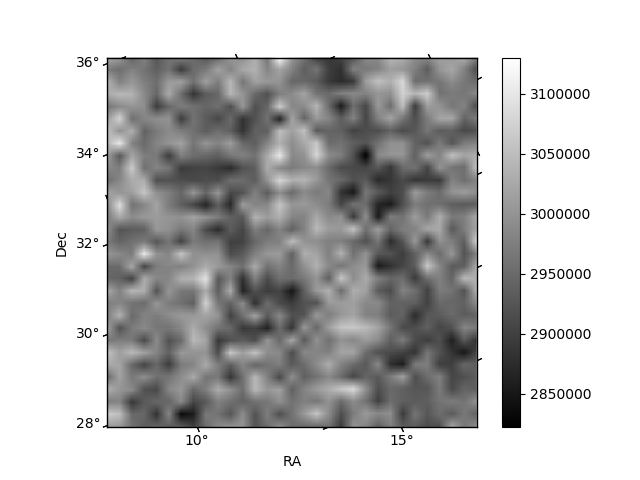
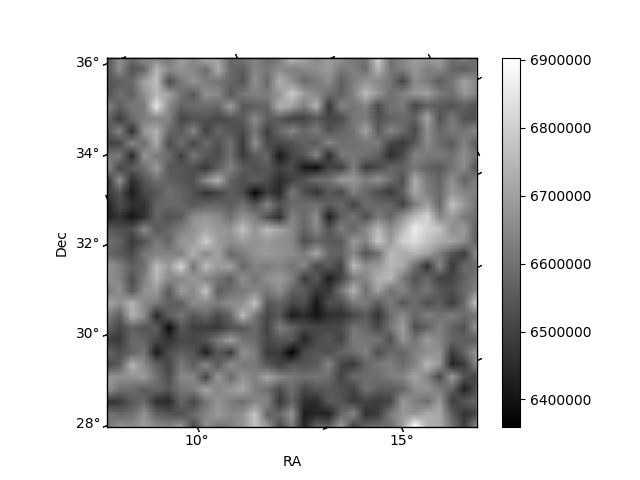
Histogram calculated using DETX and DETY for each event in the final _common_clean file
| Quadrant A | 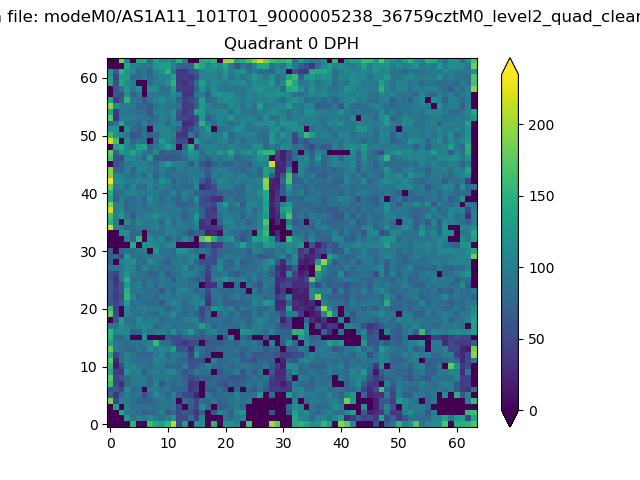 |
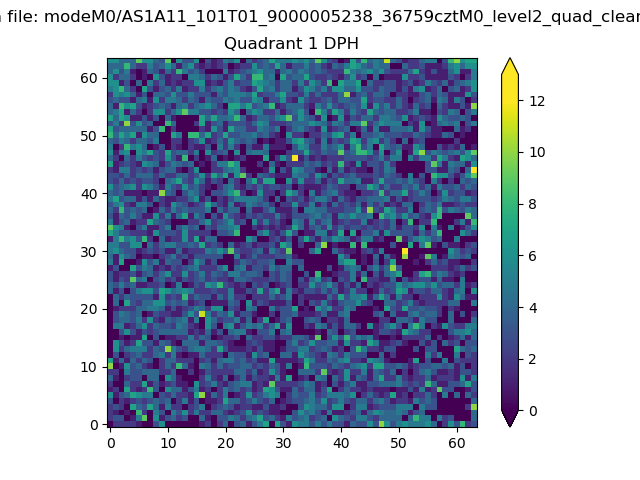 |
Quadrant B |
|---|---|---|---|
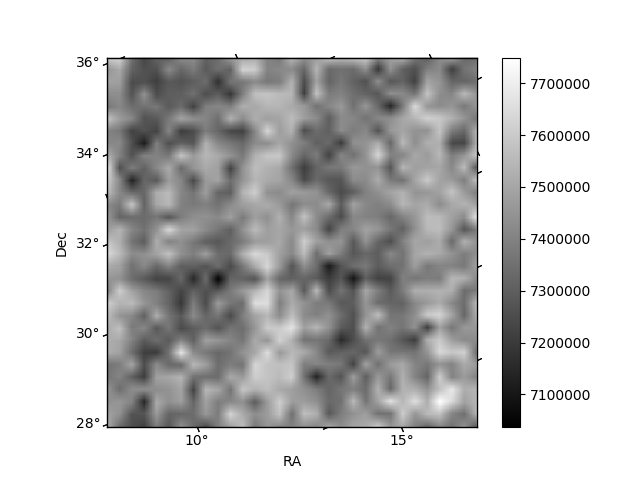
| Quadrant D | 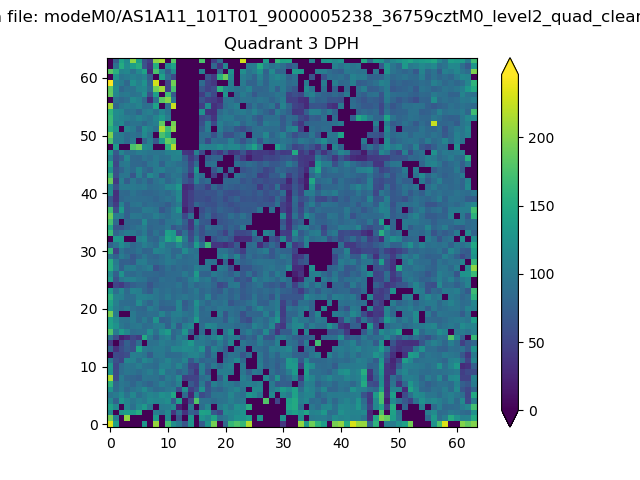 |
 |
Quadrant C |
| Plot type | Count rate plots | Images |
|---|---|---|
| Comparison with Poisson distribution Blue bars denote a histogram of data divided into 1 sec bins. Red curve is a Poisson curve with rate = median count rate of data. |
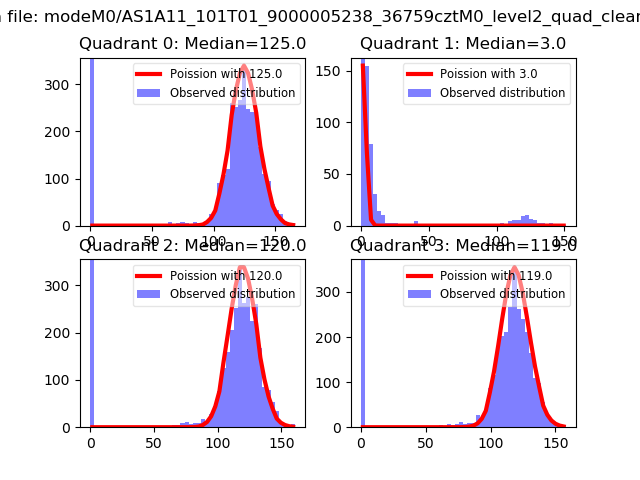 |
 |
| Quadrant-wise count rates Data is divided into 100 sec bins |
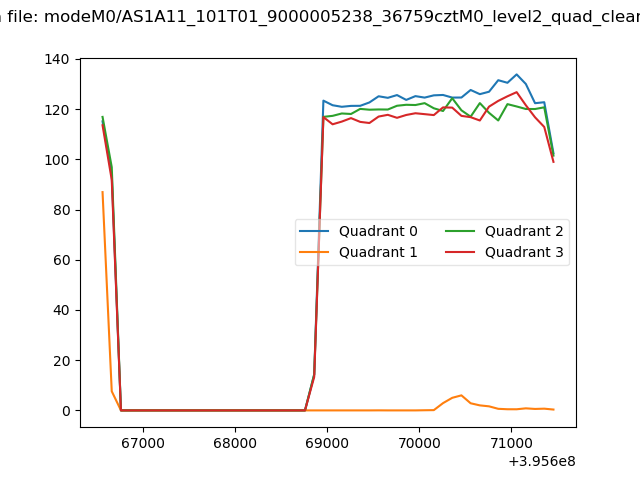 |
|
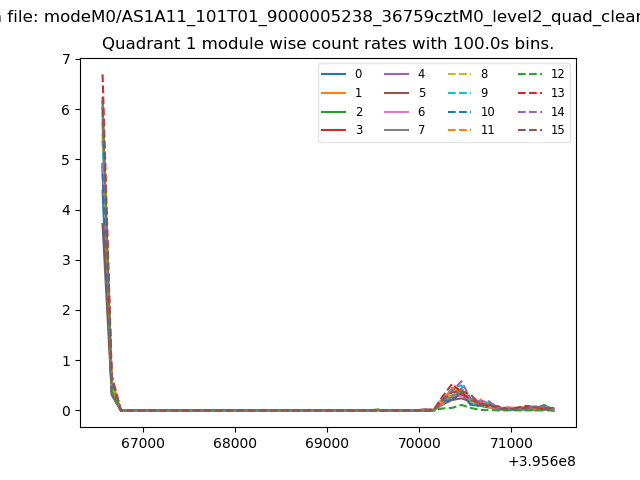
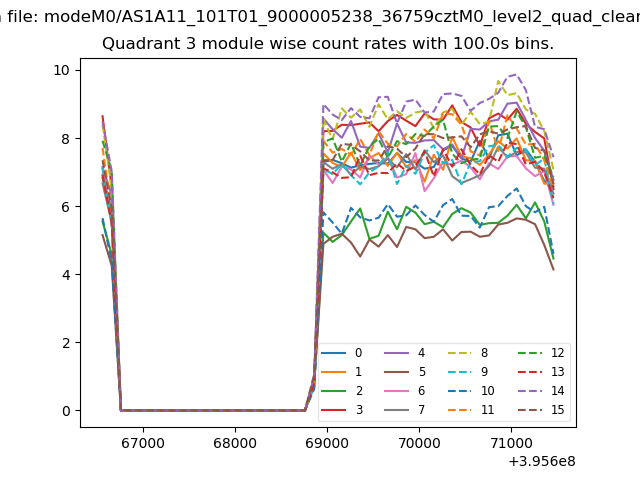
| Module-wise count rates for Quadrant A Data is divided into 100 sec bins |
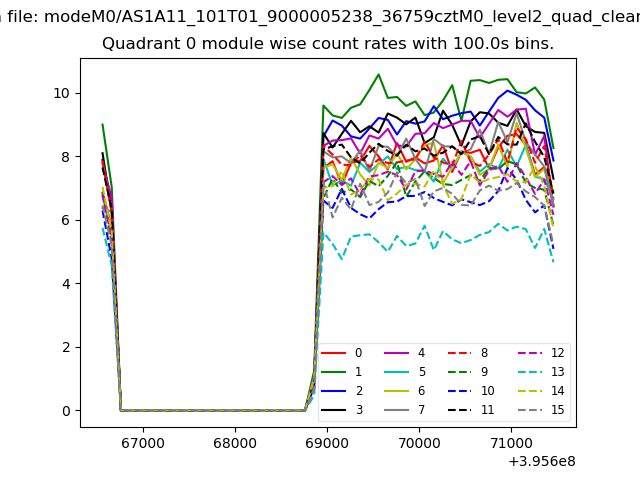 |
 |
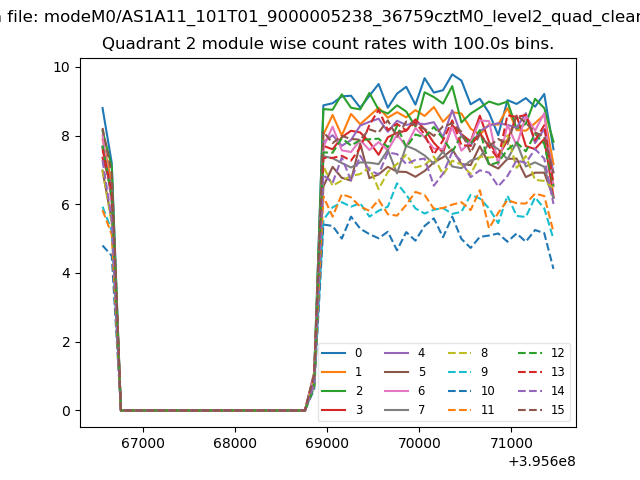
| Module-wise count rates for Quadrant B Data is divided into 100 sec bins |
 |
 |
| Module-wise count rates for Quadrant C Data is divided into 100 sec bins |
 |
 |
| Module-wise count rates for Quadrant D Data is divided into 100 sec bins |
 |
 |
| Parameter | Plot |
|---|---|
| CZT HV Monitor | 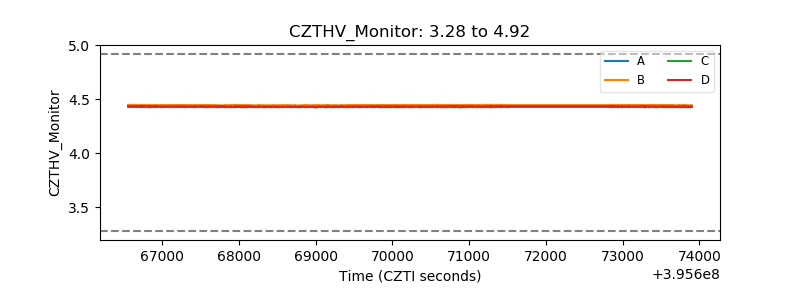 |
| D_VDD | 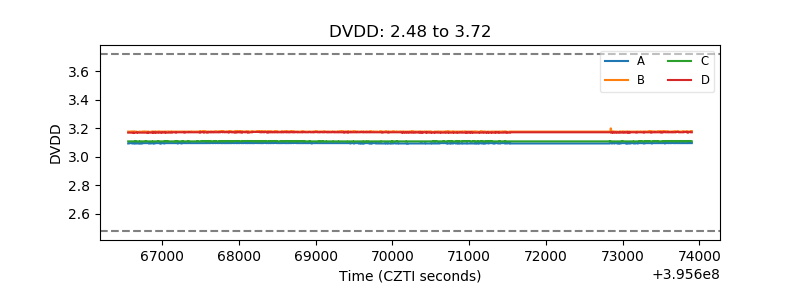 |
| Temperature 1 | 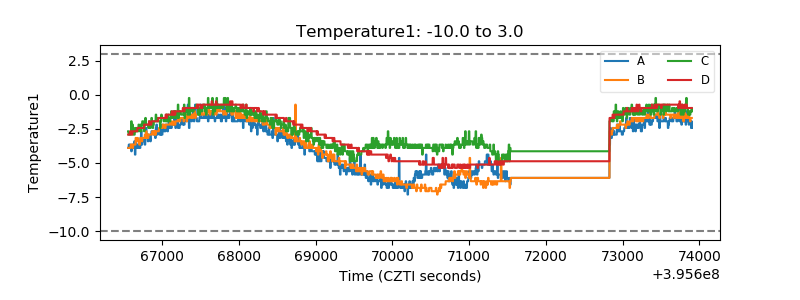 |
| Veto HV Monitor |  |
| Veto LLD | 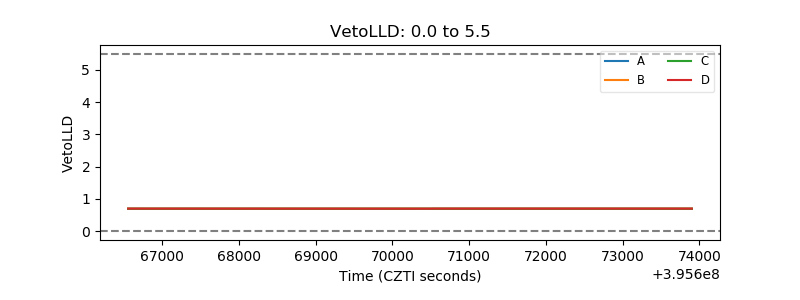 |
| Alpha Counter | 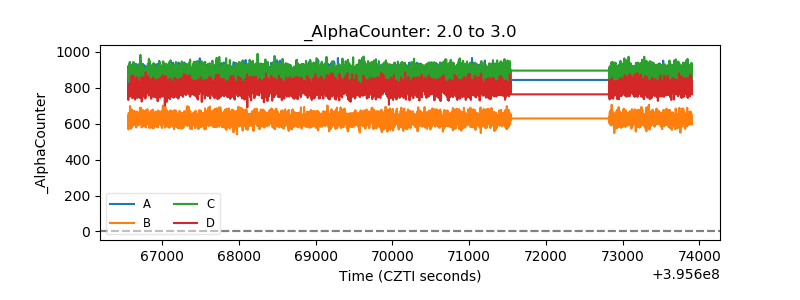 |
| _CPM_Rate | 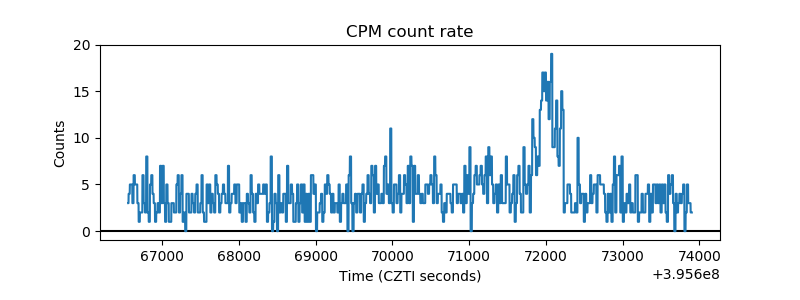 |
| CZT Counter | 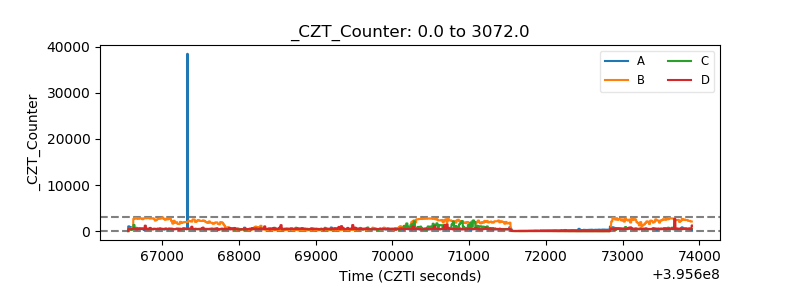 |
| +2.5 Volts monitor |  |
| +5 Volts monitor |  |
| _ROLL_ROT | 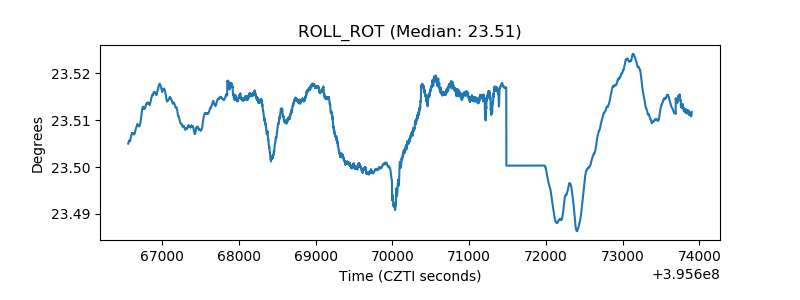 |
| _Roll_DEC | 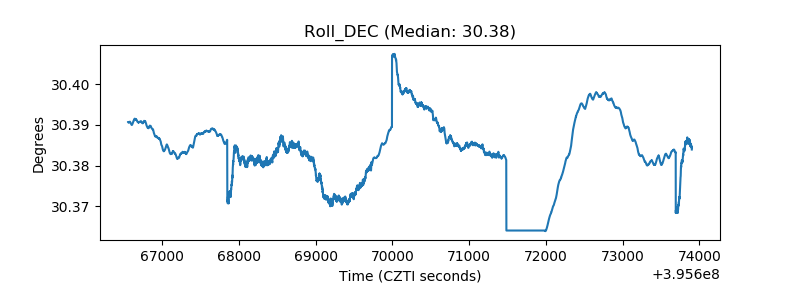 |
| _Roll_RA | 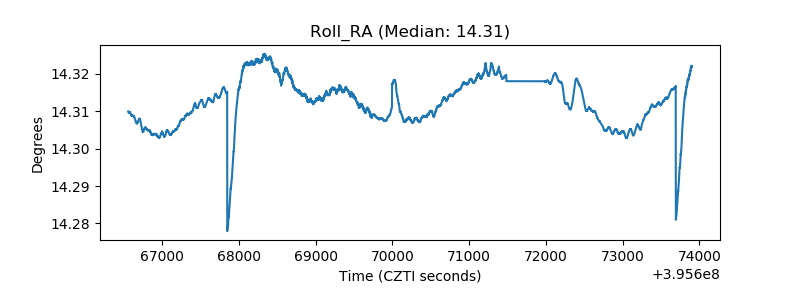 |
| Veto Counter | 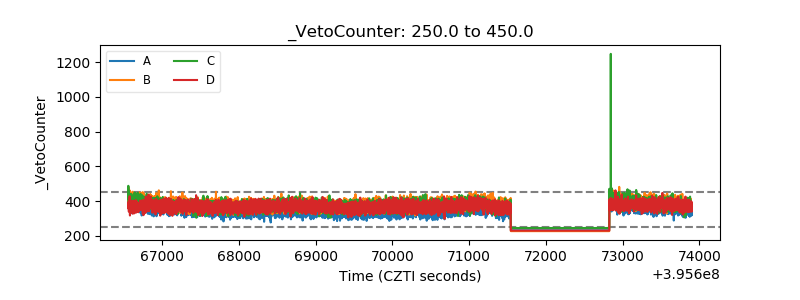 |