| Param | Original file | Final file |
|---|---|---|
| Filename | modeM0/AS1A11_101T01_9000005238_36761cztM0_level2.evt | modeM0/AS1A11_101T01_9000005238_36761cztM0_level2_quad_clean.evt |
| Size (bytes) | 1,386,348,480 | 99,221,760 |
| Size | 1.3 GB | 94.6 MB |
| Events in quadrant A | 5,320,566 | 766,269 |
| Events in quadrant B | 24,105,457 | 21,064 |
| Events in quadrant C | 5,792,364 | 744,932 |
| Events in quadrant D | 6,032,142 | 716,470 |
| Mode M0 | |||
|---|---|---|---|
| Quadrant | BADHDUFLAG | Total packets | Discarded packets |
| A | 0 | 22735 | 4 |
| B | 0 | 79069 | 3 |
| C | 0 | 23650 | 3 |
| D | 0 | 25352 | 3 |
| Mode SS | |||
|---|---|---|---|
| Quadrant | BADHDUFLAG | Total packets | Discarded packets |
| A | 0 | 222 | 0 |
| B | 0 | 222 | 0 |
| C | 0 | 222 | 0 |
| D | 0 | 222 | 0 |
| Mode M9 | |||
|---|---|---|---|
| Quadrant | BADHDUFLAG | Total packets | Discarded packets |
| A | 0 | 35 | 0 |
| B | 0 | 35 | 0 |
| C | 0 | 35 | 0 |
| D | 0 | 36 | 0 |
| Quadrant | Total seconds | Saturated seconds | Saturation percentage |
|---|---|---|---|
| A | 10869 | 22 | 0.202411% |
| B | 10869 | 10738 | 98.794737% |
| C | 10869 | 75 | 0.690036% |
| D | 10869 | 266 | 2.447327% |
Noise dominated data is calculated using 1-second bins in cleaned event files. If a bin has >2000 counts, and if more than 50% of those come from <1% of pixels, then it is considered to be noise-dominated and hence unusable.
| Quadrant | # 1 sec bins | Bins with >0 counts | Bins with >2000 counts | High rate bins dominated by noise | Noise dominated (total time) | Noise dominated (detector-on time) | Marked lightcurve |
|---|---|---|---|---|---|---|---|
| A | 13646 | 10871 | 4 | 4 | 0.03% | 0.04% | 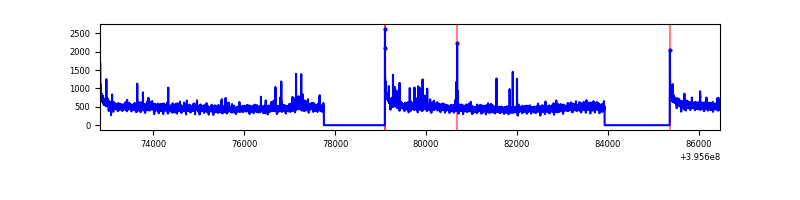 |
| B | 13645 | 10868 | 7811 | 7811 | 57.24% | 71.87% | 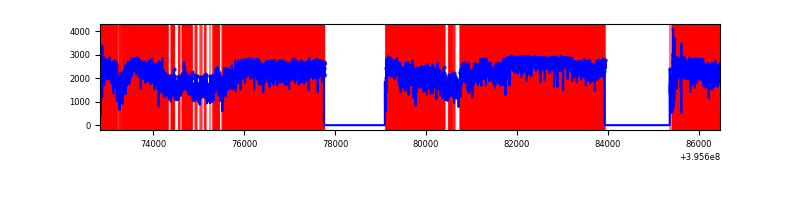 |
| C | 13646 | 10871 | 72 | 72 | 0.53% | 0.66% | 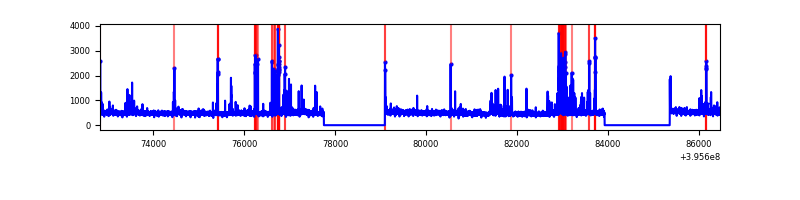 |
| D | 13646 | 10871 | 214 | 214 | 1.57% | 1.97% | 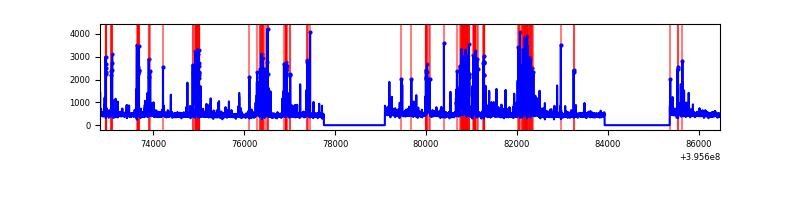 |
Top three noisy pixels from each quadrant. If the there are fewer than three noisy pixels in the level2.evt file, extra rows are filled as -1
| Pixel properties | Quadrant properties | ||||||
|---|---|---|---|---|---|---|---|
| Quadrant | DetID | PixID | Counts | Sigma | Mean | Median | Sigma |
| A | 10 | 83 | 406384 | 1608.13 | 1243 | 1218 | 251.9 |
| A | 9 | 143 | 60932 | 237.01 | 1243 | 1218 | 251.9 |
| A | 13 | 6 | 24988 | 94.34 | 1243 | 1218 | 251.9 |
| B | 12 | 1 | 23548277 | 1044790.23 | 109 | 106 | 22.5 |
| B | 4 | 171 | 50802 | 2249.29 | 109 | 106 | 22.5 |
| B | 0 | 213 | 24061 | 1062.84 | 109 | 106 | 22.5 |
| C | 15 | 214 | 464722 | 1657.54 | 1203 | 1209 | 279.6 |
| C | 14 | 254 | 443991 | 1583.41 | 1203 | 1209 | 279.6 |
| C | 15 | 159 | 56944 | 199.31 | 1203 | 1209 | 279.6 |
| D | 13 | 171 | 567390 | 1923.04 | 1200 | 1165 | 294.4 |
| D | 13 | 249 | 287877 | 973.74 | 1200 | 1165 | 294.4 |
| D | 12 | 6 | 150102 | 505.83 | 1200 | 1165 | 294.4 |
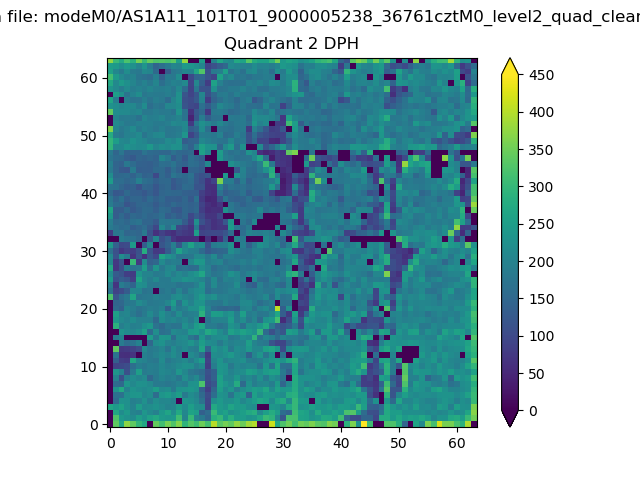
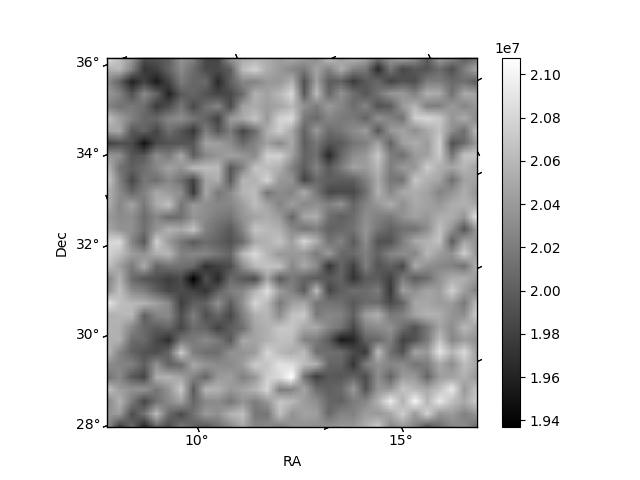
Histogram calculated using DETX and DETY for each event in the final _common_clean file
| Quadrant A | 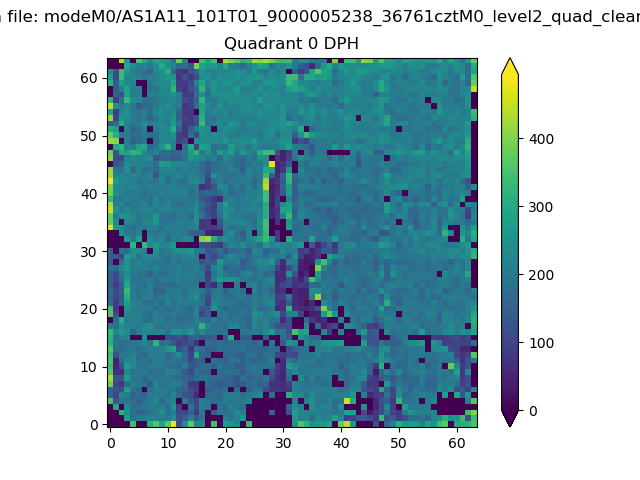 |
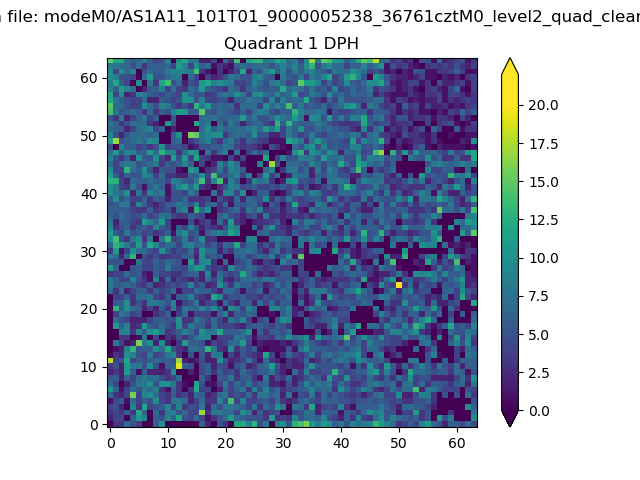 |
Quadrant B |
|---|---|---|---|
| Quadrant D | 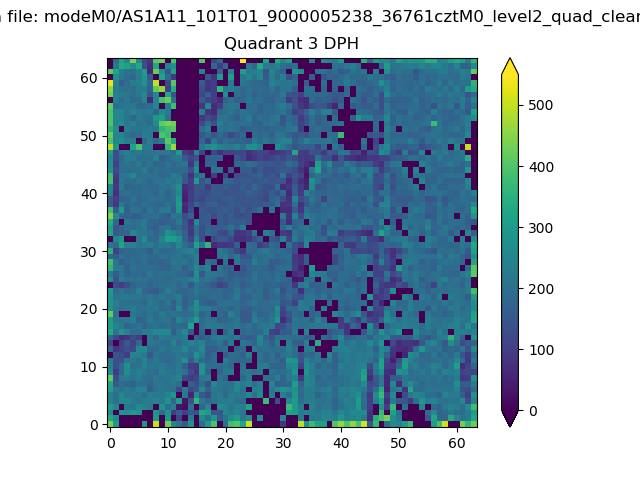 |
 |
Quadrant C |
| Plot type | Count rate plots | Images |
|---|---|---|
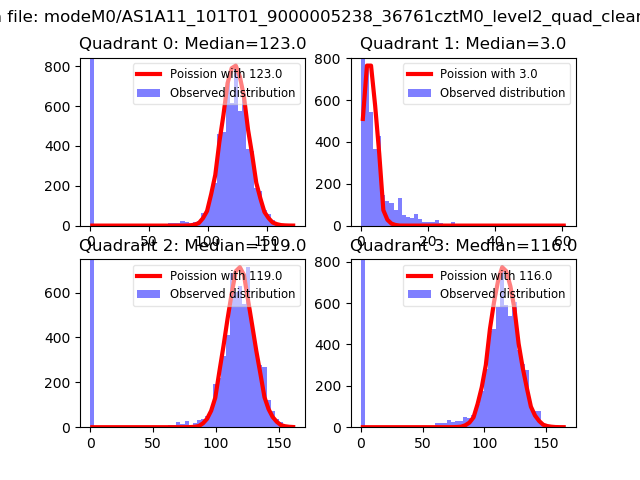
| Comparison with Poisson distribution Blue bars denote a histogram of data divided into 1 sec bins. Red curve is a Poisson curve with rate = median count rate of data. |
 |
 |
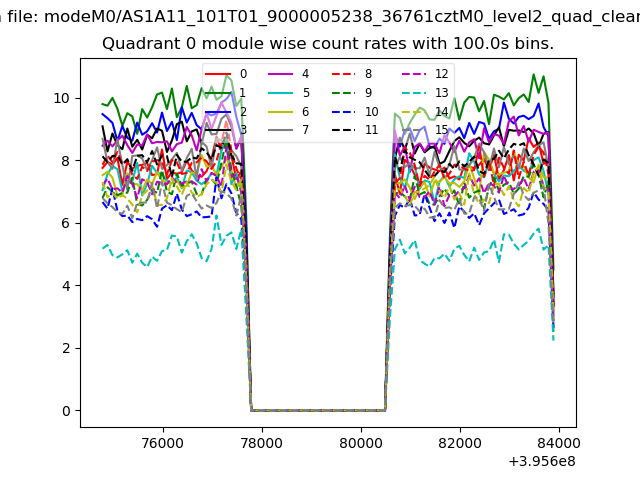
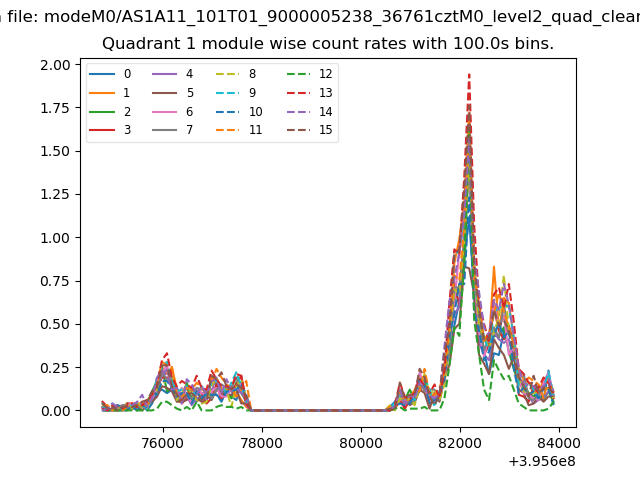
| Quadrant-wise count rates Data is divided into 100 sec bins |
 |
|
| Module-wise count rates for Quadrant A Data is divided into 100 sec bins |
 |
 |
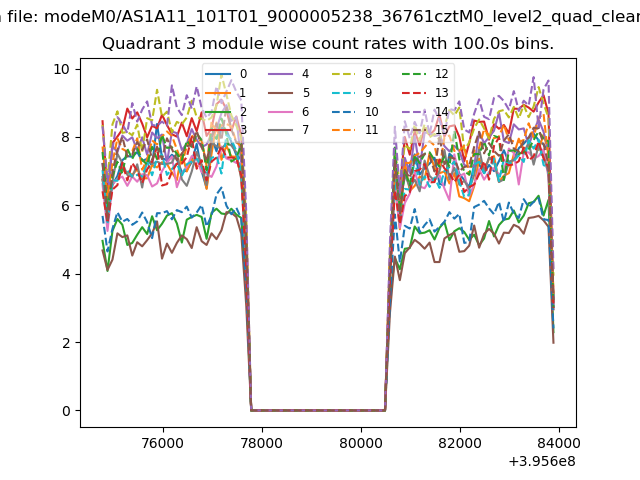
| Module-wise count rates for Quadrant B Data is divided into 100 sec bins |
 |
 |
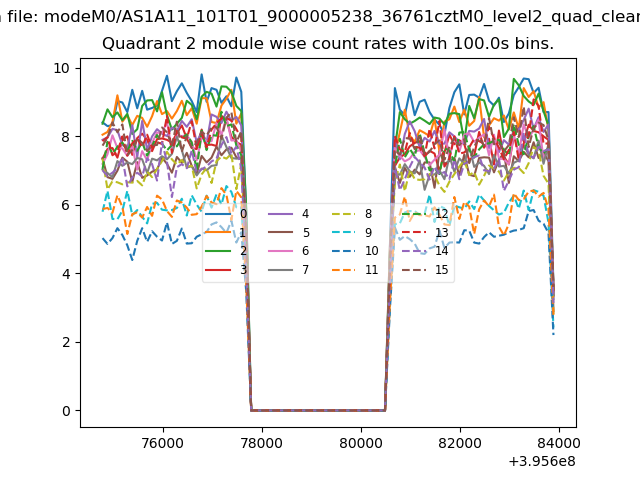
| Module-wise count rates for Quadrant C Data is divided into 100 sec bins |
 |
 |
| Module-wise count rates for Quadrant D Data is divided into 100 sec bins |
 |
 |
| Parameter | Plot |
|---|---|
| CZT HV Monitor | 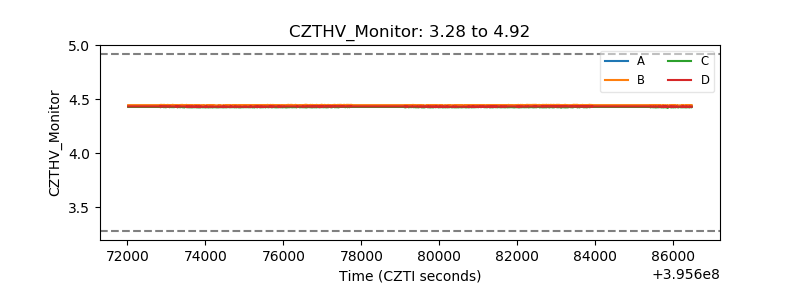 |
| D_VDD | 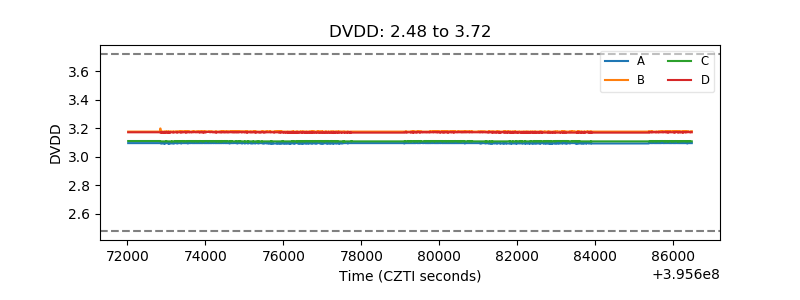 |
| Temperature 1 | 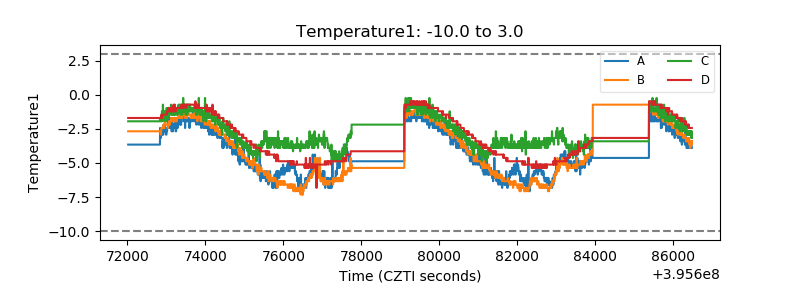 |
| Veto HV Monitor |  |
| Veto LLD | 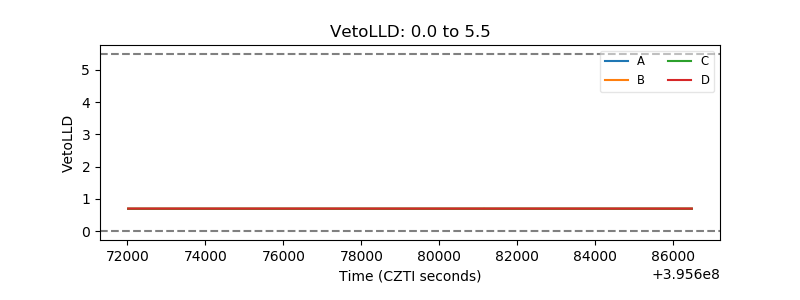 |
| Alpha Counter |  |
| _CPM_Rate | 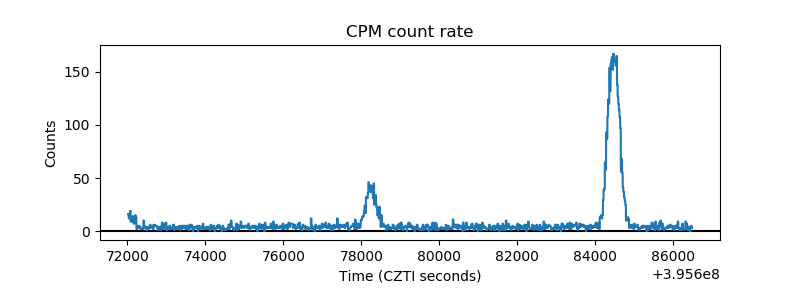 |
| CZT Counter | 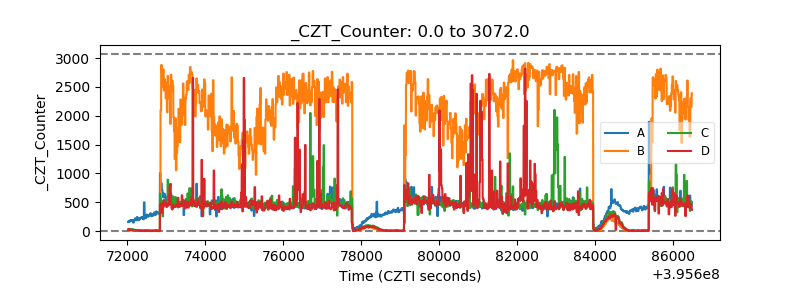 |
| +2.5 Volts monitor |  |
| +5 Volts monitor |  |
| _ROLL_ROT | 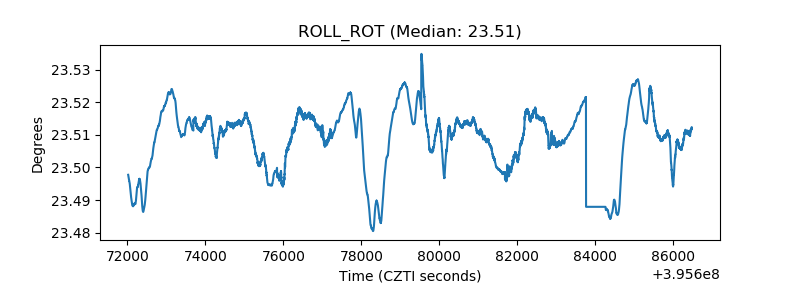 |
| _Roll_DEC | 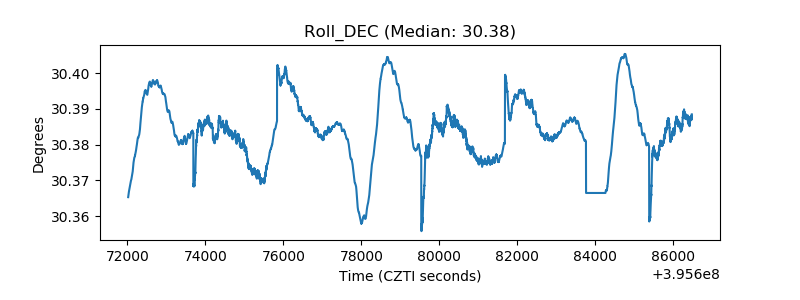 |
| _Roll_RA |  |
| Veto Counter | 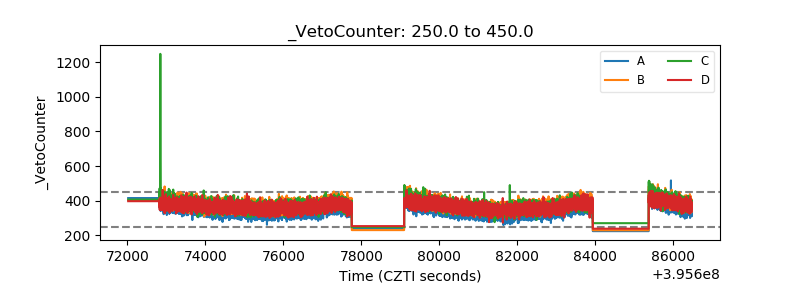 |