| Param | Original file | Final file |
|---|---|---|
| Filename | modeM0/AS1A11_101T01_9000005238_36762cztM0_level2.evt | modeM0/AS1A11_101T01_9000005238_36762cztM0_level2_quad_clean.evt |
| Size (bytes) | 814,867,200 | 59,996,160 |
| Size | 777.1 MB | 57.2 MB |
| Events in quadrant A | 2,850,304 | 469,215 |
| Events in quadrant B | 13,917,218 | 92,937 |
| Events in quadrant C | 2,891,518 | 464,128 |
| Events in quadrant D | 4,635,403 | 391,024 |
| Mode M0 | |||
|---|---|---|---|
| Quadrant | BADHDUFLAG | Total packets | Discarded packets |
| A | 0 | 12159 | 3 |
| B | 0 | 45324 | 2 |
| C | 0 | 12065 | 2 |
| D | 0 | 17574 | 2 |
| Mode SS | |||
|---|---|---|---|
| Quadrant | BADHDUFLAG | Total packets | Discarded packets |
| A | 0 | 114 | 0 |
| B | 0 | 114 | 0 |
| C | 0 | 114 | 0 |
| D | 0 | 114 | 0 |
| Mode M9 | |||
|---|---|---|---|
| Quadrant | BADHDUFLAG | Total packets | Discarded packets |
| A | 0 | 26 | 0 |
| B | 0 | 26 | 0 |
| C | 0 | 26 | 0 |
| D | 0 | 27 | 0 |
| Quadrant | Total seconds | Saturated seconds | Saturation percentage |
|---|---|---|---|
| A | 5683 | 21 | 0.369523% |
| B | 5683 | 5185 | 91.237023% |
| C | 5683 | 27 | 0.475101% |
| D | 5683 | 710 | 12.493401% |
Noise dominated data is calculated using 1-second bins in cleaned event files. If a bin has >2000 counts, and if more than 50% of those come from <1% of pixels, then it is considered to be noise-dominated and hence unusable.
| Quadrant | # 1 sec bins | Bins with >0 counts | Bins with >2000 counts | High rate bins dominated by noise | Noise dominated (total time) | Noise dominated (detector-on time) | Marked lightcurve |
|---|---|---|---|---|---|---|---|
| A | 7235 | 5684 | 4 | 4 | 0.06% | 0.07% | 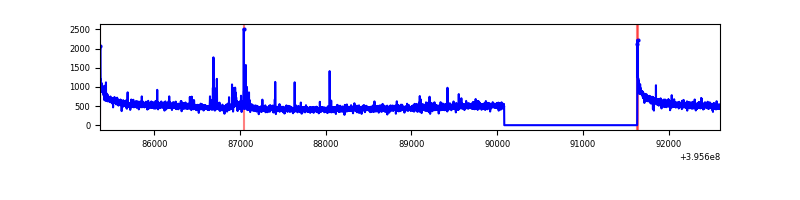 |
| B | 7234 | 5682 | 4992 | 4992 | 69.01% | 87.86% | 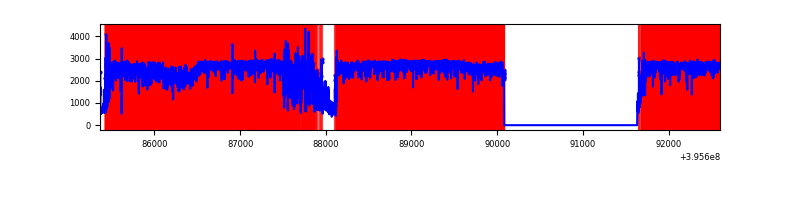 |
| C | 7235 | 5684 | 13 | 13 | 0.18% | 0.23% | 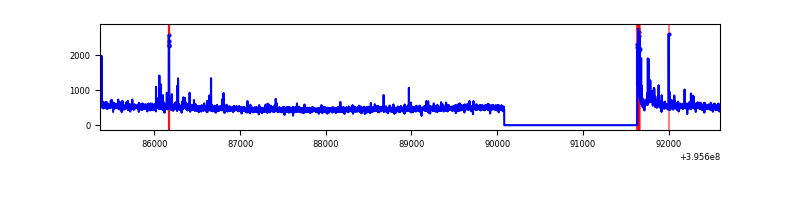 |
| D | 7235 | 5684 | 685 | 685 | 9.47% | 12.05% | 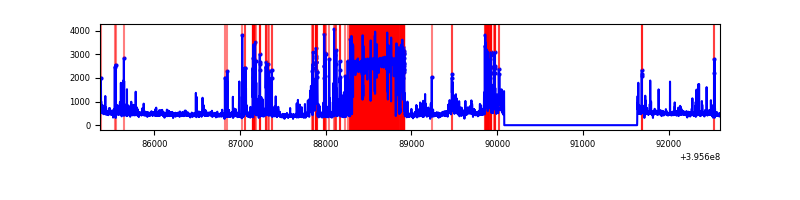 |
Top three noisy pixels from each quadrant. If the there are fewer than three noisy pixels in the level2.evt file, extra rows are filled as -1
| Pixel properties | Quadrant properties | ||||||
|---|---|---|---|---|---|---|---|
| Quadrant | DetID | PixID | Counts | Sigma | Mean | Median | Sigma |
| A | 10 | 83 | 241783 | 1816.0 | 654 | 641 | 132.8 |
| A | 7 | 3 | 21203 | 154.85 | 654 | 641 | 132.8 |
| A | 0 | 247 | 15603 | 112.68 | 654 | 641 | 132.8 |
| B | 12 | 1 | 13072701 | 400907.92 | 164 | 160 | 32.6 |
| B | 4 | 171 | 44484 | 1359.33 | 164 | 160 | 32.6 |
| B | 0 | 213 | 39352 | 1201.94 | 164 | 160 | 32.6 |
| C | 15 | 214 | 242917 | 1620.94 | 638 | 641 | 149.5 |
| C | 0 | 10 | 54141 | 357.94 | 638 | 641 | 149.5 |
| C | 14 | 254 | 46634 | 307.71 | 638 | 641 | 149.5 |
| D | 12 | 6 | 1925596 | 13084.44 | 591 | 573 | 147.1 |
| D | 13 | 171 | 191984 | 1301.03 | 591 | 573 | 147.1 |
| D | 2 | 153 | 56533 | 380.36 | 591 | 573 | 147.1 |
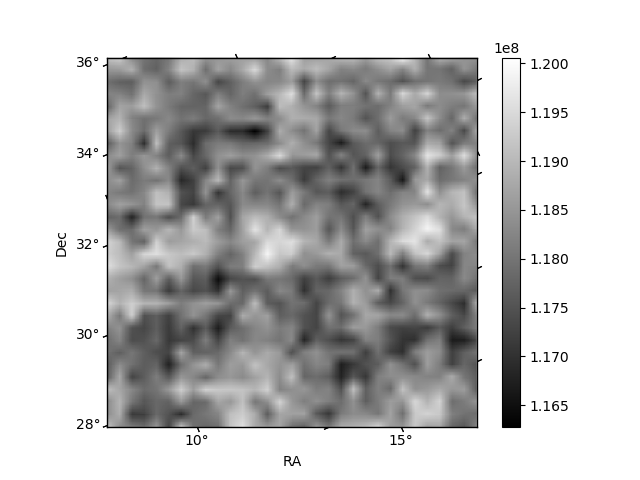
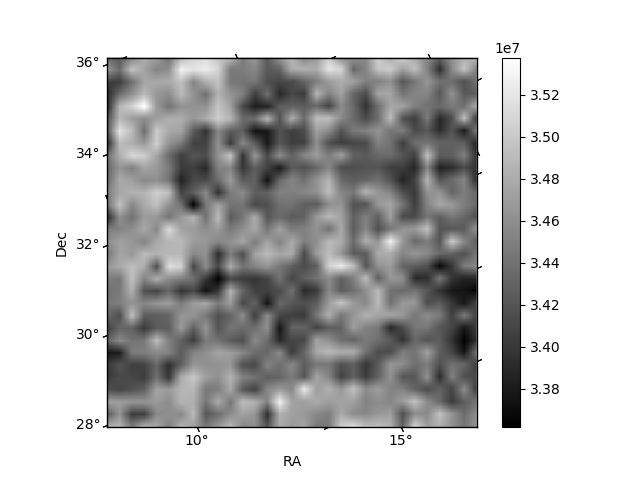
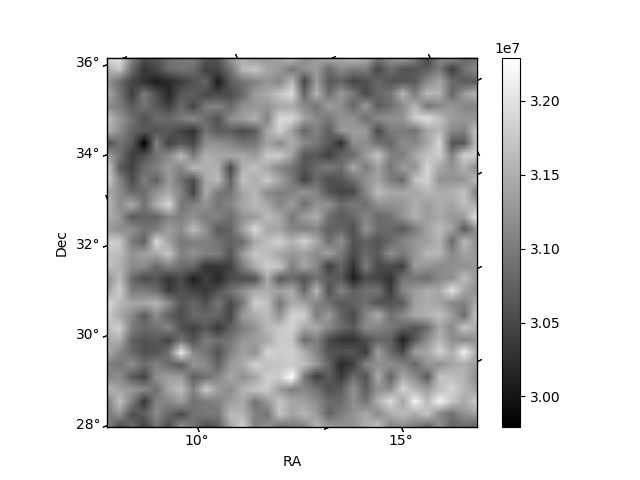
Histogram calculated using DETX and DETY for each event in the final _common_clean file
| Quadrant A | 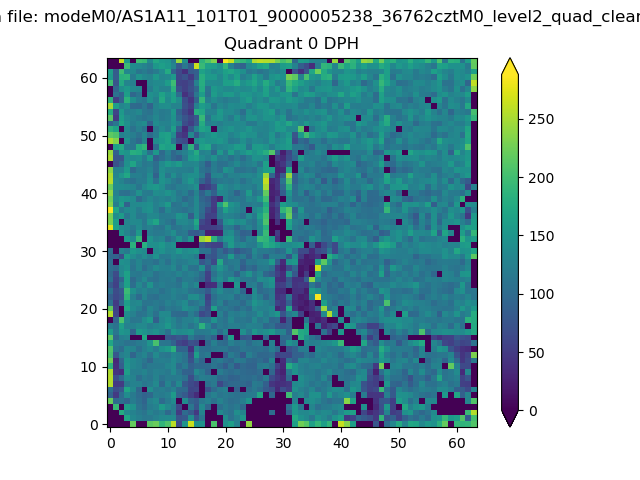 |
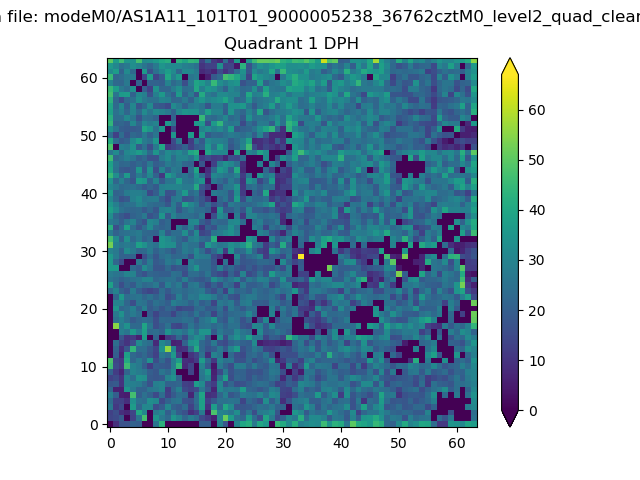 |
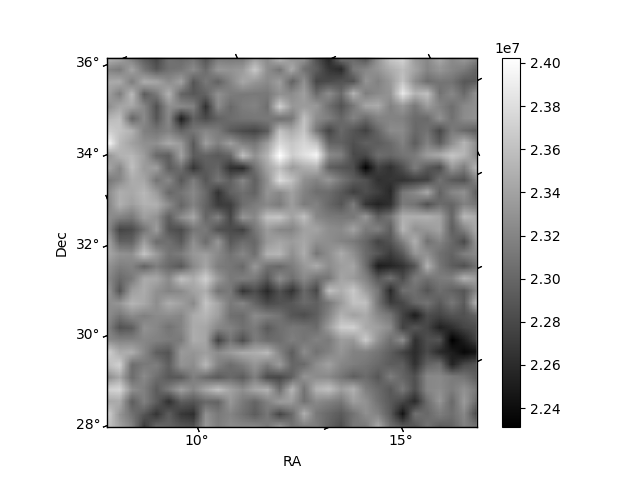
Quadrant B |
|---|---|---|---|
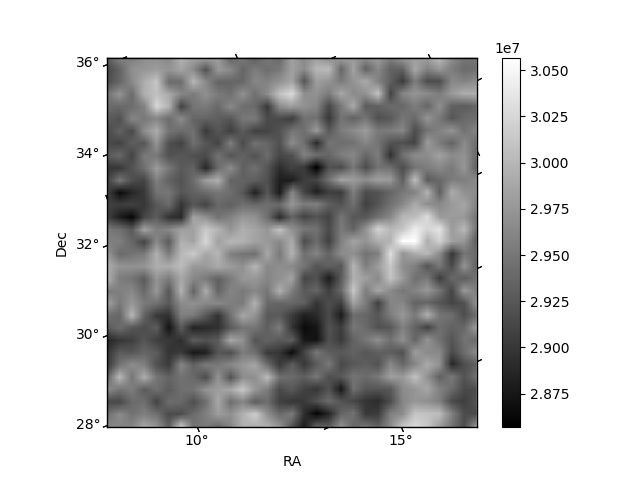
| Quadrant D | 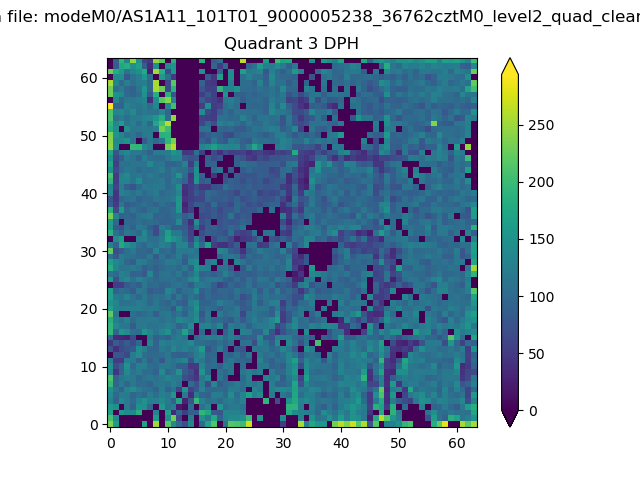 |
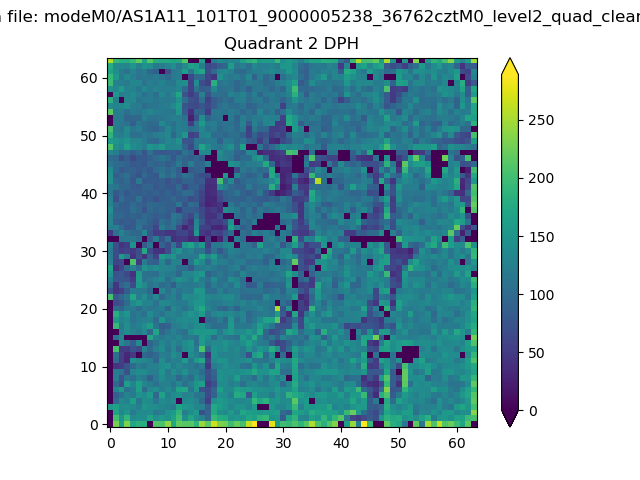 |
Quadrant C |
| Plot type | Count rate plots | Images |
|---|---|---|
| Comparison with Poisson distribution Blue bars denote a histogram of data divided into 1 sec bins. Red curve is a Poisson curve with rate = median count rate of data. |
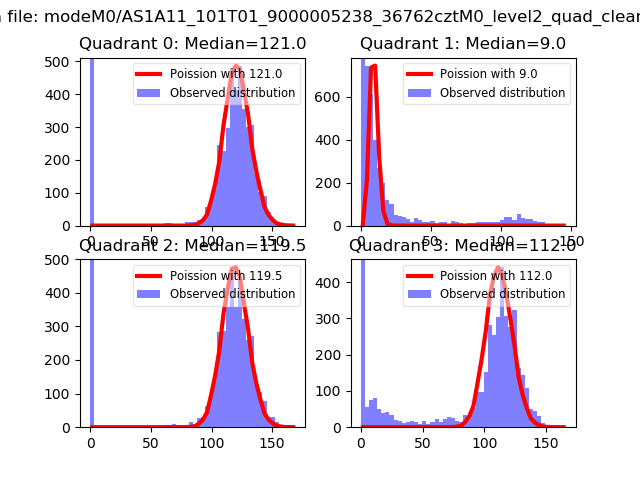 |
 |
| Quadrant-wise count rates Data is divided into 100 sec bins |
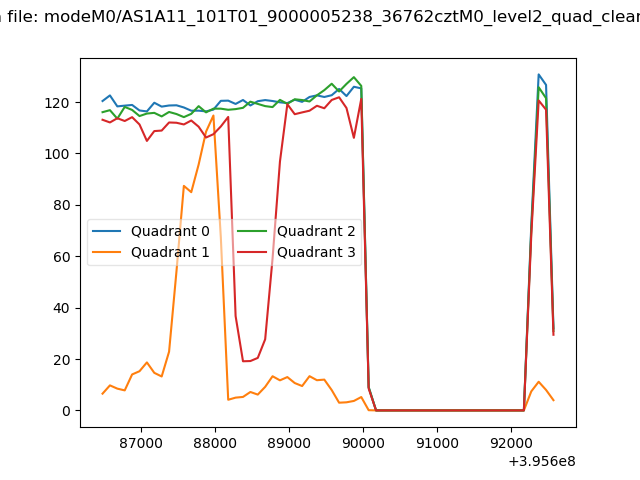 |
|
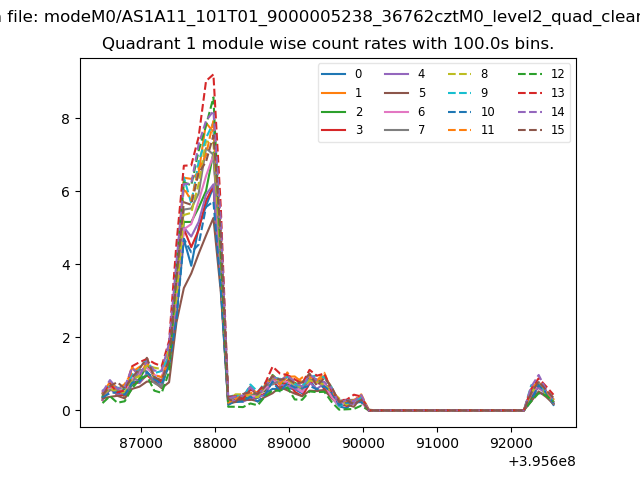
| Module-wise count rates for Quadrant A Data is divided into 100 sec bins |
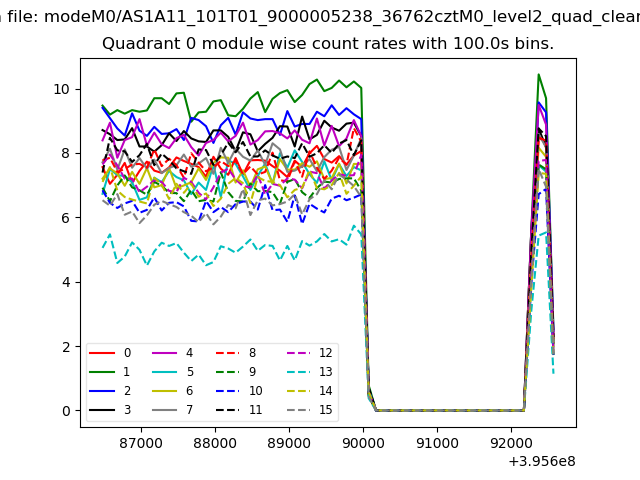 |
 |
| Module-wise count rates for Quadrant B Data is divided into 100 sec bins |
 |
 |
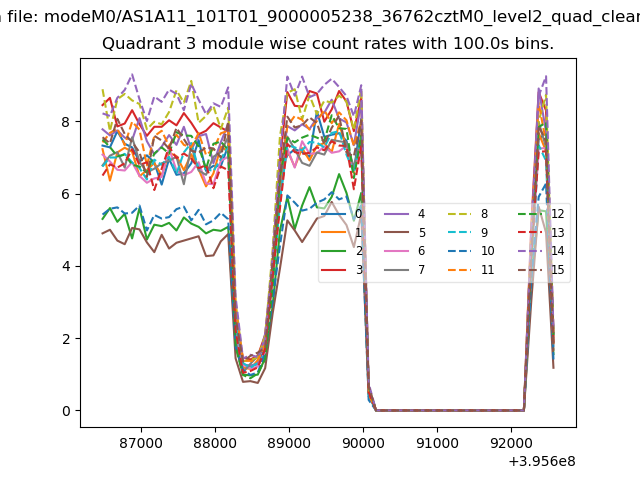
| Module-wise count rates for Quadrant C Data is divided into 100 sec bins |
 |
 |
| Module-wise count rates for Quadrant D Data is divided into 100 sec bins |
 |
 |
| Parameter | Plot |
|---|---|
| CZT HV Monitor | 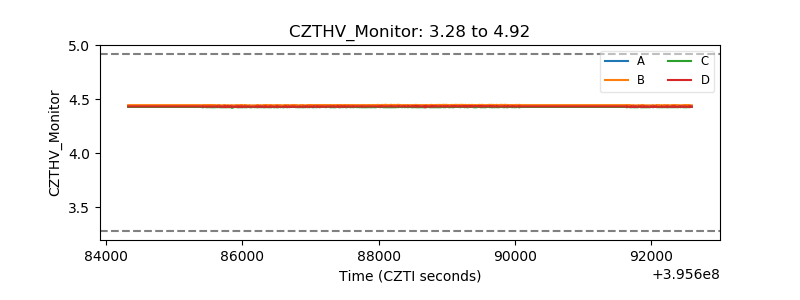 |
| D_VDD | 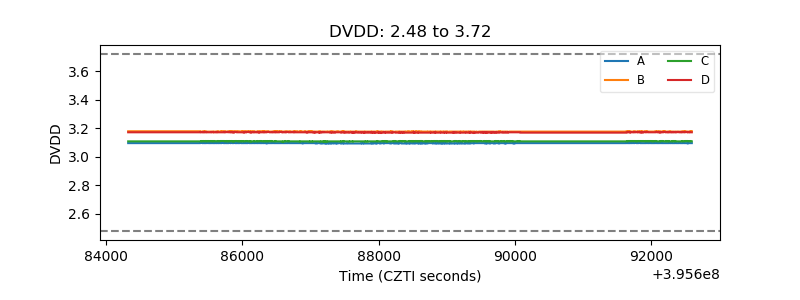 |
| Temperature 1 | 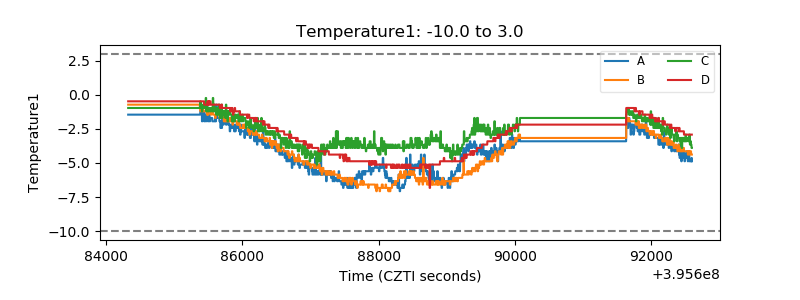 |
| Veto HV Monitor | 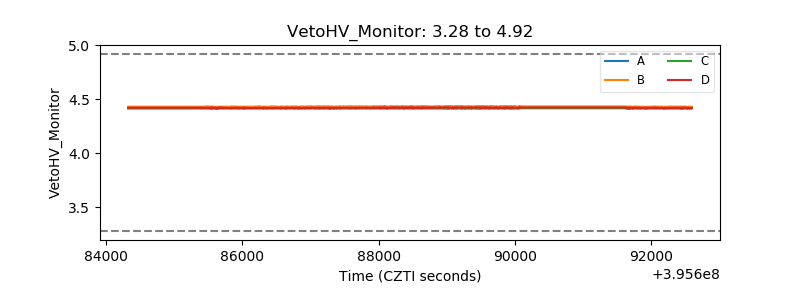 |
| Veto LLD | 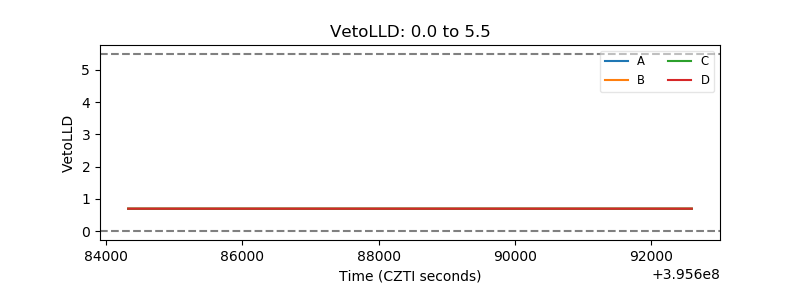 |
| Alpha Counter | 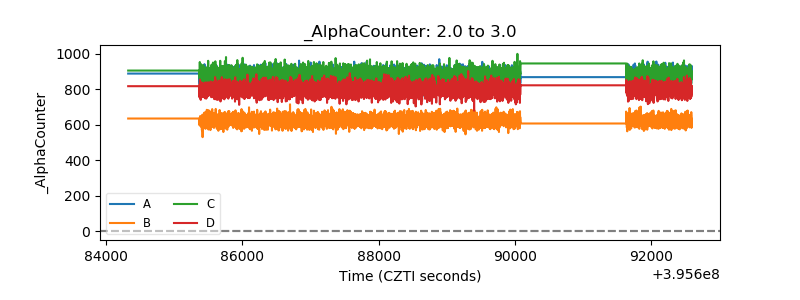 |
| _CPM_Rate |  |
| CZT Counter | 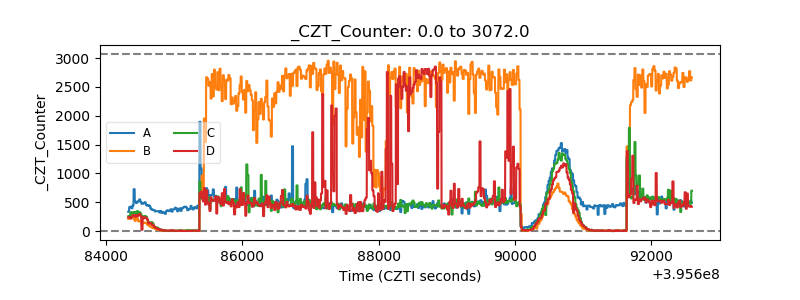 |
| +2.5 Volts monitor |  |
| +5 Volts monitor |  |
| _ROLL_ROT | 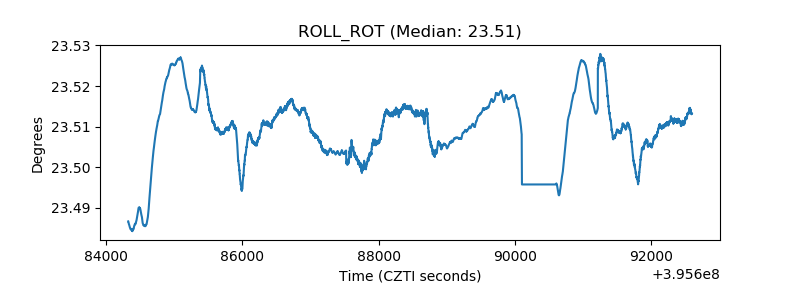 |
| _Roll_DEC | 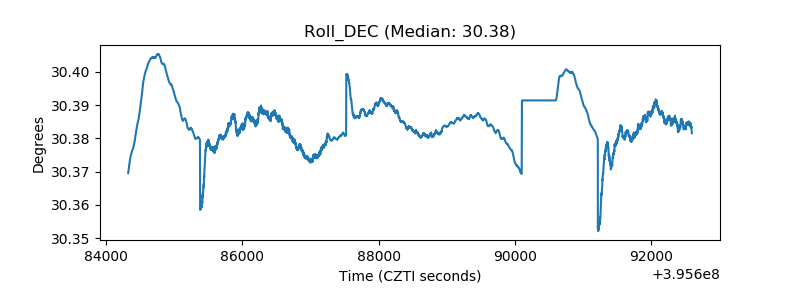 |
| _Roll_RA | 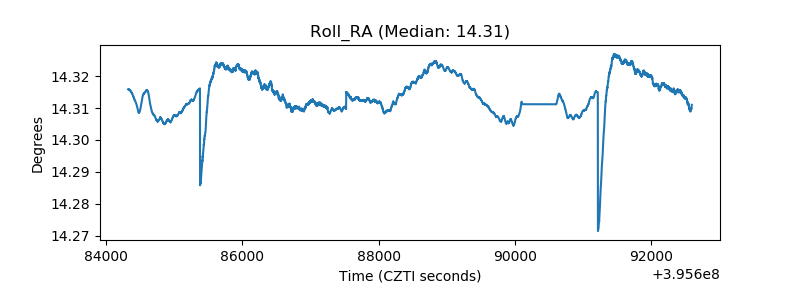 |
| Veto Counter | 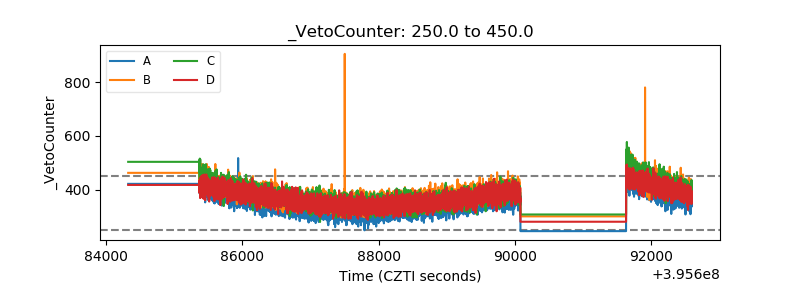 |