| Param | Original file | Final file |
|---|---|---|
| Filename | modeM0/AS1A11_087T05_9000005240cztM0_level2.fits | modeM0/AS1A11_087T05_9000005240cztM0_level2_quad_clean.evt |
| Size (bytes) | 543,435,840 | 503,786,880 |
| Size | 518.3 MB | 480.4 MB |
| Events in quadrant A | 3,601,922 | 3,388,712 |
| Events in quadrant B | 1,999,096 | 1,603,682 |
| Events in quadrant C | 3,544,008 | 3,213,819 |
| Events in quadrant D | 2,954,426 | 2,711,766 |
| Mode M0 | |||
|---|---|---|---|
| Quadrant | BADHDUFLAG | Total packets | Discarded packets |
| A | 0 | 130957 | 0 |
| B | 0 | 399520 | 0 |
| C | 0 | 141340 | 0 |
| D | 0 | 180416 | 0 |
| Mode M9 | |||
|---|---|---|---|
| Quadrant | BADHDUFLAG | Total packets | Discarded packets |
| A | 0 | 240 | 0 |
| B | 0 | 240 | 0 |
| C | 0 | 240 | 0 |
| D | 0 | 240 | 0 |
| Mode SS | |||
|---|---|---|---|
| Quadrant | BADHDUFLAG | Total packets | Discarded packets |
| A | 0 | 1296 | 0 |
| B | 0 | 1296 | 0 |
| C | 0 | 1296 | 0 |
| D | 0 | 1296 | 0 |
| Quadrant | Total seconds | Saturated seconds | Saturation percentage |
|---|---|---|---|
| A | 63227 | 109 | 0.172395% |
| B | 63227 | 39481 | 62.443260% |
| C | 63227 | 699 | 1.105540% |
| D | 63227 | 5089 | 8.048777% |
Noise dominated data is calculated using 1-second bins in cleaned event files. If a bin has >2000 counts, and if more than 50% of those come from <1% of pixels, then it is considered to be noise-dominated and hence unusable.
| Quadrant | # 1 sec bins | Bins with >0 counts | Bins with >2000 counts | High rate bins dominated by noise | Noise dominated (total time) | Noise dominated (detector-on time) | Marked lightcurve |
|---|---|---|---|---|---|---|---|
| A | 87397 | 63227 | 0 | 0 | 0.00% | 0.00% | 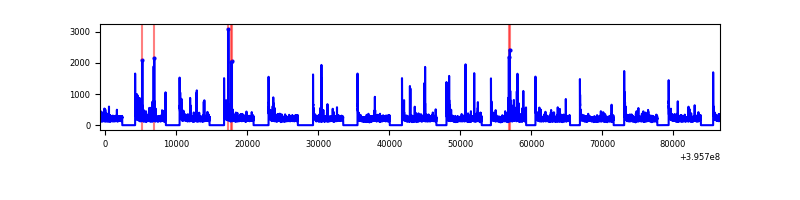 |
| B | 87397 | 61258 | 0 | 0 | 0.00% | 0.00% | 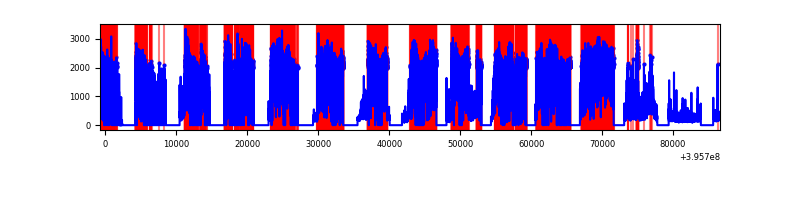 |
| C | 87397 | 63221 | 0 | 0 | 0.00% | 0.00% |  |
| D | 87397 | 62956 | 0 | 0 | 0.00% | 0.00% |  |
Top three noisy pixels from each quadrant. If the there are fewer than three noisy pixels in the level2.evt file, extra rows are filled as -1
| Pixel properties | Quadrant properties | ||||||
|---|---|---|---|---|---|---|---|
| Quadrant | DetID | PixID | Counts | Sigma | Mean | Median | Sigma |
| A | 7 | 110 | 2954 | 8.79 | 939 | 879 | 236.2 |
| A | 9 | 19 | 2915 | 8.62 | 939 | 879 | 236.2 |
| A | 0 | 29 | 2886 | 8.5 | 939 | 879 | 236.2 |
| B | 2 | 9 | 1727 | 11.52 | 528 | 503 | 106.2 |
| B | 3 | 80 | 1583 | 10.17 | 528 | 503 | 106.2 |
| B | 3 | 17 | 1426 | 8.69 | 528 | 503 | 106.2 |
| C | 1 | 81 | 2934 | 8.56 | 936 | 876 | 240.3 |
| C | 1 | 80 | 2865 | 8.28 | 936 | 876 | 240.3 |
| C | 3 | 202 | 2760 | 7.84 | 936 | 876 | 240.3 |
| D | 7 | 3 | 2209 | 6.41 | 844 | 773 | 223.8 |
| D | 10 | 189 | 2181 | 6.29 | 844 | 773 | 223.8 |
| D | 1 | 3 | 2123 | 6.03 | 844 | 773 | 223.8 |
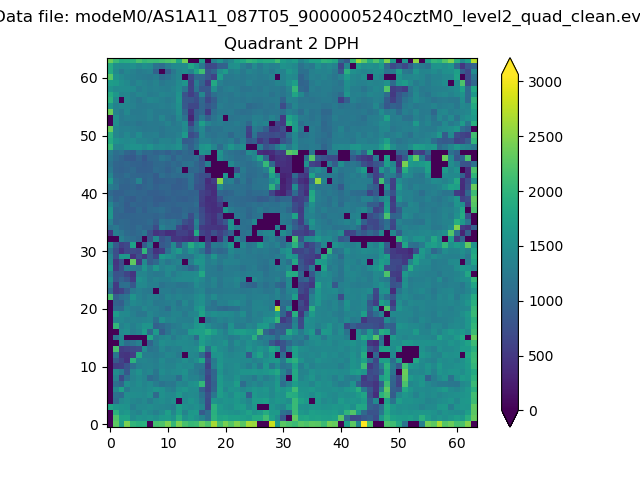
Histogram calculated using DETX and DETY for each event in the final _common_clean file
| Quadrant A |  |
 |
Quadrant B |
|---|---|---|---|
| Quadrant D |  |
 |
Quadrant C |
| Plot type | Count rate plots | Images |
|---|---|---|
| Comparison with Poisson distribution Blue bars denote a histogram of data divided into 1 sec bins. Red curve is a Poisson curve with rate = median count rate of data. |
 |
 |
| Quadrant-wise count rates Data is divided into 100 sec bins |
 |
|
| Module-wise count rates for Quadrant A Data is divided into 100 sec bins |
 |
 |
| Module-wise count rates for Quadrant B Data is divided into 100 sec bins |
 |
 |
| Module-wise count rates for Quadrant C Data is divided into 100 sec bins |
 |
 |
| Module-wise count rates for Quadrant D Data is divided into 100 sec bins |
 |
 |
| Parameter | Plot |
|---|---|
| CZT HV Monitor |  |
| D_VDD | 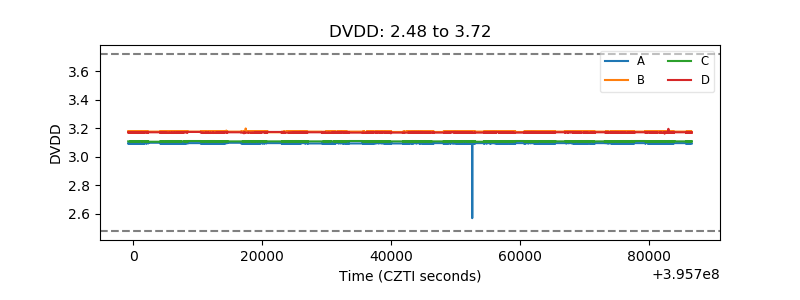 |
| Temperature 1 |  |
| Veto HV Monitor |  |
| Veto LLD |  |
| Alpha Counter |  |
| _CPM_Rate |  |
| CZT Counter |  |
| +2.5 Volts monitor | 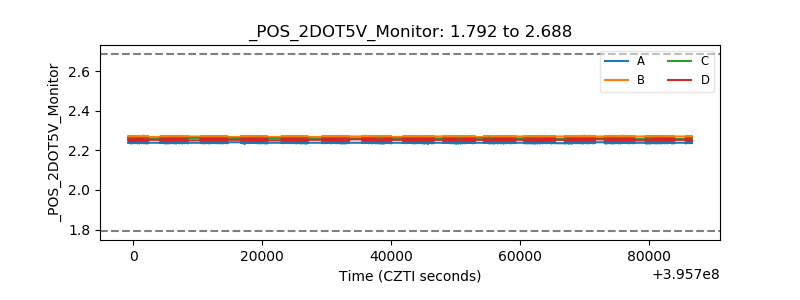 |
| +5 Volts monitor |  |
| _ROLL_ROT | 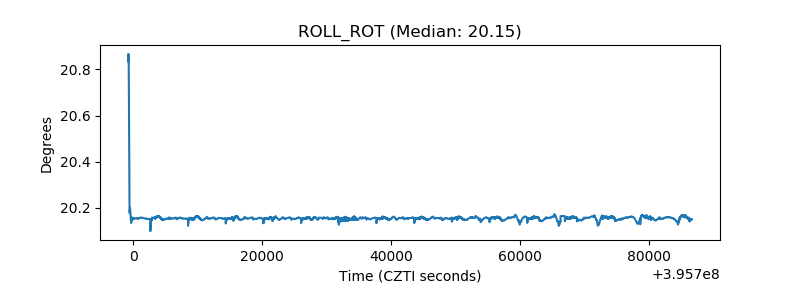 |
| _Roll_DEC |  |
| _Roll_RA | 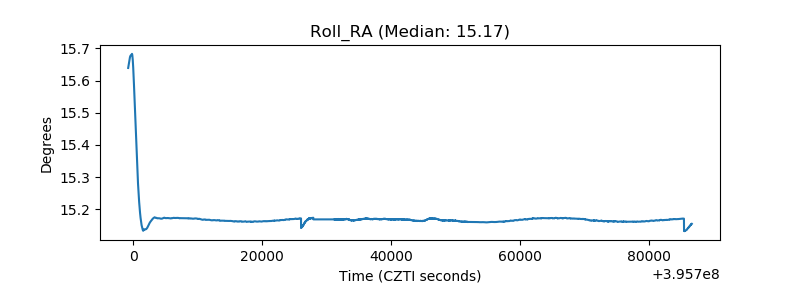 |
| Veto Counter | 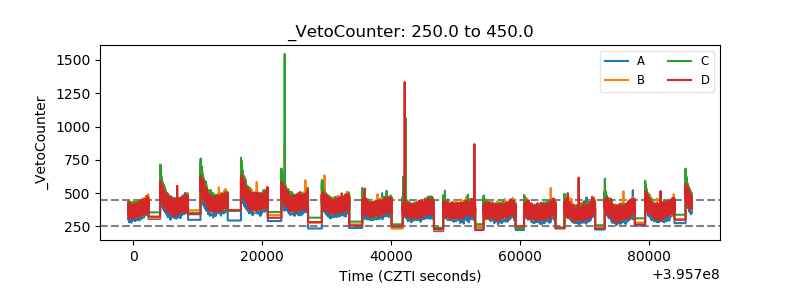 |