| Param | Original file | Final file |
|---|---|---|
| Filename | modeM0/AS1A11_087T05_9000005240_36765cztM0_level2.evt | modeM0/AS1A11_087T05_9000005240_36765cztM0_level2_quad_clean.evt |
| Size (bytes) | 558,794,880 | 55,252,800 |
| Size | 532.9 MB | 52.7 MB |
| Events in quadrant A | 1,921,826 | 422,714 |
| Events in quadrant B | 9,836,949 | 146,285 |
| Events in quadrant C | 1,959,999 | 428,935 |
| Events in quadrant D | 2,937,087 | 395,850 |
| Mode M0 | |||
|---|---|---|---|
| Quadrant | BADHDUFLAG | Total packets | Discarded packets |
| A | 0 | 8267 | 2 |
| B | 0 | 31914 | 1 |
| C | 0 | 8156 | 1 |
| D | 0 | 11429 | 1 |
| Mode M9 | |||
|---|---|---|---|
| Quadrant | BADHDUFLAG | Total packets | Discarded packets |
| A | 0 | 18 | 0 |
| B | 0 | 18 | 0 |
| C | 0 | 18 | 0 |
| D | 0 | 18 | 0 |
| Mode SS | |||
|---|---|---|---|
| Quadrant | BADHDUFLAG | Total packets | Discarded packets |
| A | 0 | 80 | 0 |
| B | 0 | 80 | 0 |
| C | 0 | 80 | 0 |
| D | 0 | 80 | 0 |
| Quadrant | Total seconds | Saturated seconds | Saturation percentage |
|---|---|---|---|
| A | 3936 | 4 | 0.101626% |
| B | 3936 | 3673 | 93.318089% |
| C | 3936 | 8 | 0.203252% |
| D | 3936 | 221 | 5.614837% |
Noise dominated data is calculated using 1-second bins in cleaned event files. If a bin has >2000 counts, and if more than 50% of those come from <1% of pixels, then it is considered to be noise-dominated and hence unusable.
| Quadrant | # 1 sec bins | Bins with >0 counts | Bins with >2000 counts | High rate bins dominated by noise | Noise dominated (total time) | Noise dominated (detector-on time) | Marked lightcurve |
|---|---|---|---|---|---|---|---|
| A | 5759 | 3937 | 1 | 1 | 0.02% | 0.03% | 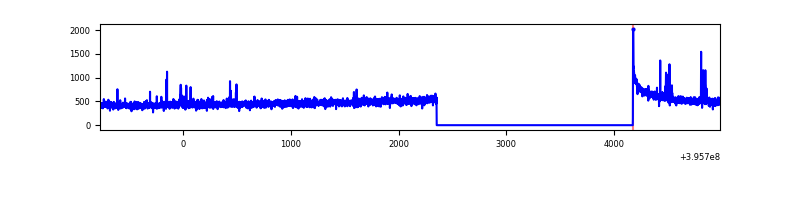 |
| B | 5759 | 3936 | 3534 | 3534 | 61.36% | 89.79% | 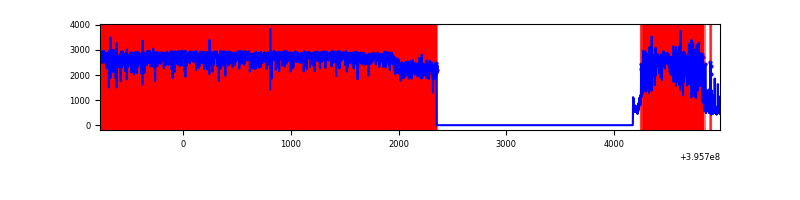 |
| C | 5759 | 3937 | 4 | 4 | 0.07% | 0.10% | 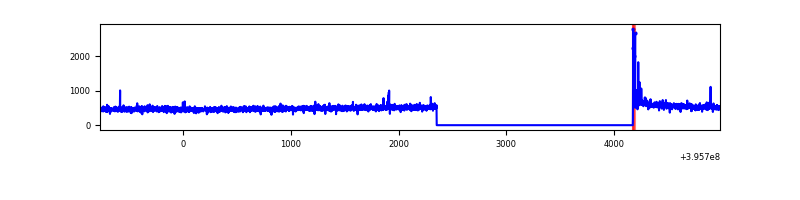 |
| D | 5759 | 3937 | 194 | 194 | 3.37% | 4.93% | 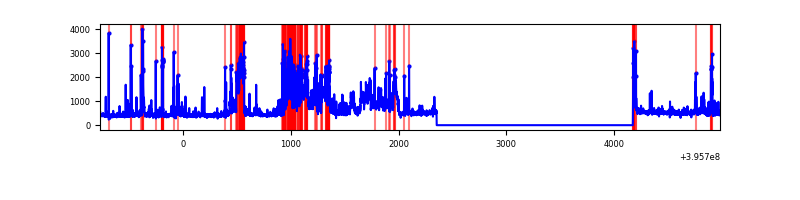 |
Top three noisy pixels from each quadrant. If the there are fewer than three noisy pixels in the level2.evt file, extra rows are filled as -1
| Pixel properties | Quadrant properties | ||||||
|---|---|---|---|---|---|---|---|
| Quadrant | DetID | PixID | Counts | Sigma | Mean | Median | Sigma |
| A | 10 | 83 | 128490 | 1383.62 | 454 | 446 | 92.5 |
| A | 9 | 143 | 29206 | 310.77 | 454 | 446 | 92.5 |
| A | 15 | 223 | 6555 | 66.01 | 454 | 446 | 92.5 |
| B | 12 | 1 | 9063927 | 277440.19 | 166 | 163 | 32.7 |
| B | 0 | 213 | 55205 | 1684.83 | 166 | 163 | 32.7 |
| B | 5 | 255 | 28497 | 867.3 | 166 | 163 | 32.7 |
| C | 15 | 214 | 163473 | 1521.7 | 451 | 453 | 107.1 |
| C | 0 | 10 | 24041 | 220.18 | 451 | 453 | 107.1 |
| C | 0 | 207 | 15082 | 136.55 | 451 | 453 | 107.1 |
| D | 13 | 249 | 1017296 | 9311.89 | 442 | 431 | 109.2 |
| D | 12 | 227 | 51506 | 467.72 | 442 | 431 | 109.2 |
| D | 13 | 171 | 48081 | 436.35 | 442 | 431 | 109.2 |
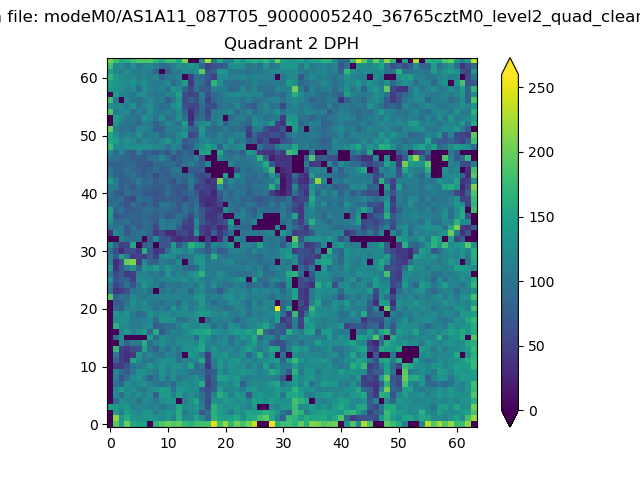
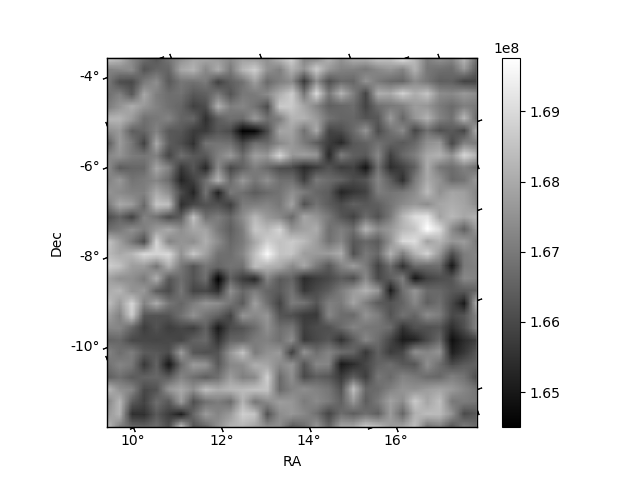
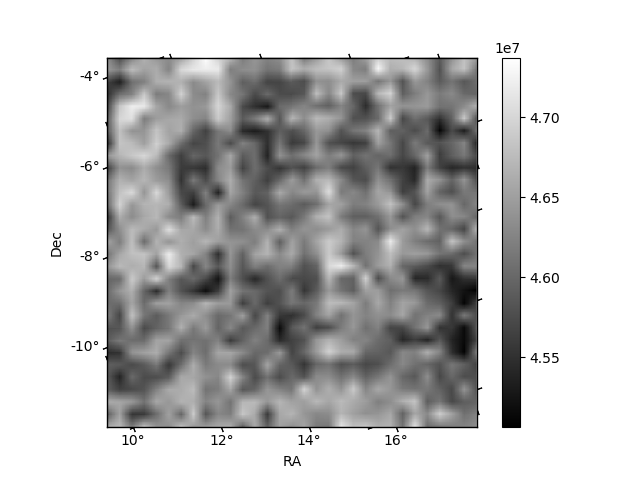
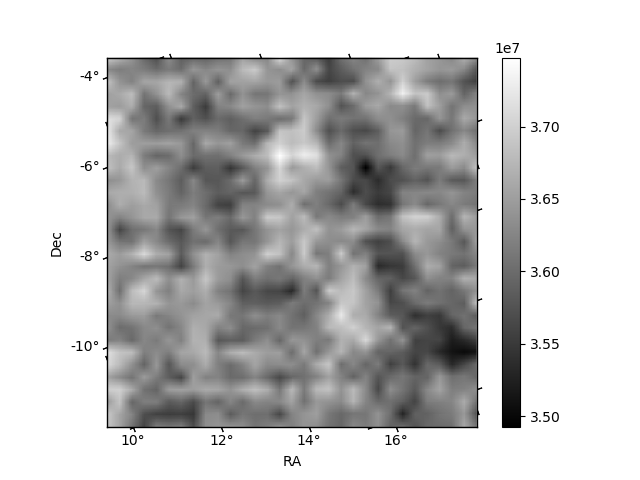
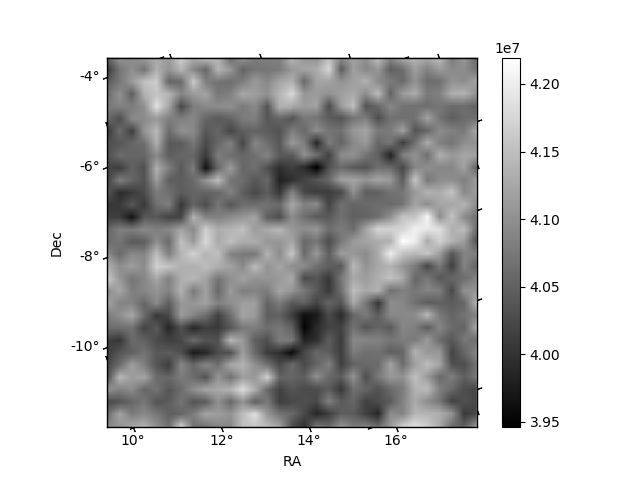
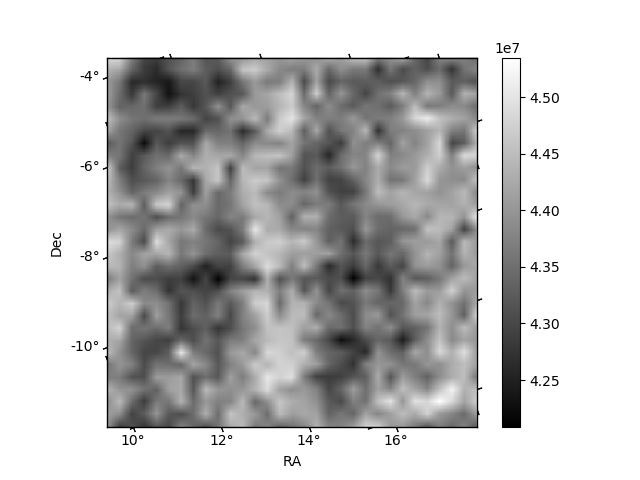
Histogram calculated using DETX and DETY for each event in the final _common_clean file
| Quadrant A | 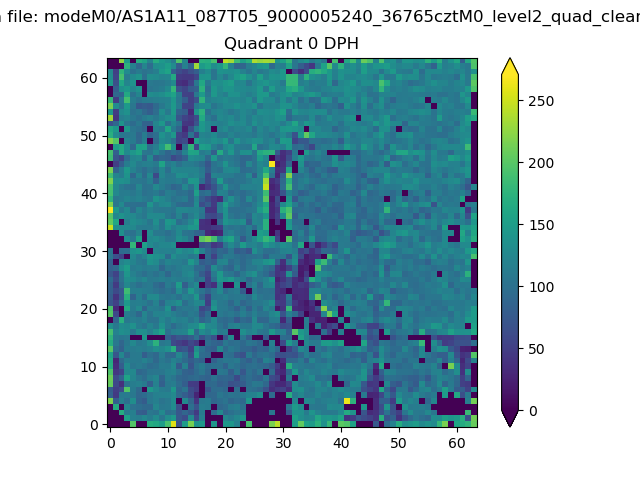 |
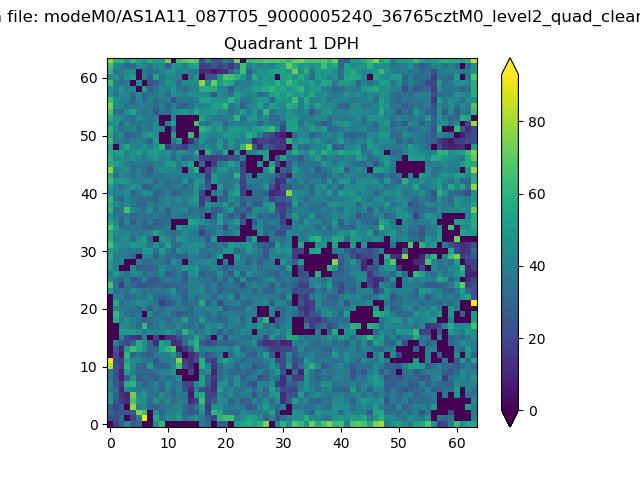 |
Quadrant B |
|---|---|---|---|
| Quadrant D | 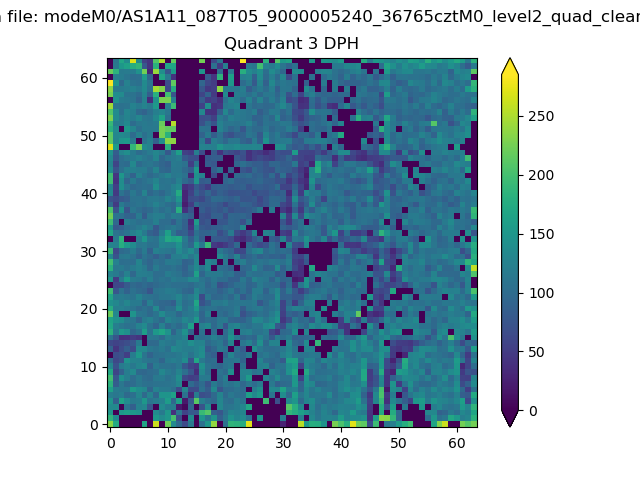 |
 |
Quadrant C |
| Plot type | Count rate plots | Images |
|---|---|---|
| Comparison with Poisson distribution Blue bars denote a histogram of data divided into 1 sec bins. Red curve is a Poisson curve with rate = median count rate of data. |
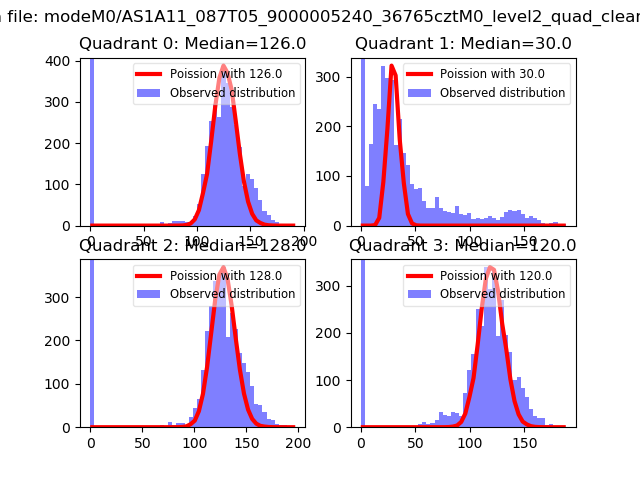 |
 |
| Quadrant-wise count rates Data is divided into 100 sec bins |
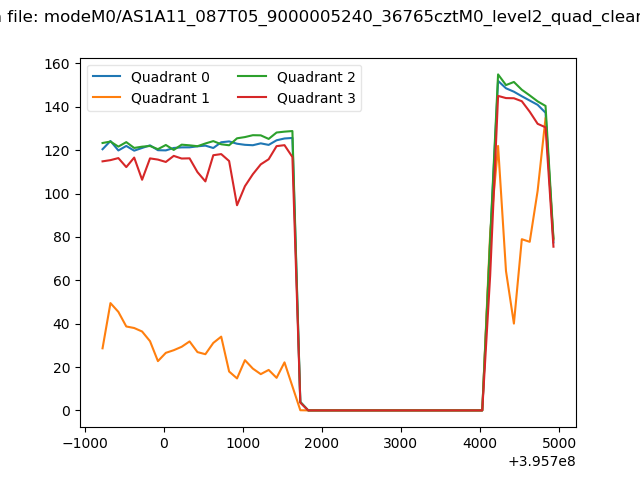 |
|
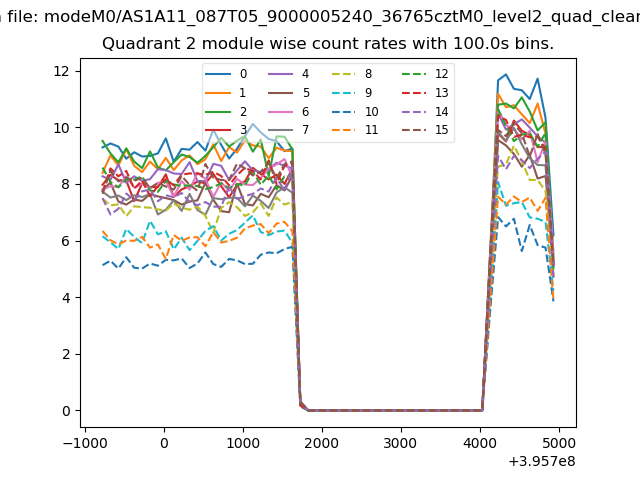
| Module-wise count rates for Quadrant A Data is divided into 100 sec bins |
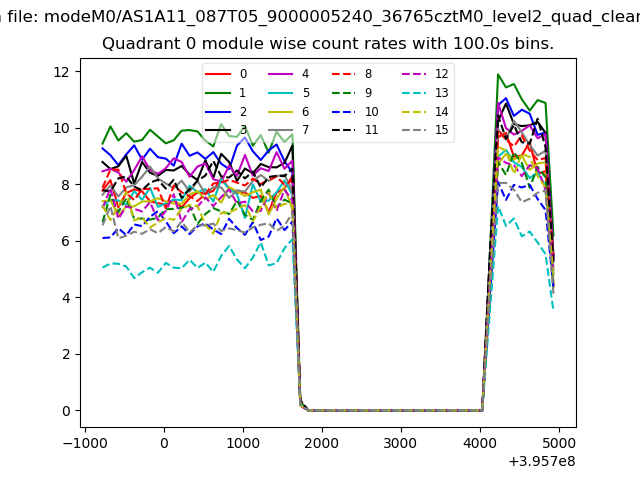 |
 |
| Module-wise count rates for Quadrant B Data is divided into 100 sec bins |
 |
 |
| Module-wise count rates for Quadrant C Data is divided into 100 sec bins |
 |
 |
| Module-wise count rates for Quadrant D Data is divided into 100 sec bins |
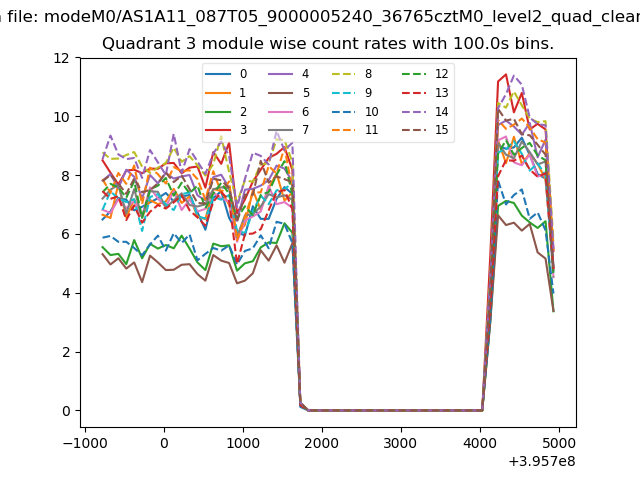 |
 |
| Parameter | Plot |
|---|---|
| CZT HV Monitor | 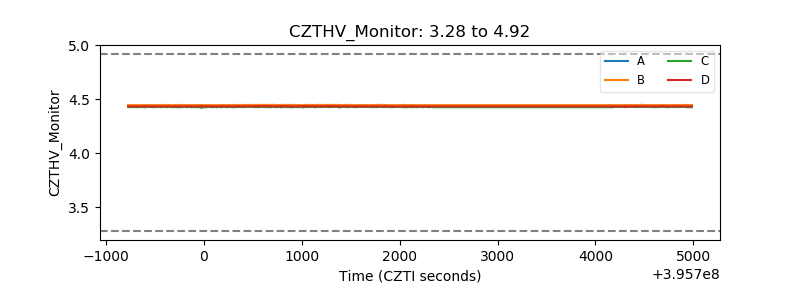 |
| D_VDD | 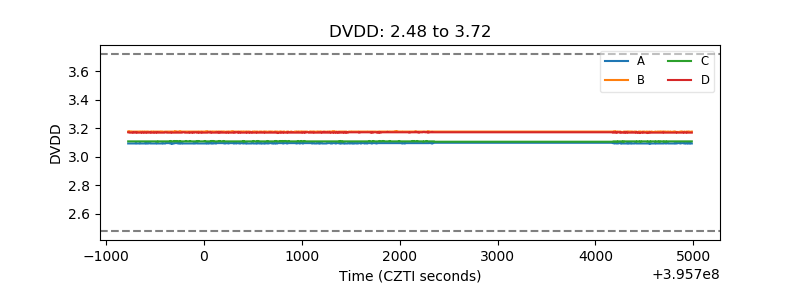 |
| Temperature 1 | 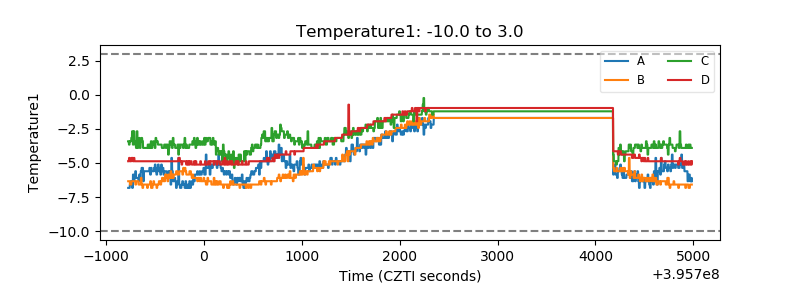 |
| Veto HV Monitor | 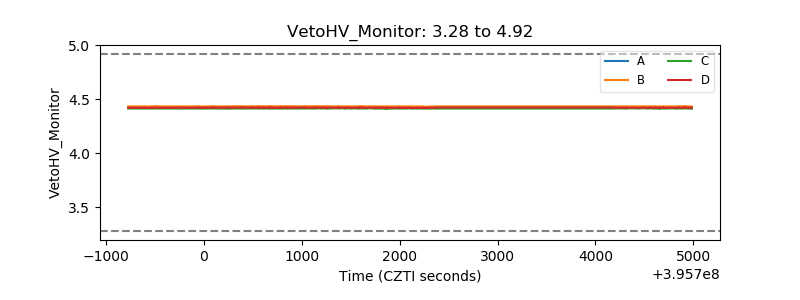 |
| Veto LLD | 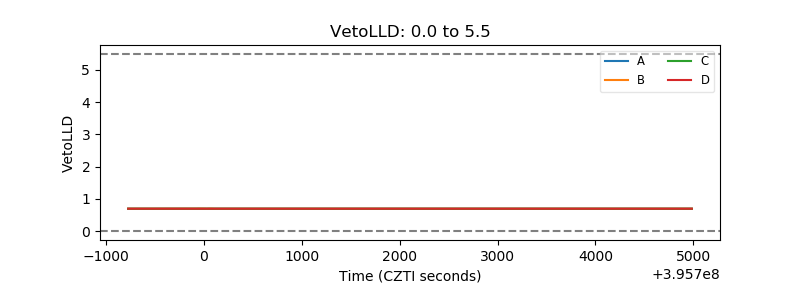 |
| Alpha Counter | 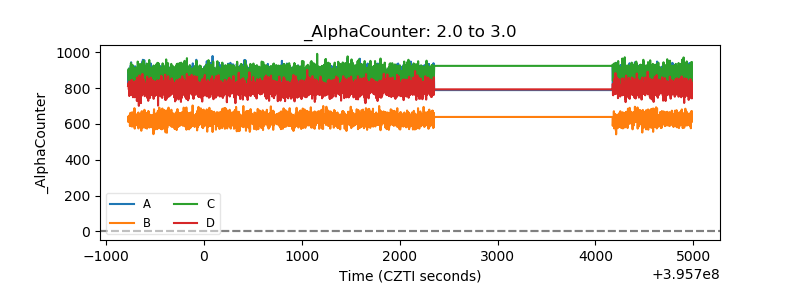 |
| _CPM_Rate | 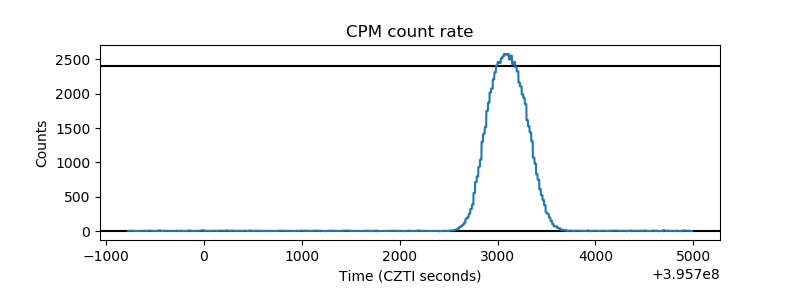 |
| CZT Counter | 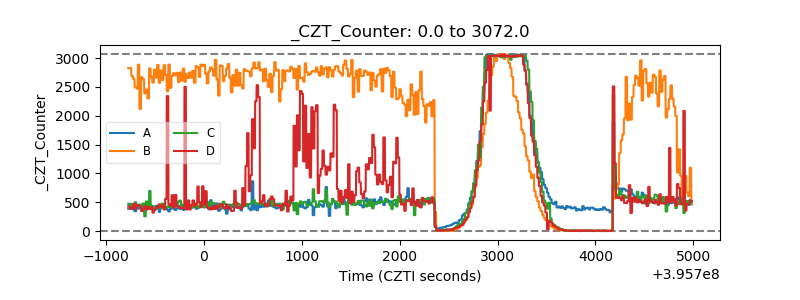 |
| +2.5 Volts monitor |  |
| +5 Volts monitor |  |
| _ROLL_ROT | 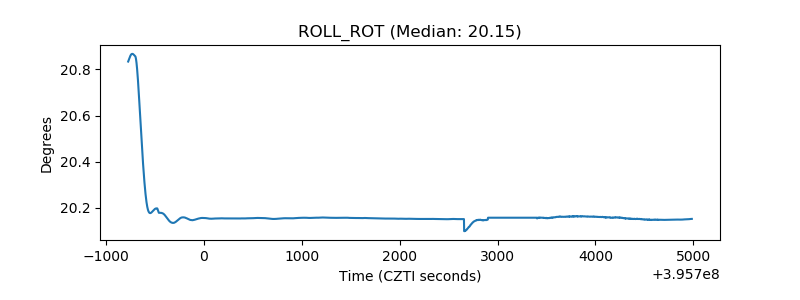 |
| _Roll_DEC | 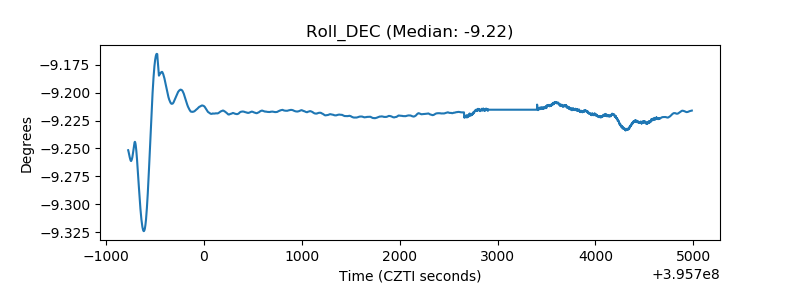 |
| _Roll_RA | 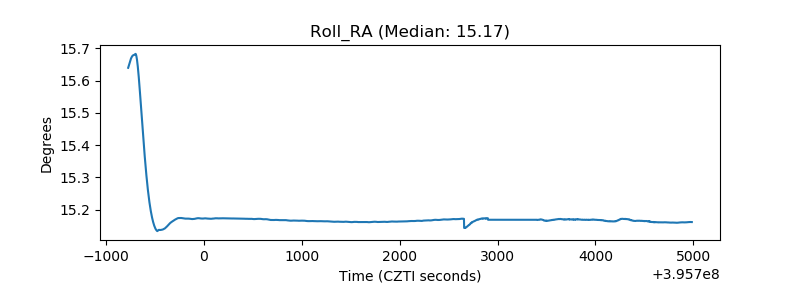 |
| Veto Counter |  |