| Param | Original file | Final file |
|---|---|---|
| Filename | modeM0/AS1A11_087T05_9000005240_36766cztM0_level2.evt | modeM0/AS1A11_087T05_9000005240_36766cztM0_level2_quad_clean.evt |
| Size (bytes) | 659,260,800 | 74,753,280 |
| Size | 628.7 MB | 71.3 MB |
| Events in quadrant A | 2,627,884 | 553,715 |
| Events in quadrant B | 11,418,934 | 256,520 |
| Events in quadrant C | 2,650,156 | 568,495 |
| Events in quadrant D | 2,926,460 | 529,365 |
| Mode M0 | |||
|---|---|---|---|
| Quadrant | BADHDUFLAG | Total packets | Discarded packets |
| A | 0 | 11005 | 3 |
| B | 0 | 37299 | 2 |
| C | 0 | 10762 | 2 |
| D | 0 | 11961 | 2 |
| Mode M9 | |||
|---|---|---|---|
| Quadrant | BADHDUFLAG | Total packets | Discarded packets |
| A | 0 | 28 | 0 |
| B | 0 | 28 | 0 |
| C | 0 | 28 | 0 |
| D | 0 | 29 | 0 |
| Mode SS | |||
|---|---|---|---|
| Quadrant | BADHDUFLAG | Total packets | Discarded packets |
| A | 0 | 102 | 0 |
| B | 0 | 102 | 0 |
| C | 0 | 102 | 0 |
| D | 0 | 102 | 0 |
| Quadrant | Total seconds | Saturated seconds | Saturation percentage |
|---|---|---|---|
| A | 5054 | 15 | 0.296795% |
| B | 5054 | 3928 | 77.720617% |
| C | 5054 | 19 | 0.375940% |
| D | 5054 | 137 | 2.710724% |
Noise dominated data is calculated using 1-second bins in cleaned event files. If a bin has >2000 counts, and if more than 50% of those come from <1% of pixels, then it is considered to be noise-dominated and hence unusable.
| Quadrant | # 1 sec bins | Bins with >0 counts | Bins with >2000 counts | High rate bins dominated by noise | Noise dominated (total time) | Noise dominated (detector-on time) | Marked lightcurve |
|---|---|---|---|---|---|---|---|
| A | 6997 | 5055 | 8 | 8 | 0.11% | 0.16% | 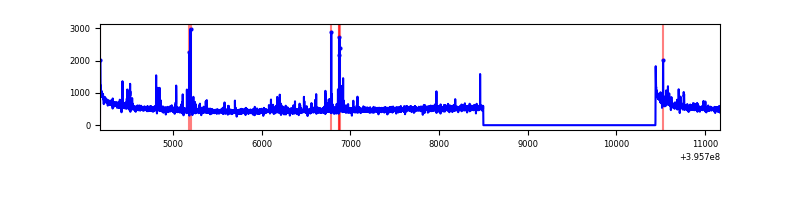 |
| B | 6997 | 5054 | 3811 | 3811 | 54.47% | 75.41% | 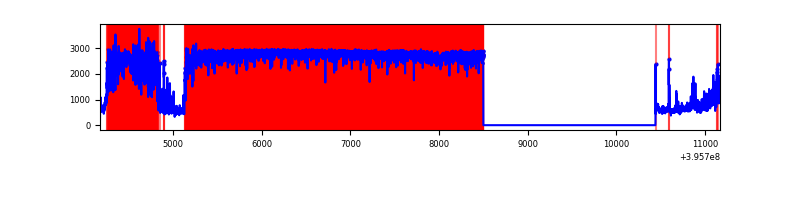 |
| C | 6997 | 5055 | 9 | 9 | 0.13% | 0.18% | 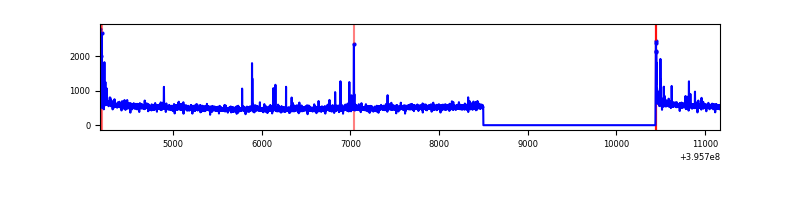 |
| D | 6997 | 5055 | 102 | 102 | 1.46% | 2.02% | 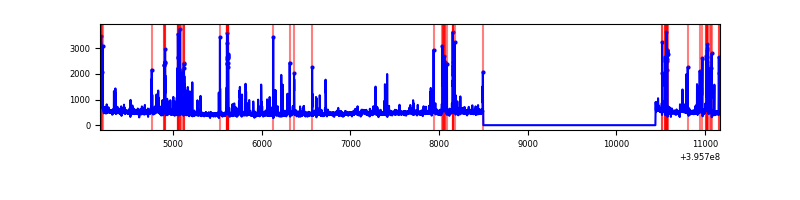 |
Top three noisy pixels from each quadrant. If the there are fewer than three noisy pixels in the level2.evt file, extra rows are filled as -1
| Pixel properties | Quadrant properties | ||||||
|---|---|---|---|---|---|---|---|
| Quadrant | DetID | PixID | Counts | Sigma | Mean | Median | Sigma |
| A | 10 | 83 | 201509 | 1649.03 | 602 | 592 | 121.8 |
| A | 9 | 143 | 88043 | 717.76 | 602 | 592 | 121.8 |
| A | 13 | 254 | 7845 | 59.53 | 602 | 592 | 121.8 |
| B | 12 | 1 | 10175735 | 198425.42 | 269 | 262 | 51.3 |
| B | 0 | 213 | 73733 | 1432.71 | 269 | 262 | 51.3 |
| B | 5 | 255 | 54375 | 1055.22 | 269 | 262 | 51.3 |
| C | 15 | 214 | 216133 | 1545.15 | 601 | 607 | 139.5 |
| C | 0 | 10 | 49959 | 353.82 | 601 | 607 | 139.5 |
| C | 14 | 254 | 18921 | 131.3 | 601 | 607 | 139.5 |
| D | 13 | 249 | 361092 | 2511.01 | 591 | 577 | 143.6 |
| D | 12 | 6 | 119438 | 827.88 | 591 | 577 | 143.6 |
| D | 2 | 250 | 50579 | 348.27 | 591 | 577 | 143.6 |
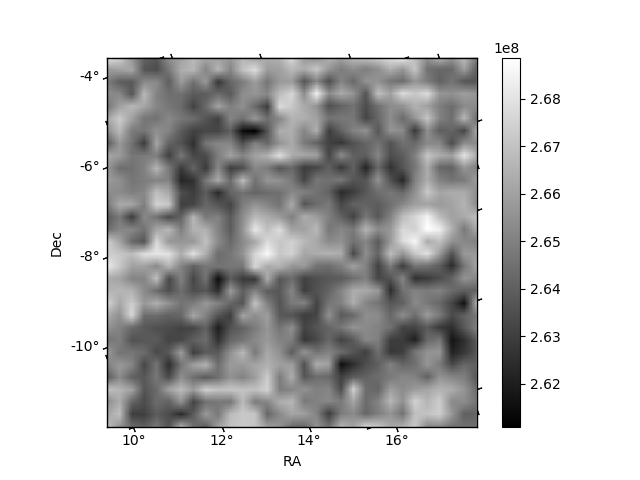
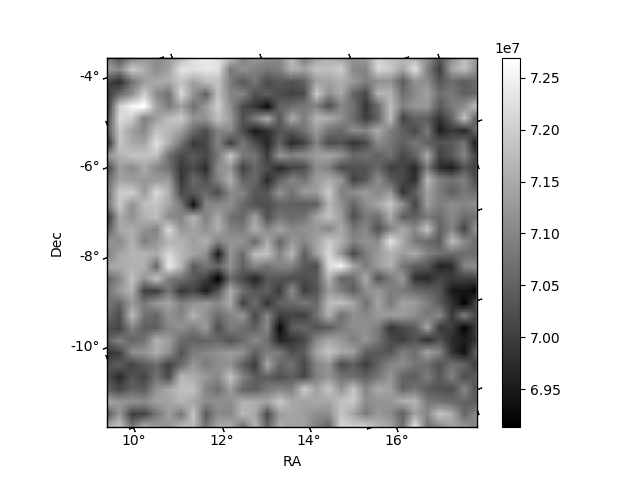
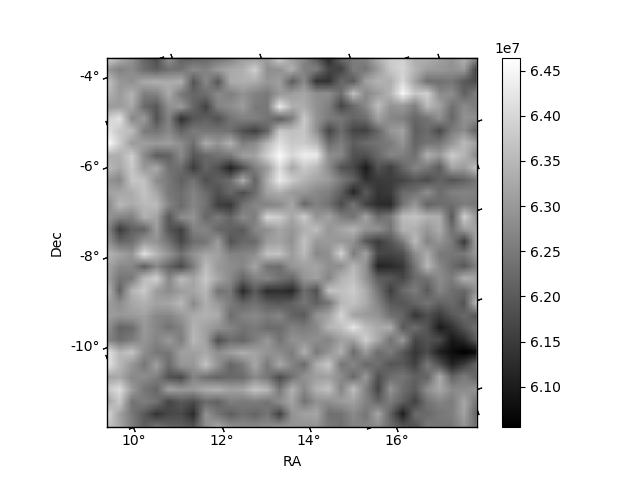
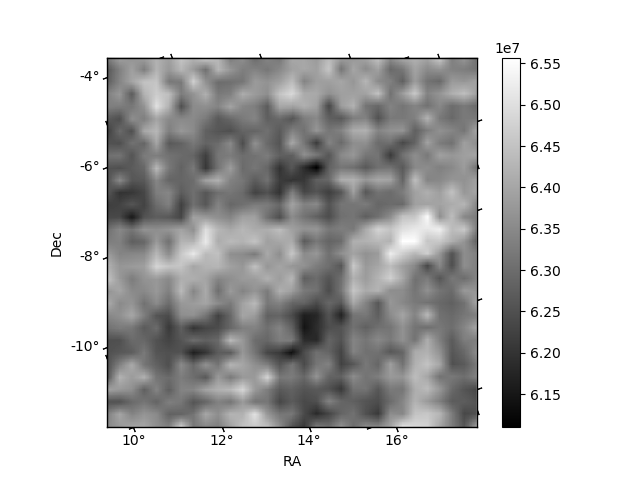
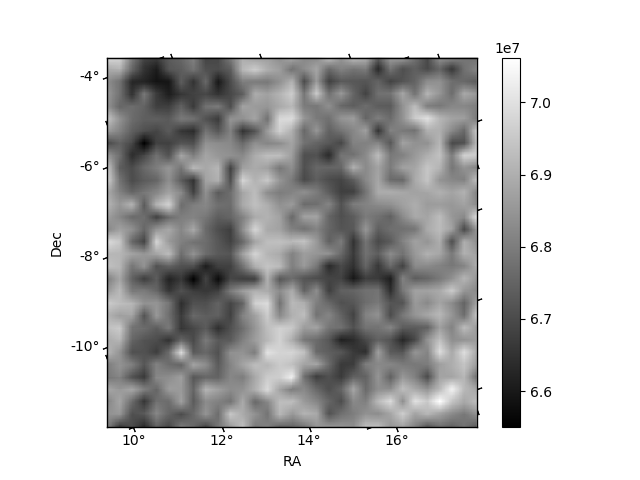
Histogram calculated using DETX and DETY for each event in the final _common_clean file
| Quadrant A | 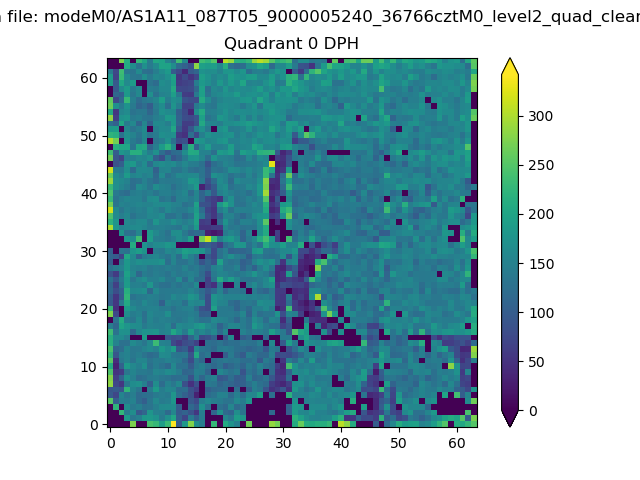 |
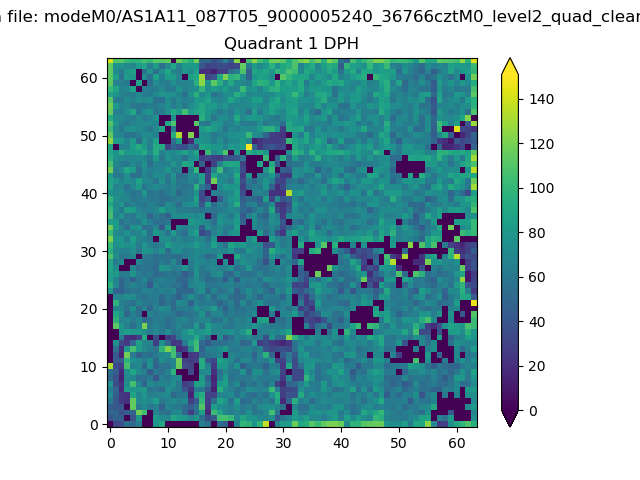 |
Quadrant B |
|---|---|---|---|
| Quadrant D | 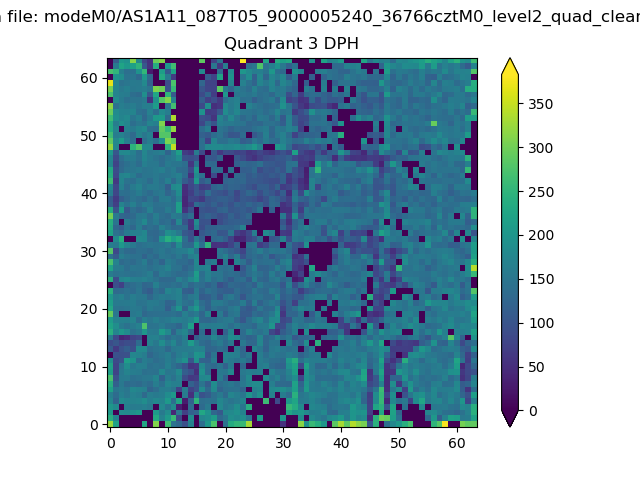 |
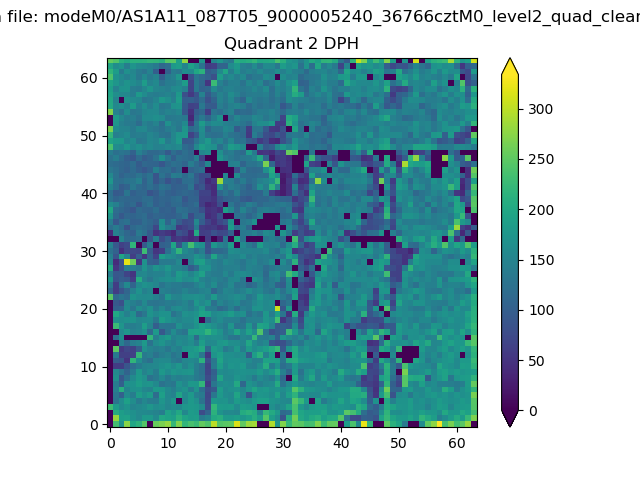 |
Quadrant C |
| Plot type | Count rate plots | Images |
|---|---|---|
| Comparison with Poisson distribution Blue bars denote a histogram of data divided into 1 sec bins. Red curve is a Poisson curve with rate = median count rate of data. |
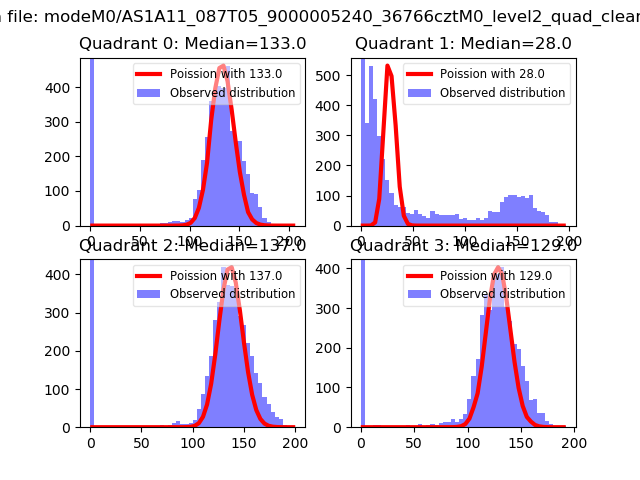 |
 |
| Quadrant-wise count rates Data is divided into 100 sec bins |
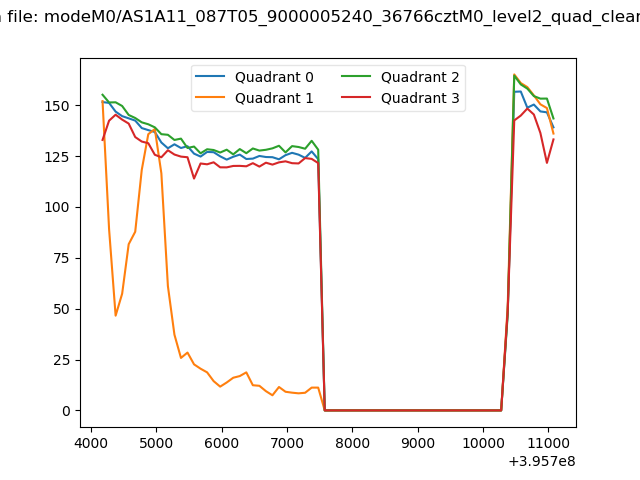 |
|
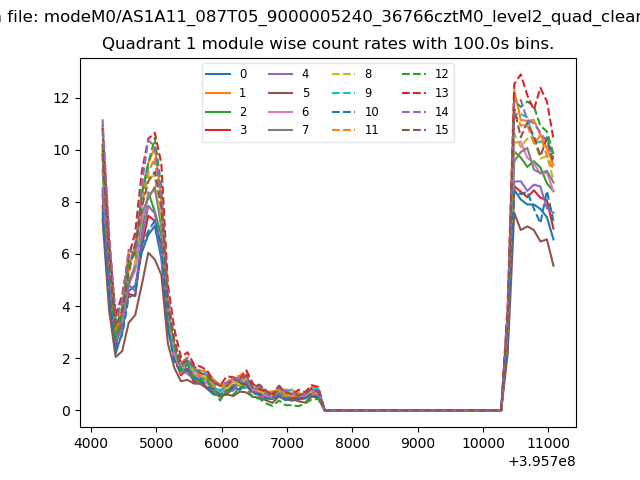
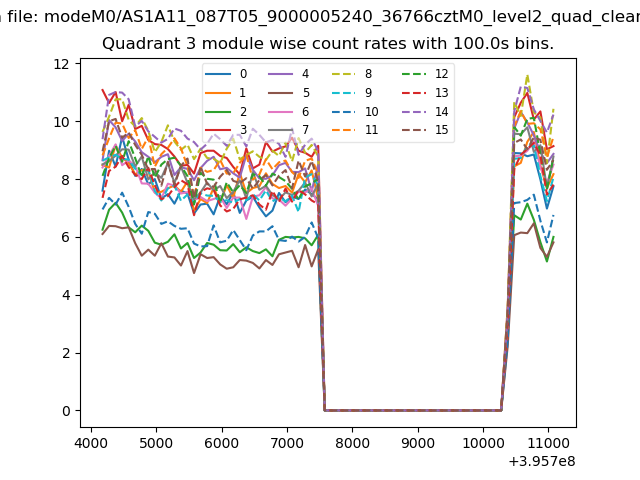
| Module-wise count rates for Quadrant A Data is divided into 100 sec bins |
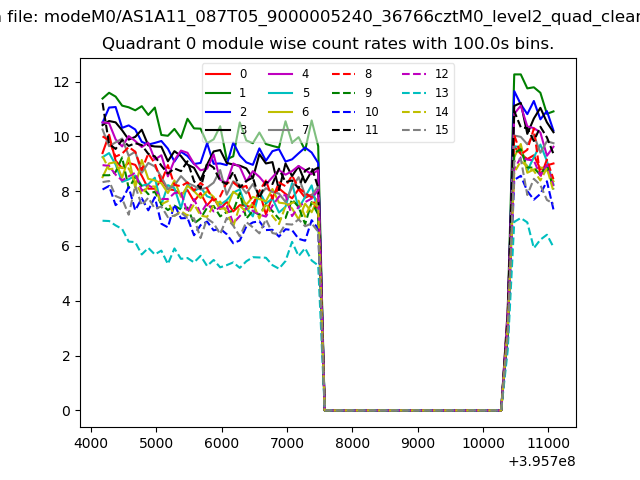 |
 |
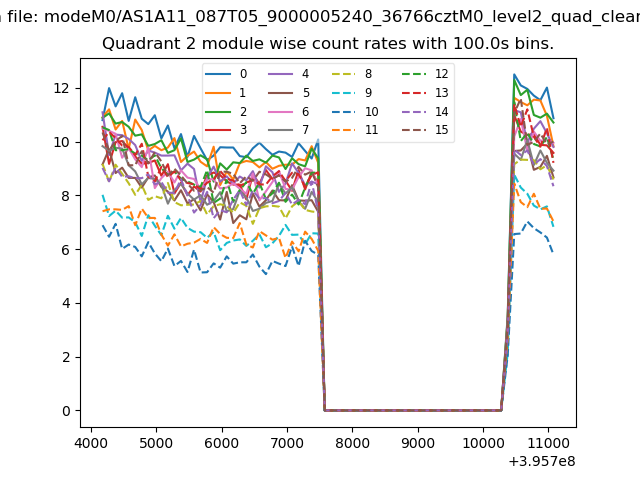
| Module-wise count rates for Quadrant B Data is divided into 100 sec bins |
 |
 |
| Module-wise count rates for Quadrant C Data is divided into 100 sec bins |
 |
 |
| Module-wise count rates for Quadrant D Data is divided into 100 sec bins |
 |
 |
| Parameter | Plot |
|---|---|
| CZT HV Monitor | 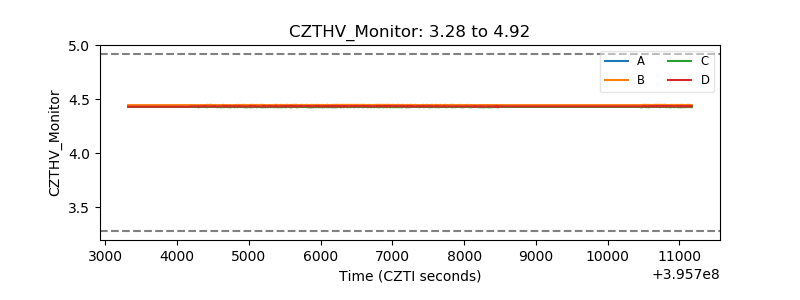 |
| D_VDD |  |
| Temperature 1 | 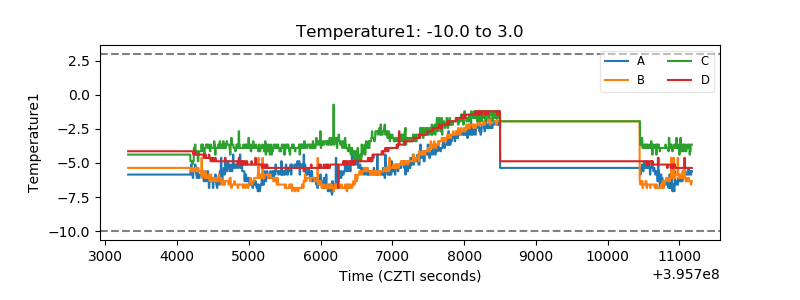 |
| Veto HV Monitor | 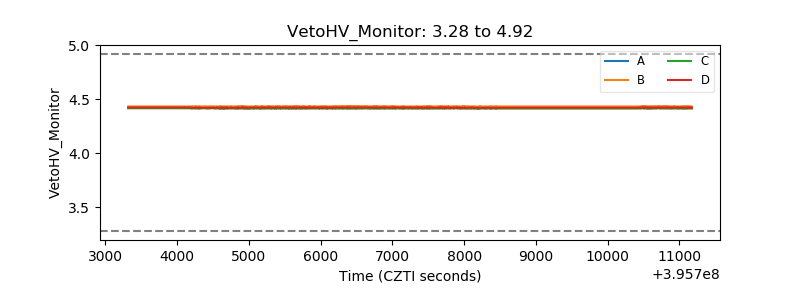 |
| Veto LLD | 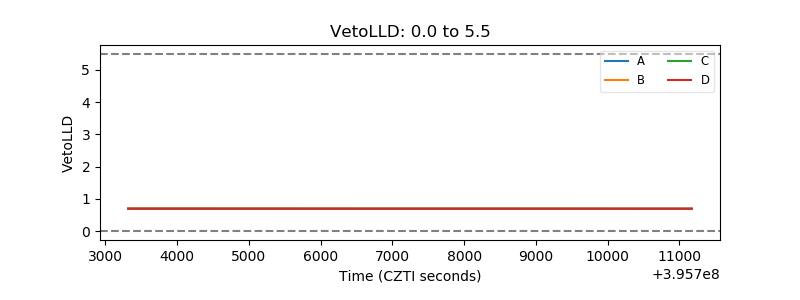 |
| Alpha Counter | 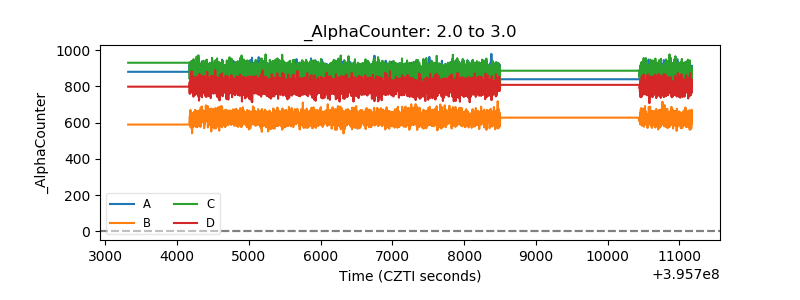 |
| _CPM_Rate | 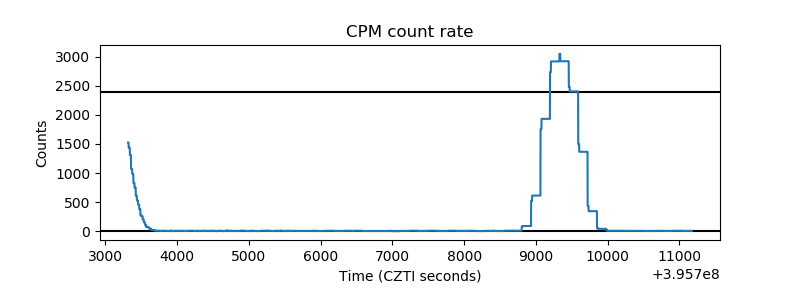 |
| CZT Counter | 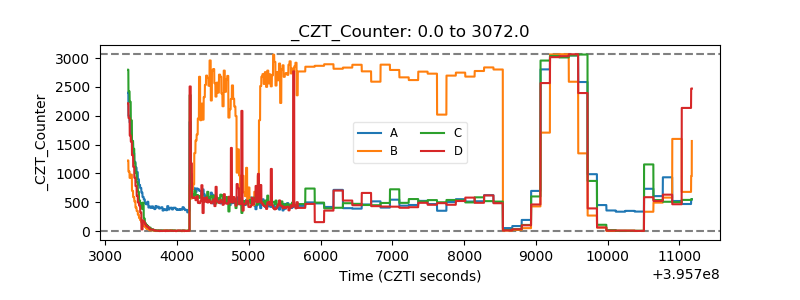 |
| +2.5 Volts monitor |  |
| +5 Volts monitor |  |
| _ROLL_ROT | 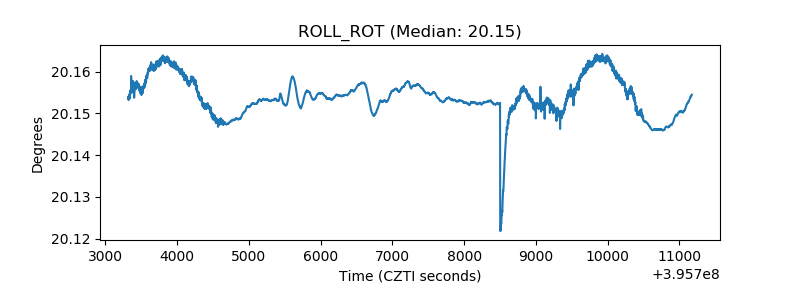 |
| _Roll_DEC | 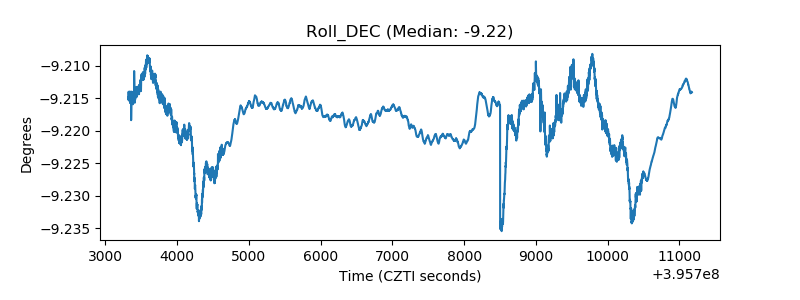 |
| _Roll_RA | 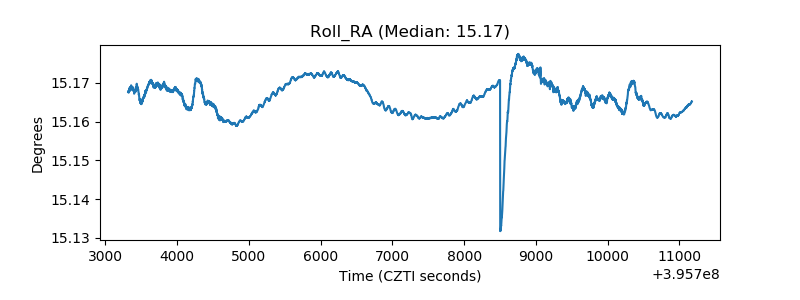 |
| Veto Counter | 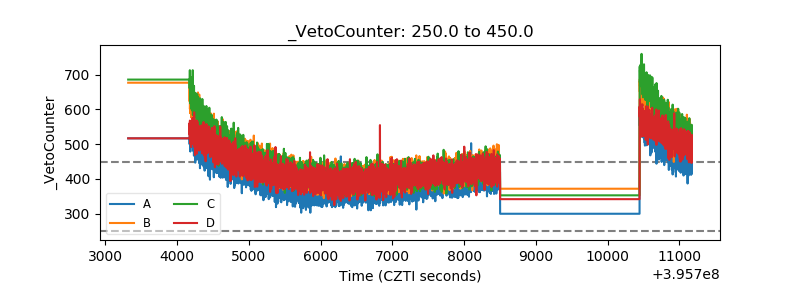 |