| Param | Original file | Final file |
|---|---|---|
| Filename | modeM0/AS1A11_087T05_9000005240_36768cztM0_level2.evt | modeM0/AS1A11_087T05_9000005240_36768cztM0_level2_quad_clean.evt |
| Size (bytes) | 662,091,840 | 63,573,120 |
| Size | 631.4 MB | 60.6 MB |
| Events in quadrant A | 2,545,849 | 461,653 |
| Events in quadrant B | 11,523,719 | 195,056 |
| Events in quadrant C | 2,736,071 | 474,675 |
| Events in quadrant D | 2,909,824 | 444,382 |
| Mode M0 | |||
|---|---|---|---|
| Quadrant | BADHDUFLAG | Total packets | Discarded packets |
| A | 0 | 10532 | 3 |
| B | 0 | 37573 | 2 |
| C | 0 | 10953 | 2 |
| D | 0 | 11745 | 2 |
| Mode M9 | |||
|---|---|---|---|
| Quadrant | BADHDUFLAG | Total packets | Discarded packets |
| A | 0 | 37 | 0 |
| B | 0 | 37 | 0 |
| C | 0 | 37 | 0 |
| D | 0 | 38 | 0 |
| Mode SS | |||
|---|---|---|---|
| Quadrant | BADHDUFLAG | Total packets | Discarded packets |
| A | 0 | 102 | 0 |
| B | 0 | 102 | 0 |
| C | 0 | 102 | 0 |
| D | 0 | 102 | 0 |
| Quadrant | Total seconds | Saturated seconds | Saturation percentage |
|---|---|---|---|
| A | 4958 | 13 | 0.262203% |
| B | 4958 | 4129 | 83.279548% |
| C | 4958 | 27 | 0.544574% |
| D | 4958 | 92 | 1.855587% |
Noise dominated data is calculated using 1-second bins in cleaned event files. If a bin has >2000 counts, and if more than 50% of those come from <1% of pixels, then it is considered to be noise-dominated and hence unusable.
| Quadrant | # 1 sec bins | Bins with >0 counts | Bins with >2000 counts | High rate bins dominated by noise | Noise dominated (total time) | Noise dominated (detector-on time) | Marked lightcurve |
|---|---|---|---|---|---|---|---|
| A | 7081 | 4959 | 4 | 4 | 0.06% | 0.08% | 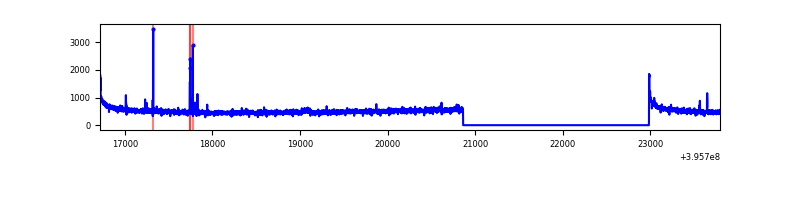 |
| B | 7080 | 4957 | 3947 | 3947 | 55.75% | 79.62% | 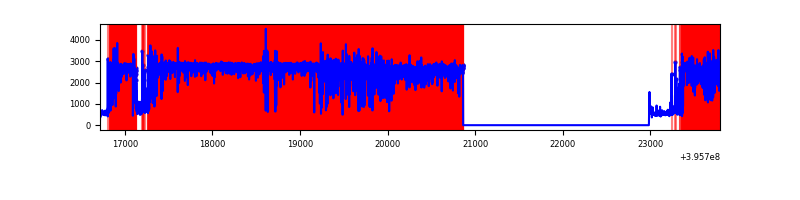 |
| C | 7081 | 4959 | 23 | 23 | 0.32% | 0.46% | 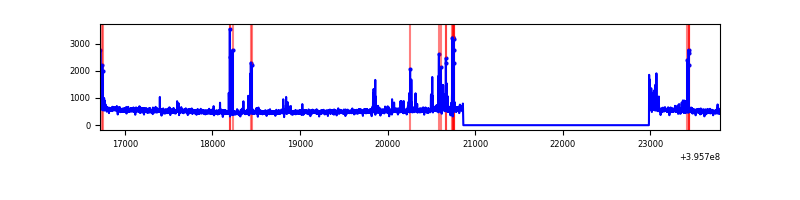 |
| D | 7081 | 4959 | 73 | 73 | 1.03% | 1.47% | 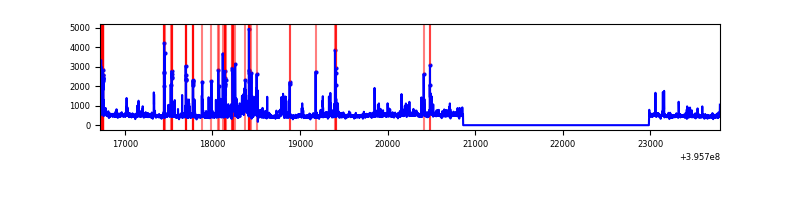 |
Top three noisy pixels from each quadrant. If the there are fewer than three noisy pixels in the level2.evt file, extra rows are filled as -1
| Pixel properties | Quadrant properties | ||||||
|---|---|---|---|---|---|---|---|
| Quadrant | DetID | PixID | Counts | Sigma | Mean | Median | Sigma |
| A | 10 | 83 | 200529 | 1680.88 | 596 | 587 | 119.0 |
| A | 9 | 143 | 25722 | 211.31 | 596 | 587 | 119.0 |
| A | 15 | 223 | 8282 | 64.69 | 596 | 587 | 119.0 |
| B | 12 | 1 | 10312007 | 188574.03 | 281 | 274 | 54.7 |
| B | 0 | 213 | 33831 | 613.67 | 281 | 274 | 54.7 |
| B | 0 | 219 | 17209 | 309.7 | 281 | 274 | 54.7 |
| C | 15 | 214 | 212530 | 1543.87 | 592 | 598 | 137.3 |
| C | 14 | 254 | 152634 | 1107.54 | 592 | 598 | 137.3 |
| C | 0 | 10 | 33007 | 236.09 | 592 | 598 | 137.3 |
| D | 13 | 249 | 253173 | 1787.29 | 586 | 573 | 141.3 |
| D | 10 | 118 | 136930 | 964.81 | 586 | 573 | 141.3 |
| D | 2 | 250 | 67402 | 472.85 | 586 | 573 | 141.3 |
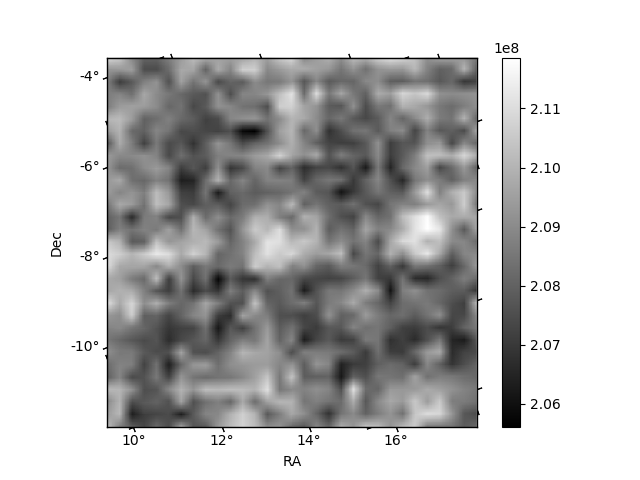
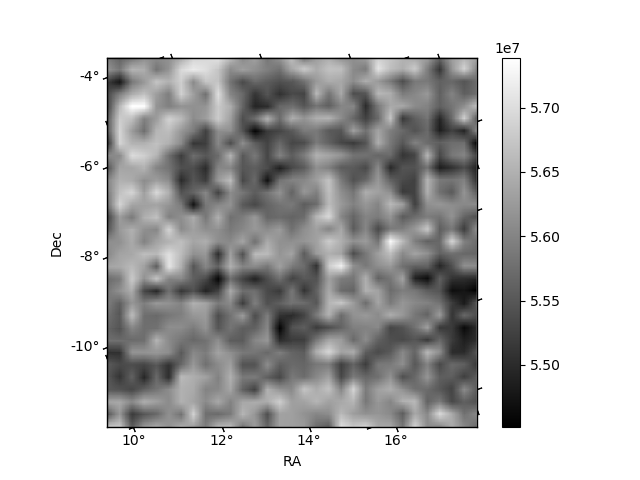
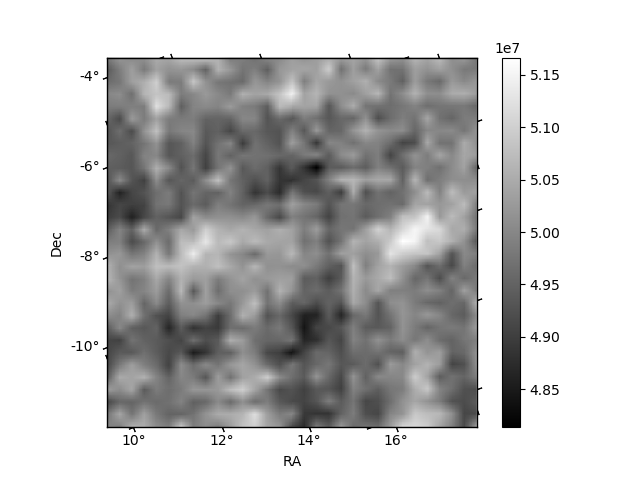
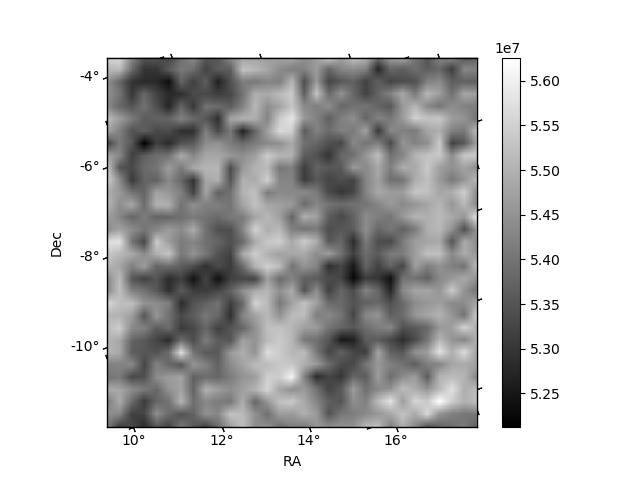
Histogram calculated using DETX and DETY for each event in the final _common_clean file
| Quadrant A | 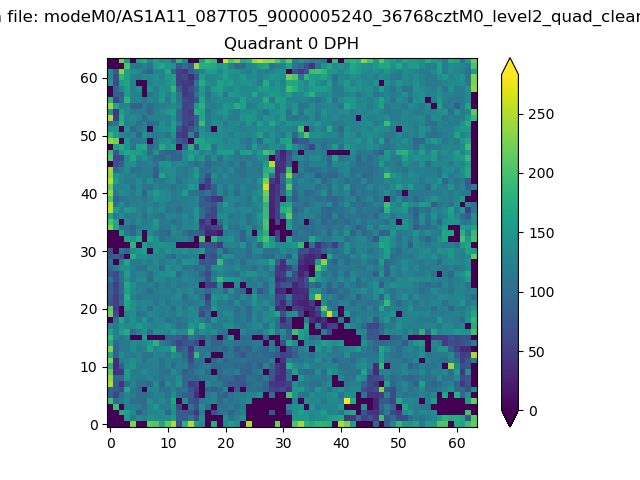 |
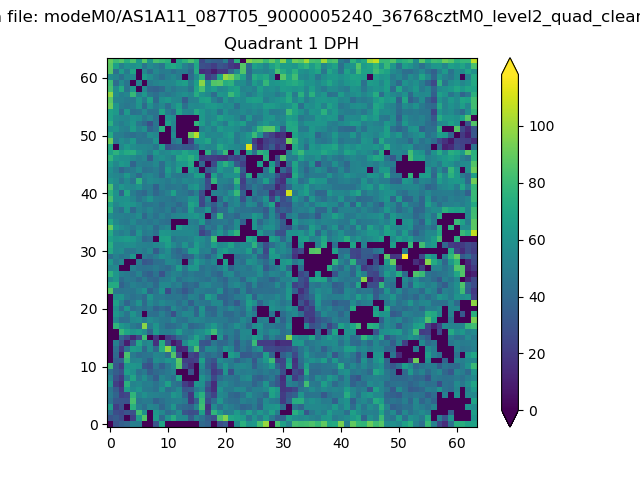 |
Quadrant B |
|---|---|---|---|
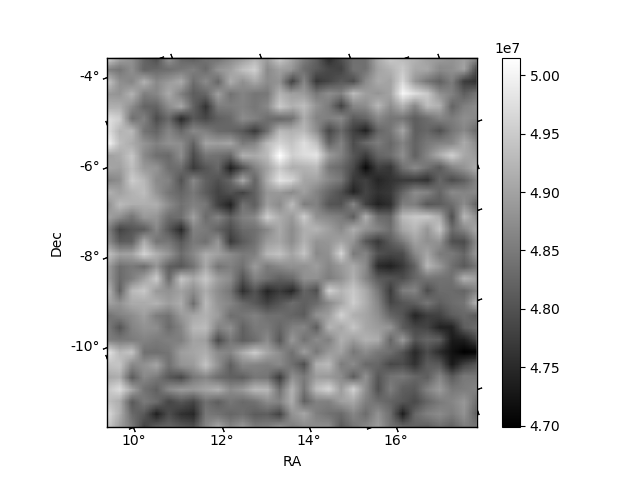
| Quadrant D | 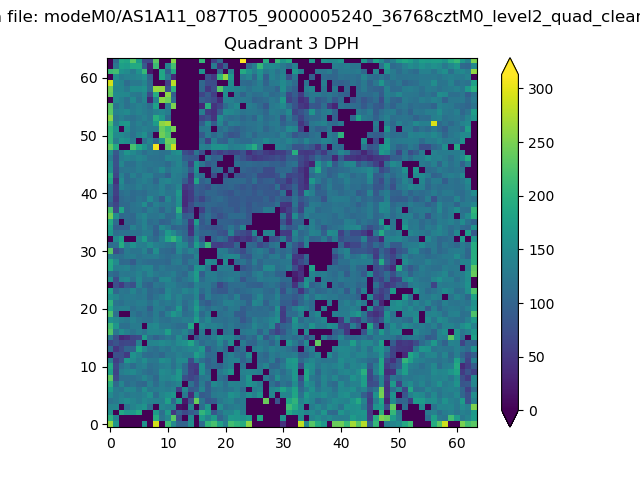 |
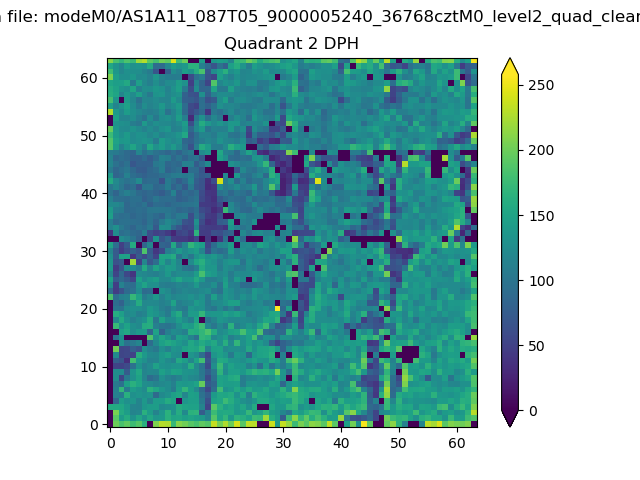 |
Quadrant C |
| Plot type | Count rate plots | Images |
|---|---|---|
| Comparison with Poisson distribution Blue bars denote a histogram of data divided into 1 sec bins. Red curve is a Poisson curve with rate = median count rate of data. |
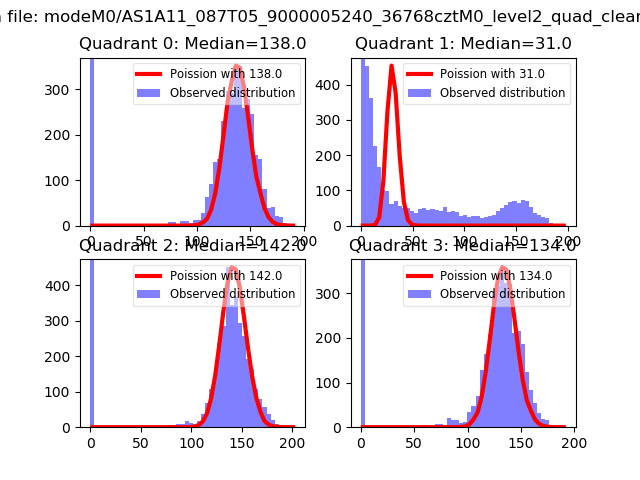 |
 |
| Quadrant-wise count rates Data is divided into 100 sec bins |
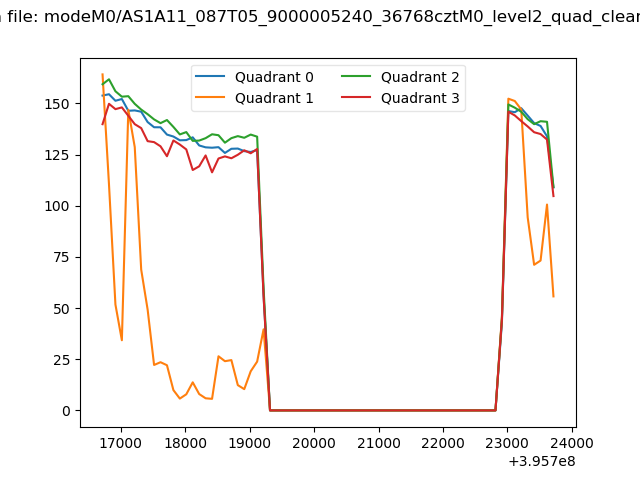 |
|
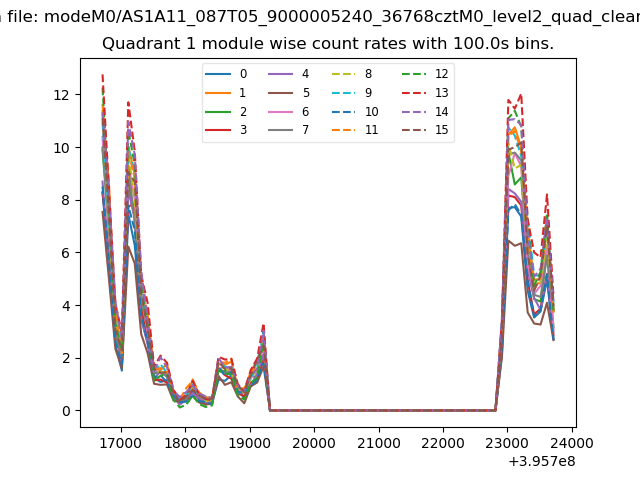
| Module-wise count rates for Quadrant A Data is divided into 100 sec bins |
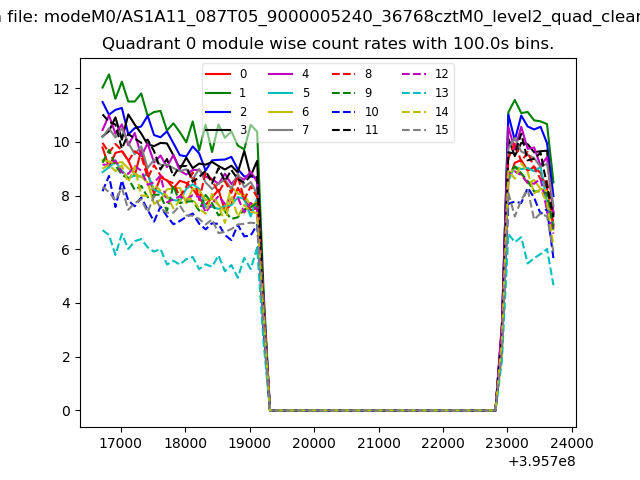 |
 |
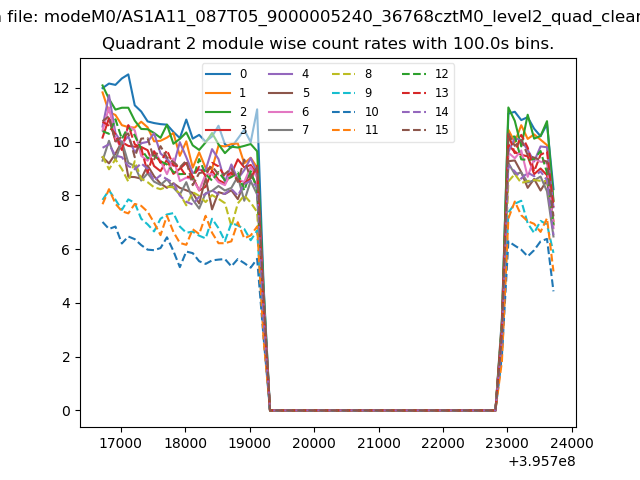
| Module-wise count rates for Quadrant B Data is divided into 100 sec bins |
 |
 |
| Module-wise count rates for Quadrant C Data is divided into 100 sec bins |
 |
 |
| Module-wise count rates for Quadrant D Data is divided into 100 sec bins |
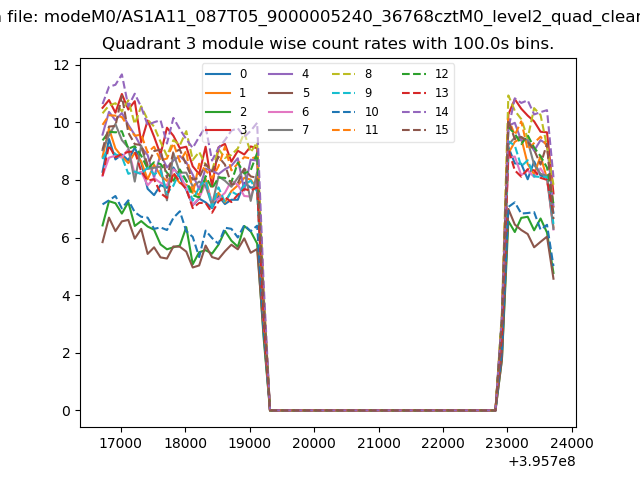 |
 |
| Parameter | Plot |
|---|---|
| CZT HV Monitor | 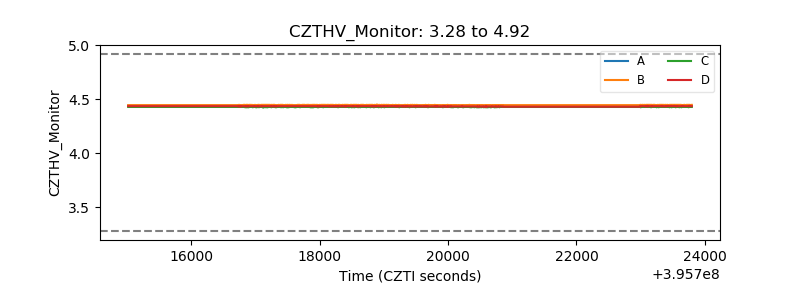 |
| D_VDD | 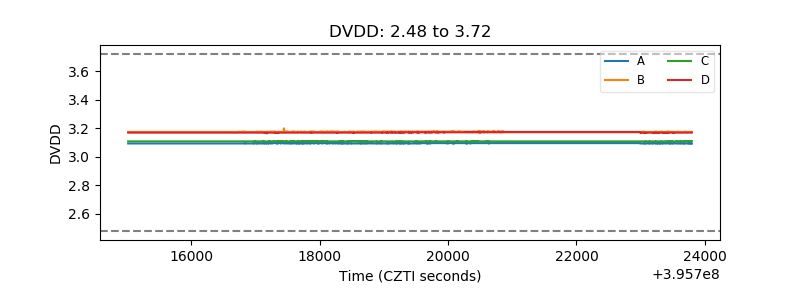 |
| Temperature 1 | 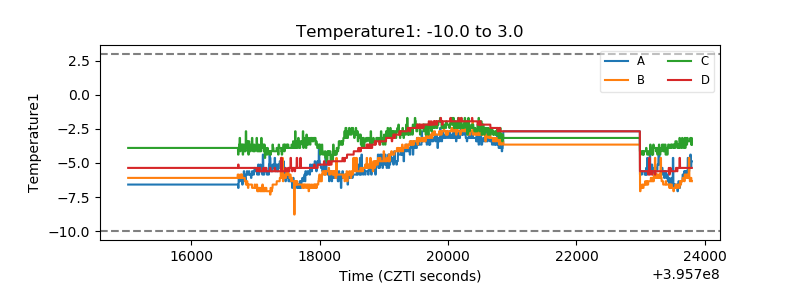 |
| Veto HV Monitor | 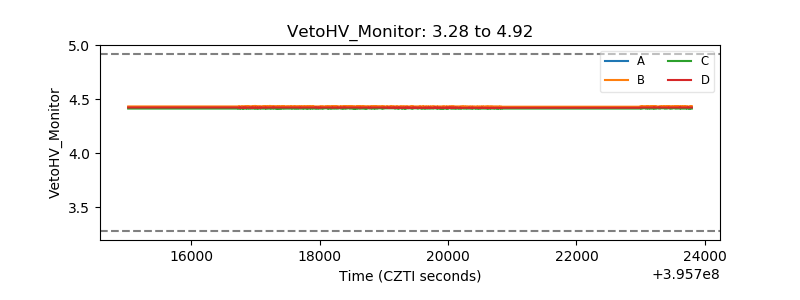 |
| Veto LLD | 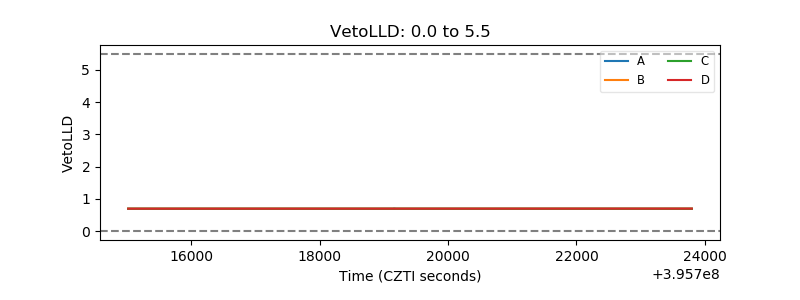 |
| Alpha Counter | 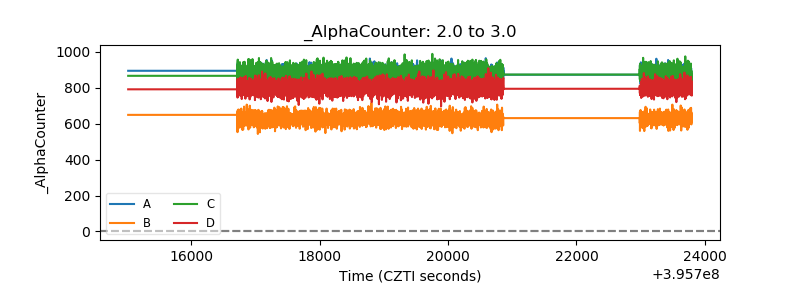 |
| _CPM_Rate | 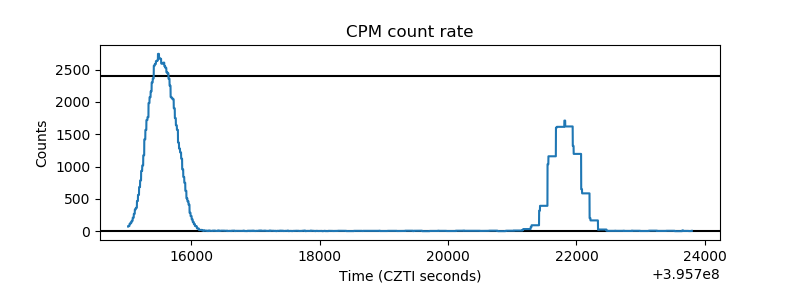 |
| CZT Counter | 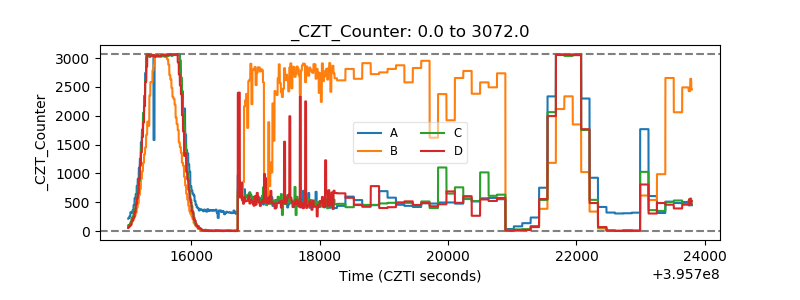 |
| +2.5 Volts monitor |  |
| +5 Volts monitor | 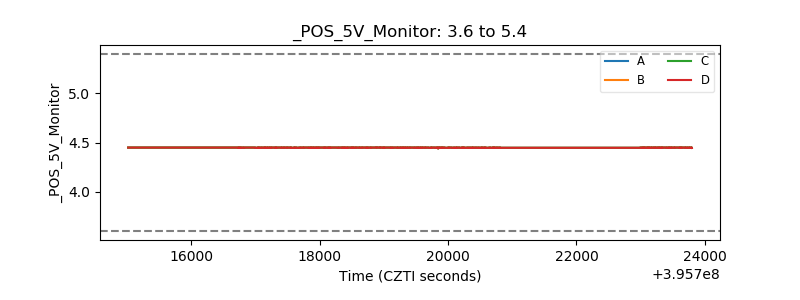 |
| _ROLL_ROT | 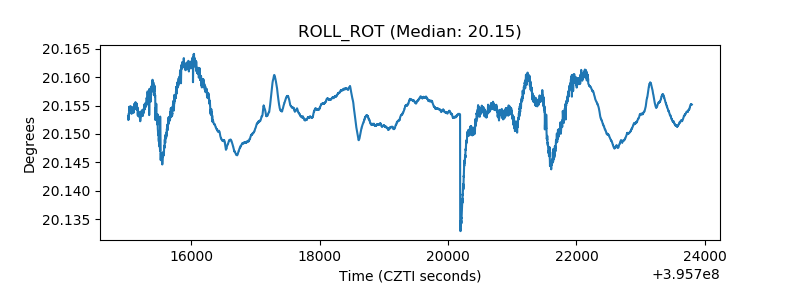 |
| _Roll_DEC | 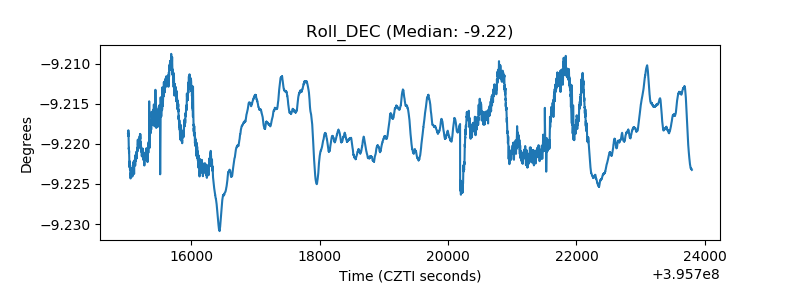 |
| _Roll_RA | 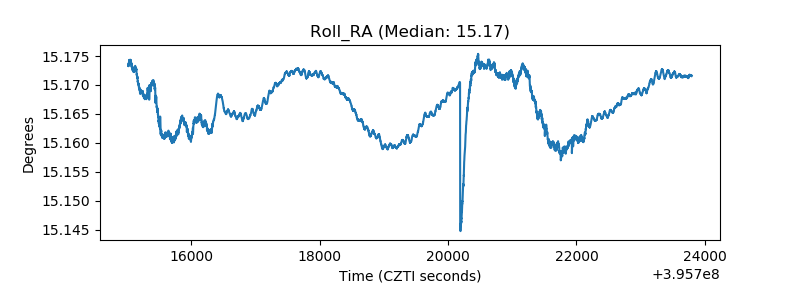 |
| Veto Counter |  |