| Param | Original file | Final file |
|---|---|---|
| Filename | modeM0/AS1A11_087T05_9000005240_36769cztM0_level2.evt | modeM0/AS1A11_087T05_9000005240_36769cztM0_level2_quad_clean.evt |
| Size (bytes) | 1,235,482,560 | 114,615,360 |
| Size | 1.2 GB | 109.3 MB |
| Events in quadrant A | 4,786,502 | 789,302 |
| Events in quadrant B | 21,010,127 | 454,712 |
| Events in quadrant C | 5,430,451 | 807,027 |
| Events in quadrant D | 5,547,544 | 757,618 |
| Mode M0 | |||
|---|---|---|---|
| Quadrant | BADHDUFLAG | Total packets | Discarded packets |
| A | 0 | 19972 | 4 |
| B | 0 | 68871 | 3 |
| C | 0 | 21622 | 3 |
| D | 0 | 22579 | 3 |
| Mode M9 | |||
|---|---|---|---|
| Quadrant | BADHDUFLAG | Total packets | Discarded packets |
| A | 0 | 44 | 0 |
| B | 0 | 44 | 0 |
| C | 0 | 44 | 0 |
| D | 0 | 45 | 0 |
| Mode SS | |||
|---|---|---|---|
| Quadrant | BADHDUFLAG | Total packets | Discarded packets |
| A | 0 | 194 | 0 |
| B | 0 | 194 | 0 |
| C | 0 | 194 | 0 |
| D | 0 | 194 | 0 |
| Quadrant | Total seconds | Saturated seconds | Saturation percentage |
|---|---|---|---|
| A | 9526 | 19 | 0.199454% |
| B | 9526 | 7249 | 76.096998% |
| C | 9526 | 97 | 1.018266% |
| D | 9526 | 197 | 2.068024% |
Noise dominated data is calculated using 1-second bins in cleaned event files. If a bin has >2000 counts, and if more than 50% of those come from <1% of pixels, then it is considered to be noise-dominated and hence unusable.
| Quadrant | # 1 sec bins | Bins with >0 counts | Bins with >2000 counts | High rate bins dominated by noise | Noise dominated (total time) | Noise dominated (detector-on time) | Marked lightcurve |
|---|---|---|---|---|---|---|---|
| A | 13801 | 9528 | 7 | 7 | 0.05% | 0.07% | 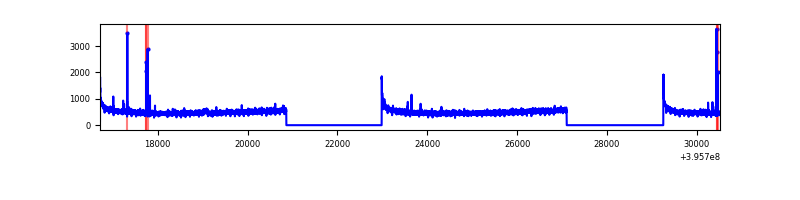 |
| B | 13801 | 9526 | 6960 | 6960 | 50.43% | 73.06% | 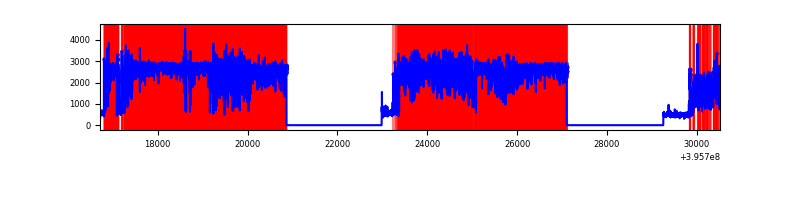 |
| C | 13801 | 9528 | 92 | 92 | 0.67% | 0.97% | 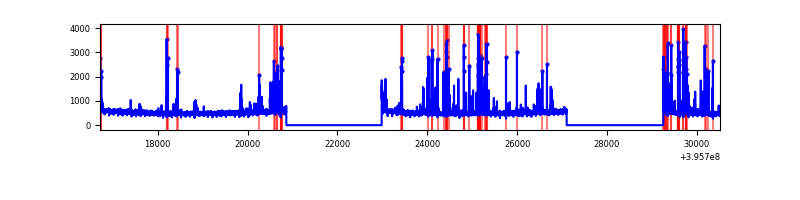 |
| D | 13801 | 9528 | 169 | 169 | 1.22% | 1.77% | 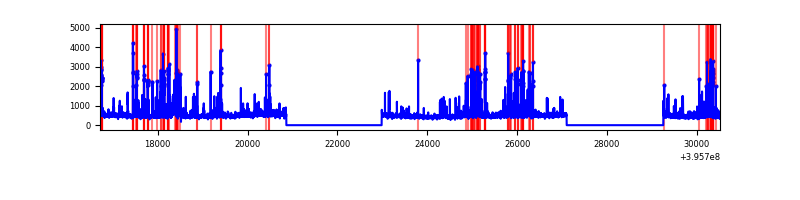 |
Top three noisy pixels from each quadrant. If the there are fewer than three noisy pixels in the level2.evt file, extra rows are filled as -1
| Pixel properties | Quadrant properties | ||||||
|---|---|---|---|---|---|---|---|
| Quadrant | DetID | PixID | Counts | Sigma | Mean | Median | Sigma |
| A | 10 | 83 | 342477 | 1511.64 | 1133 | 1113 | 225.8 |
| A | 9 | 143 | 40024 | 172.31 | 1133 | 1113 | 225.8 |
| A | 13 | 6 | 17293 | 71.65 | 1133 | 1113 | 225.8 |
| B | 12 | 1 | 18388074 | 157954.12 | 614 | 600 | 116.4 |
| B | 0 | 213 | 73321 | 624.7 | 614 | 600 | 116.4 |
| B | 5 | 172 | 39779 | 336.56 | 614 | 600 | 116.4 |
| C | 14 | 254 | 562484 | 2185.52 | 1113 | 1124 | 256.9 |
| C | 15 | 214 | 403851 | 1567.92 | 1113 | 1124 | 256.9 |
| C | 0 | 10 | 74968 | 287.49 | 1113 | 1124 | 256.9 |
| D | 13 | 249 | 403561 | 1507.42 | 1108 | 1081 | 267.0 |
| D | 10 | 118 | 167134 | 621.92 | 1108 | 1081 | 267.0 |
| D | 12 | 6 | 158130 | 588.2 | 1108 | 1081 | 267.0 |
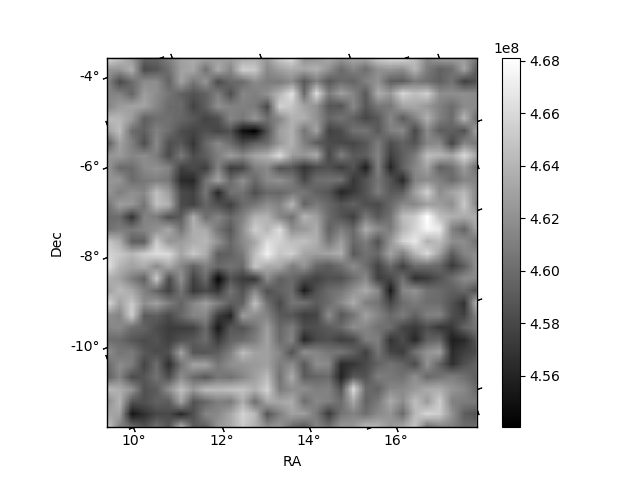
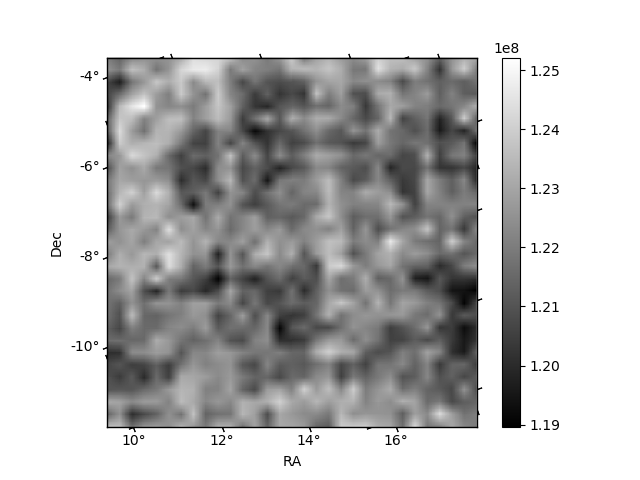
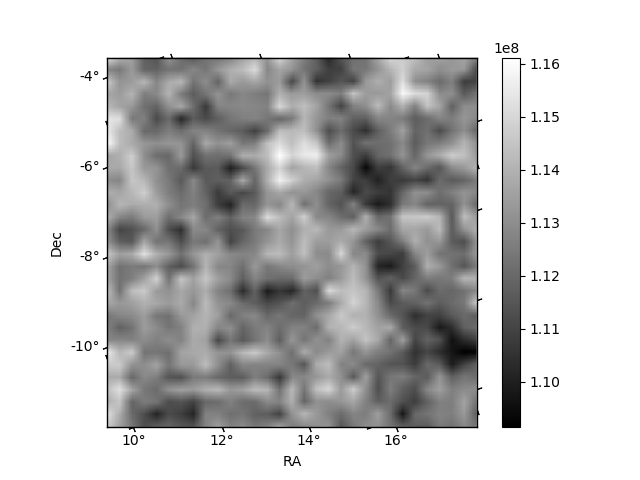
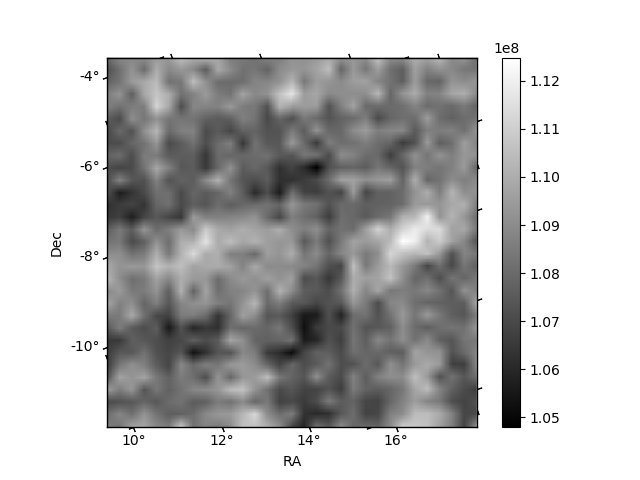
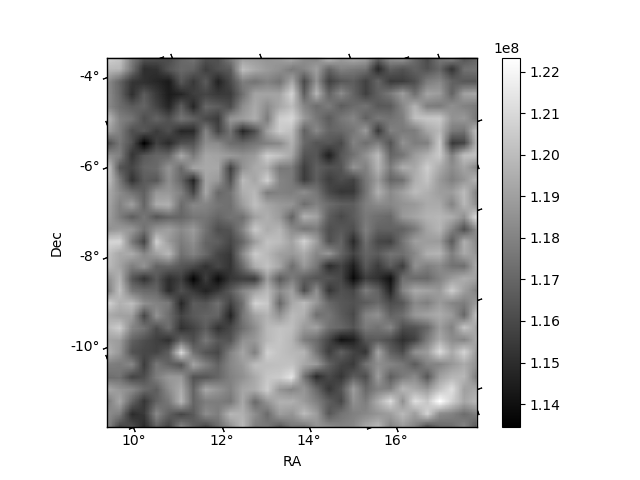
Histogram calculated using DETX and DETY for each event in the final _common_clean file
| Quadrant A | 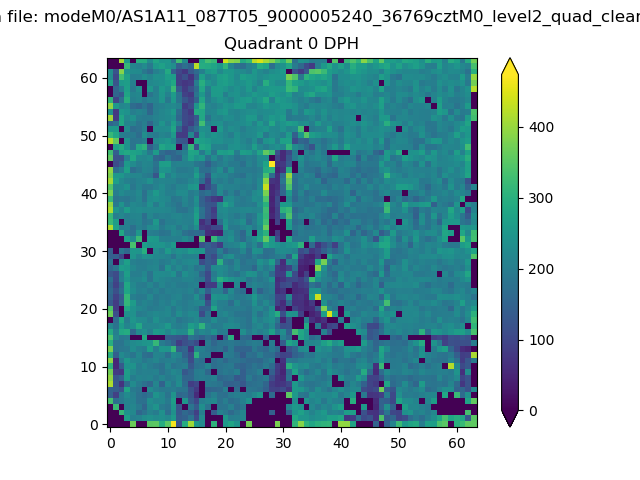 |
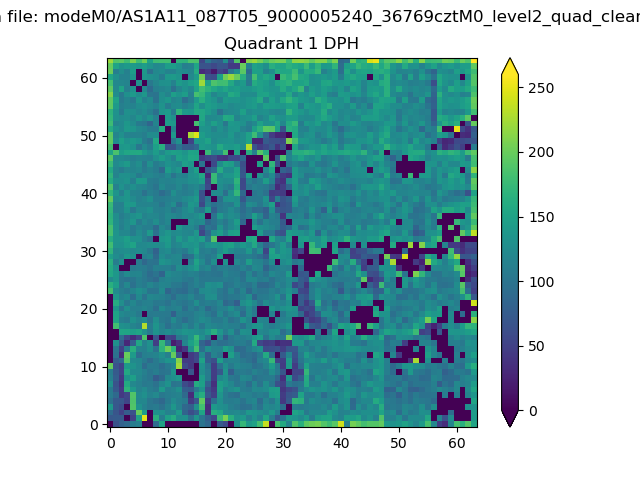 |
Quadrant B |
|---|---|---|---|
| Quadrant D | 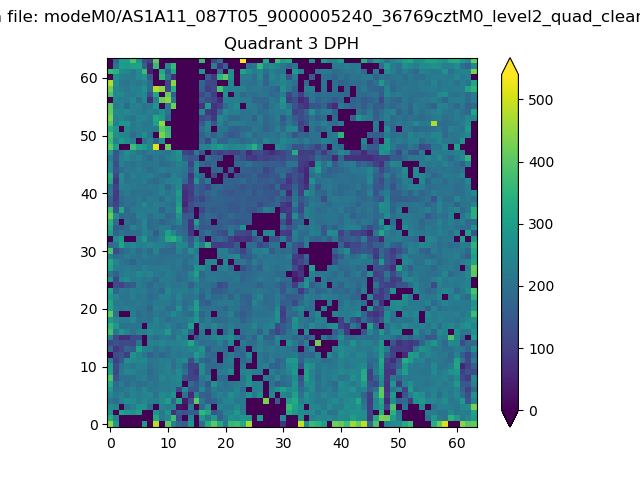 |
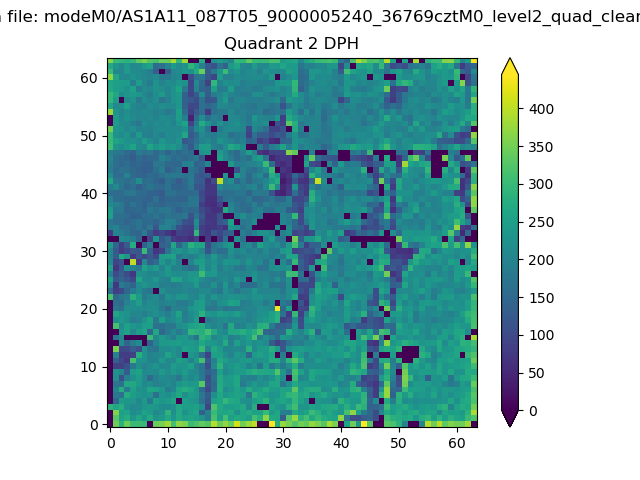 |
Quadrant C |
| Plot type | Count rate plots | Images |
|---|---|---|
| Comparison with Poisson distribution Blue bars denote a histogram of data divided into 1 sec bins. Red curve is a Poisson curve with rate = median count rate of data. |
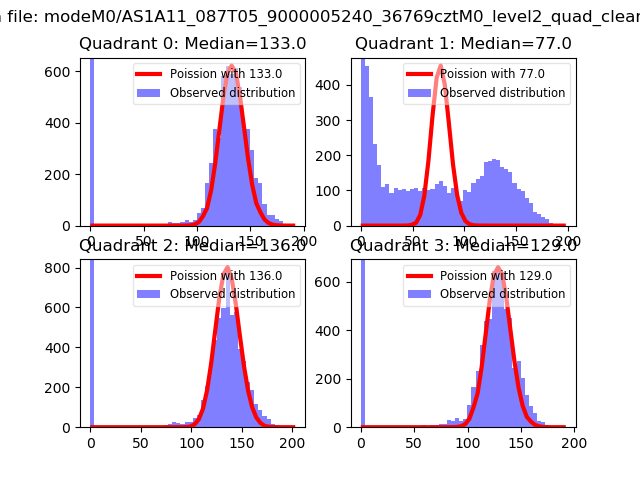 |
 |
| Quadrant-wise count rates Data is divided into 100 sec bins |
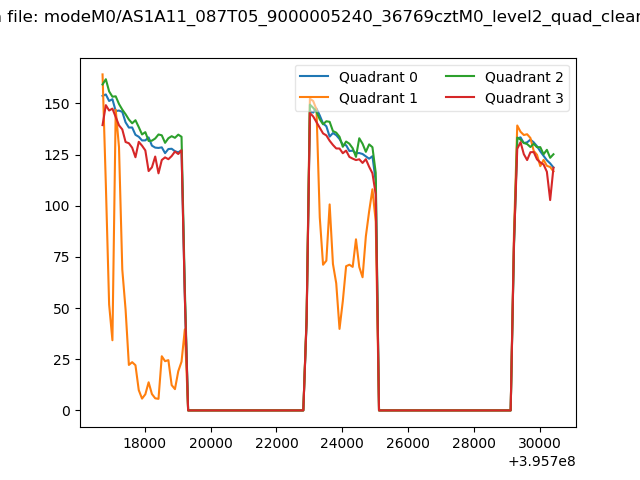 |
|
| Module-wise count rates for Quadrant A Data is divided into 100 sec bins |
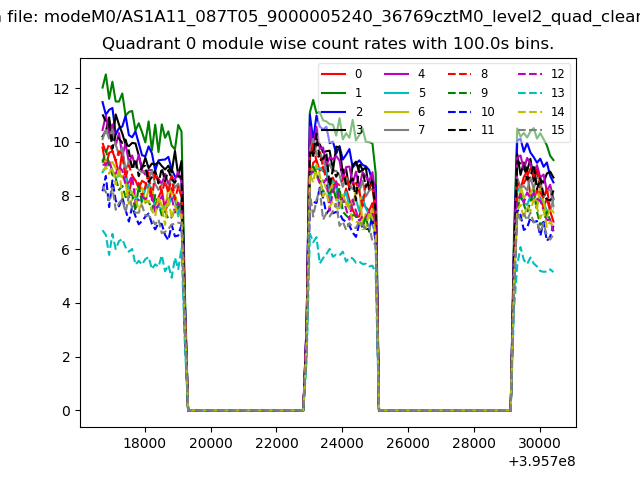 |
 |
| Module-wise count rates for Quadrant B Data is divided into 100 sec bins |
 |
 |
| Module-wise count rates for Quadrant C Data is divided into 100 sec bins |
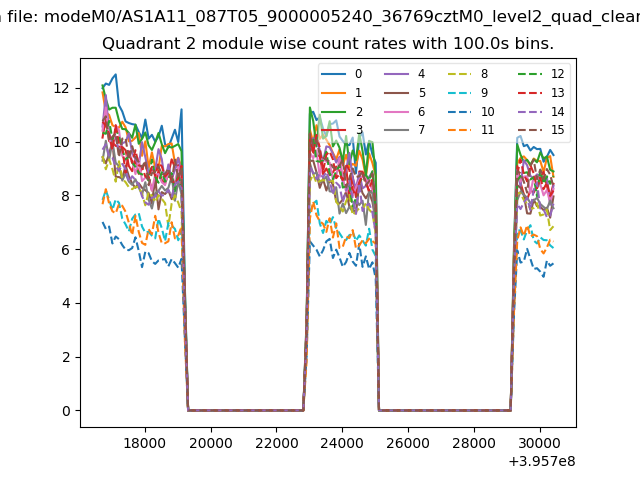 |
 |
| Module-wise count rates for Quadrant D Data is divided into 100 sec bins |
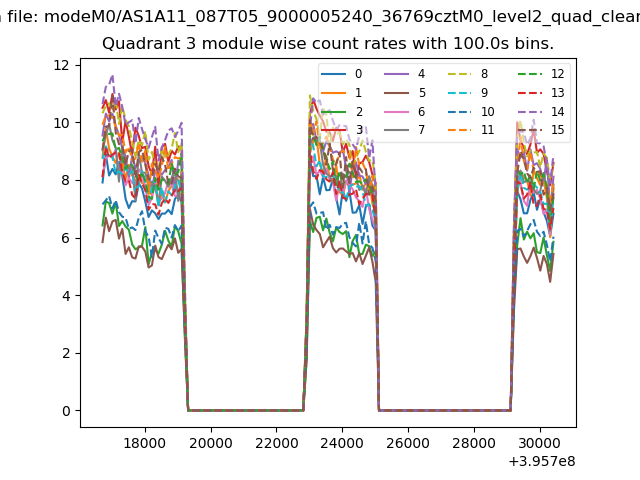 |
 |
| Parameter | Plot |
|---|---|
| CZT HV Monitor | 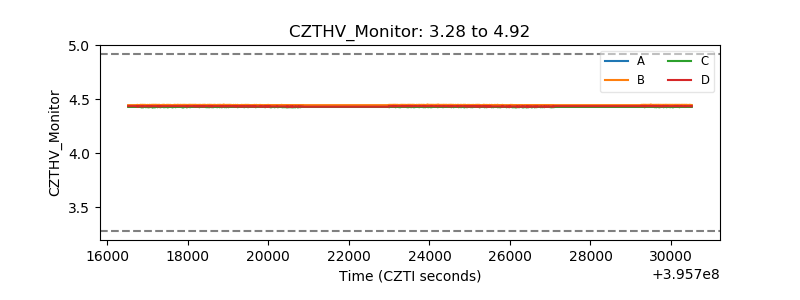 |
| D_VDD | 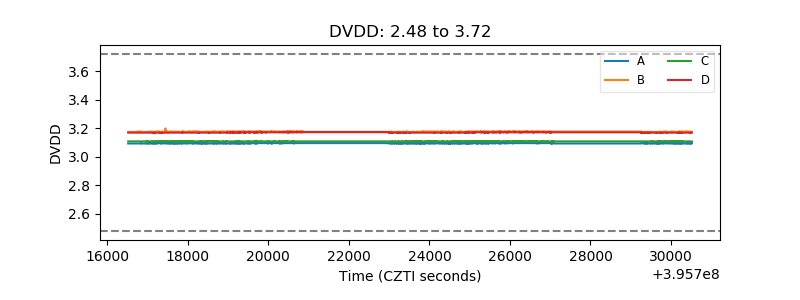 |
| Temperature 1 | 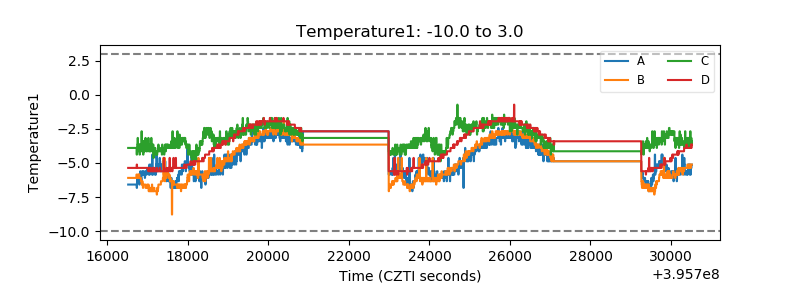 |
| Veto HV Monitor | 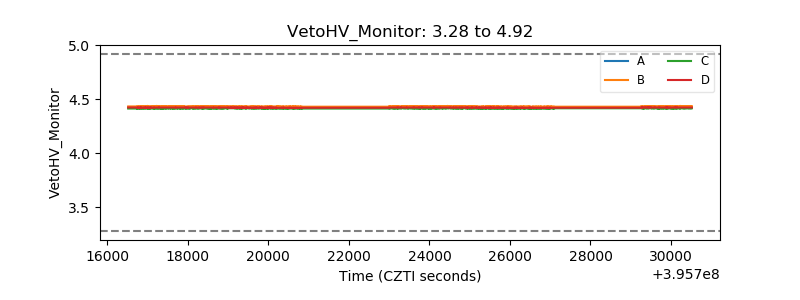 |
| Veto LLD |  |
| Alpha Counter | 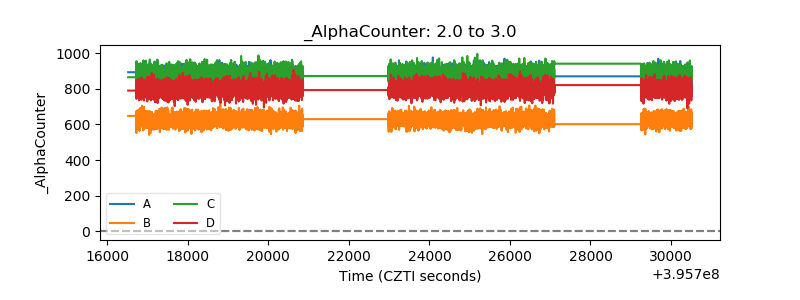 |
| _CPM_Rate | 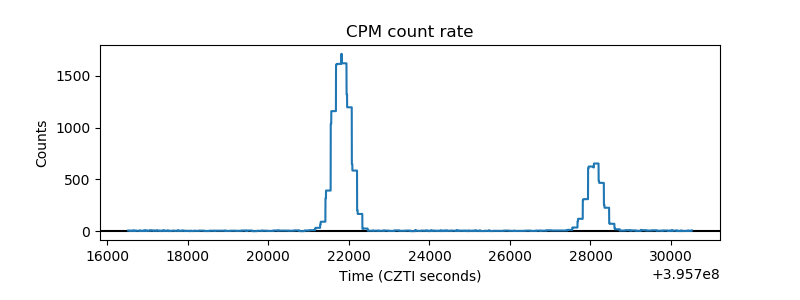 |
| CZT Counter | 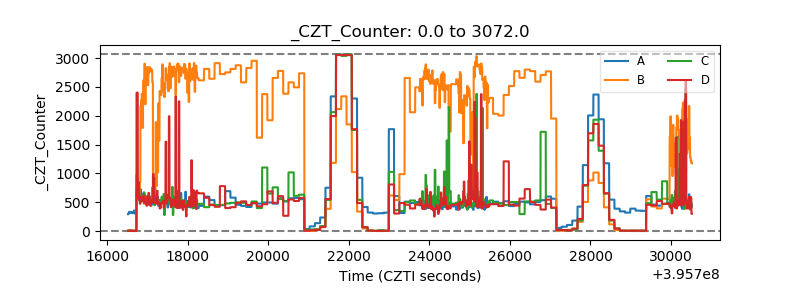 |
| +2.5 Volts monitor |  |
| +5 Volts monitor |  |
| _ROLL_ROT |  |
| _Roll_DEC | 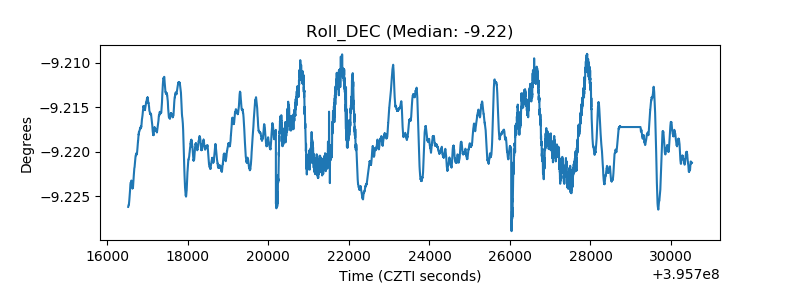 |
| _Roll_RA | 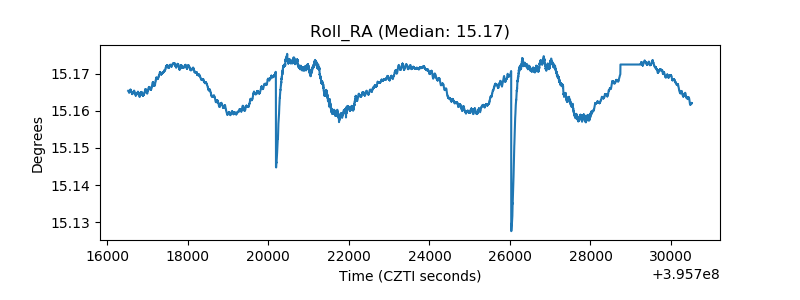 |
| Veto Counter | 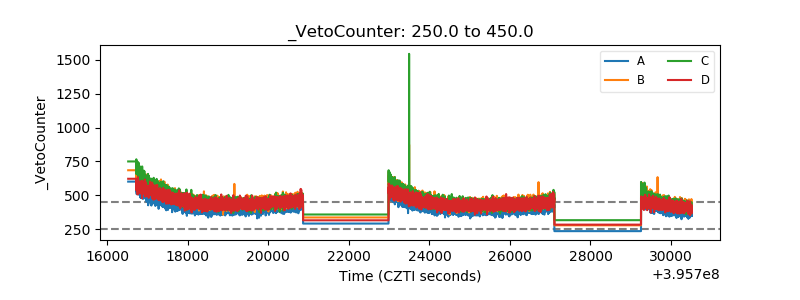 |