| Param | Original file | Final file |
|---|---|---|
| Filename | modeM0/AS1A11_087T05_9000005240_36771cztM0_level2.evt | modeM0/AS1A11_087T05_9000005240_36771cztM0_level2_quad_clean.evt |
| Size (bytes) | 665,447,040 | 61,323,840 |
| Size | 634.6 MB | 58.5 MB |
| Events in quadrant A | 2,738,600 | 382,602 |
| Events in quadrant B | 8,221,019 | 353,156 |
| Events in quadrant C | 3,090,873 | 384,217 |
| Events in quadrant D | 5,722,313 | 343,198 |
| Mode M0 | |||
|---|---|---|---|
| Quadrant | BADHDUFLAG | Total packets | Discarded packets |
| A | 0 | 11572 | 3 |
| B | 0 | 28233 | 2 |
| C | 0 | 12507 | 2 |
| D | 0 | 20831 | 2 |
| Mode M9 | |||
|---|---|---|---|
| Quadrant | BADHDUFLAG | Total packets | Discarded packets |
| A | 0 | 22 | 0 |
| B | 0 | 22 | 0 |
| C | 0 | 22 | 0 |
| D | 0 | 23 | 0 |
| Mode SS | |||
|---|---|---|---|
| Quadrant | BADHDUFLAG | Total packets | Discarded packets |
| A | 0 | 114 | 0 |
| B | 0 | 114 | 0 |
| C | 0 | 114 | 0 |
| D | 0 | 114 | 0 |
| Quadrant | Total seconds | Saturated seconds | Saturation percentage |
|---|---|---|---|
| A | 5621 | 4 | 0.071162% |
| B | 5621 | 2424 | 43.123999% |
| C | 5621 | 50 | 0.889521% |
| D | 5621 | 1116 | 19.854118% |
Noise dominated data is calculated using 1-second bins in cleaned event files. If a bin has >2000 counts, and if more than 50% of those come from <1% of pixels, then it is considered to be noise-dominated and hence unusable.
| Quadrant | # 1 sec bins | Bins with >0 counts | Bins with >2000 counts | High rate bins dominated by noise | Noise dominated (total time) | Noise dominated (detector-on time) | Marked lightcurve |
|---|---|---|---|---|---|---|---|
| A | 7353 | 5622 | 0 | 0 | 0.00% | 0.00% | 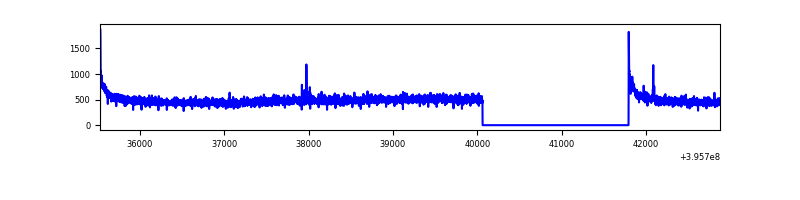 |
| B | 7353 | 5622 | 2243 | 2243 | 30.50% | 39.90% | 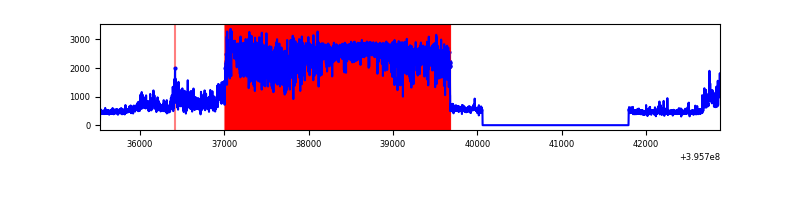 |
| C | 7353 | 5622 | 41 | 41 | 0.56% | 0.73% | 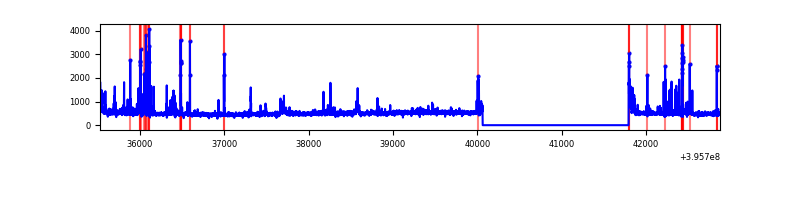 |
| D | 7353 | 5622 | 1065 | 1065 | 14.48% | 18.94% | 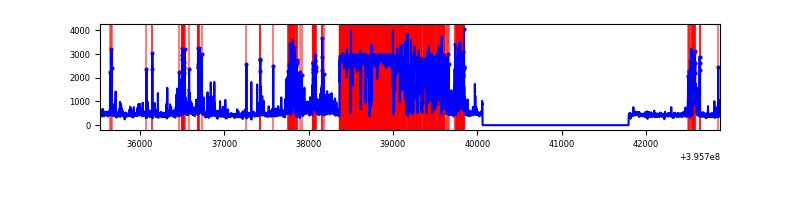 |
Top three noisy pixels from each quadrant. If the there are fewer than three noisy pixels in the level2.evt file, extra rows are filled as -1
| Pixel properties | Quadrant properties | ||||||
|---|---|---|---|---|---|---|---|
| Quadrant | DetID | PixID | Counts | Sigma | Mean | Median | Sigma |
| A | 10 | 83 | 217865 | 1657.98 | 647 | 633 | 131.0 |
| A | 13 | 6 | 8678 | 61.4 | 647 | 633 | 131.0 |
| A | 13 | 254 | 8437 | 59.56 | 647 | 633 | 131.0 |
| B | 12 | 1 | 6128679 | 61176.5 | 509 | 497 | 100.2 |
| B | 0 | 189 | 24450 | 239.12 | 509 | 497 | 100.2 |
| B | 0 | 213 | 21416 | 208.83 | 509 | 497 | 100.2 |
| C | 15 | 214 | 241674 | 1631.3 | 628 | 632 | 147.8 |
| C | 14 | 254 | 236839 | 1598.58 | 628 | 632 | 147.8 |
| C | 0 | 207 | 88768 | 596.48 | 628 | 632 | 147.8 |
| D | 12 | 227 | 2707125 | 19929.46 | 555 | 541 | 135.8 |
| D | 13 | 249 | 330586 | 2430.23 | 555 | 541 | 135.8 |
| D | 12 | 6 | 246881 | 1813.88 | 555 | 541 | 135.8 |
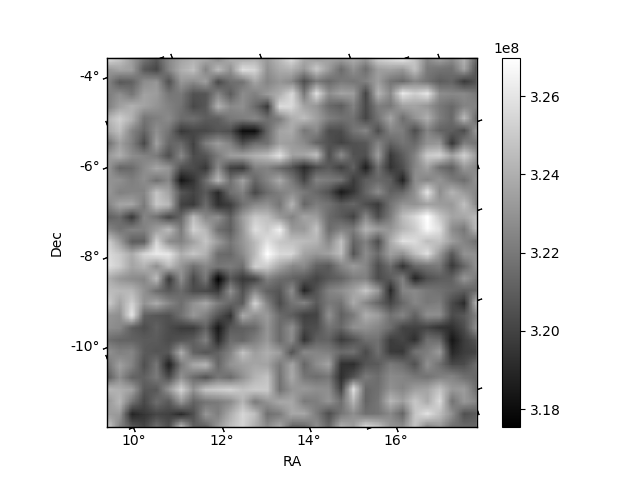
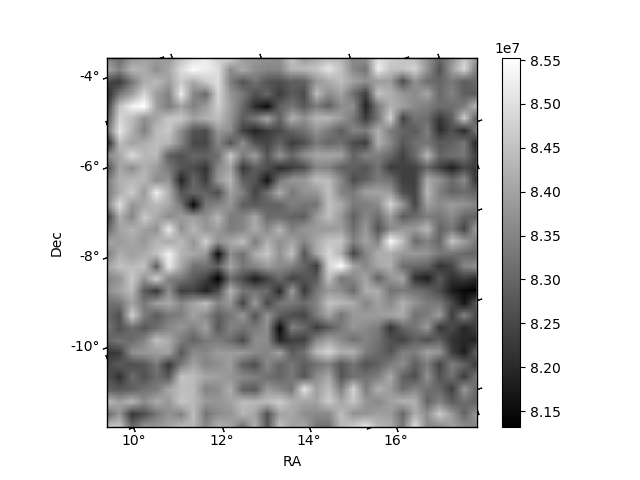
Histogram calculated using DETX and DETY for each event in the final _common_clean file
| Quadrant A | 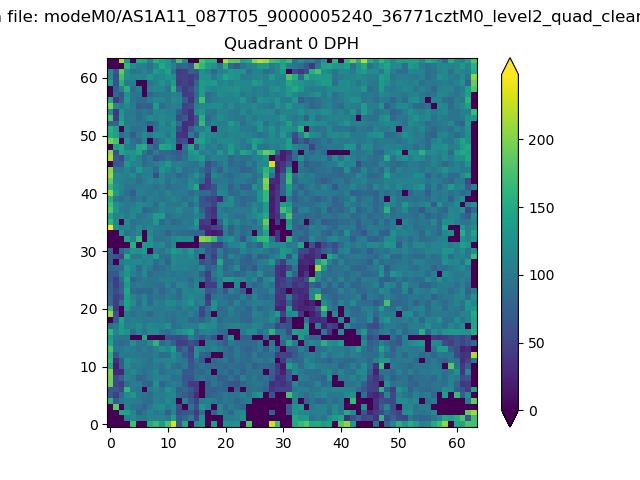 |
 |
Quadrant B |
|---|---|---|---|
| Quadrant D | 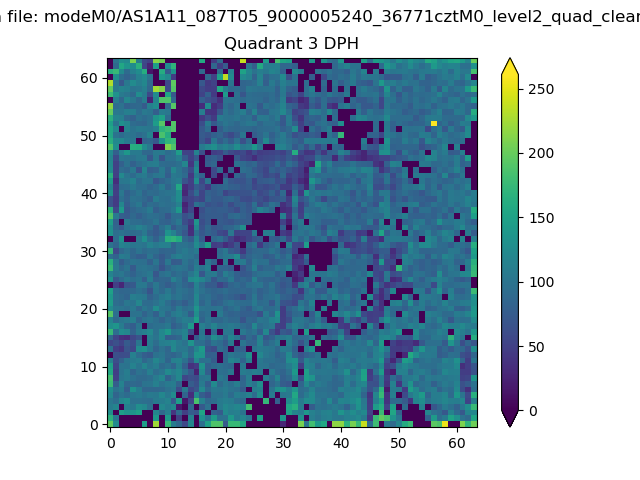 |
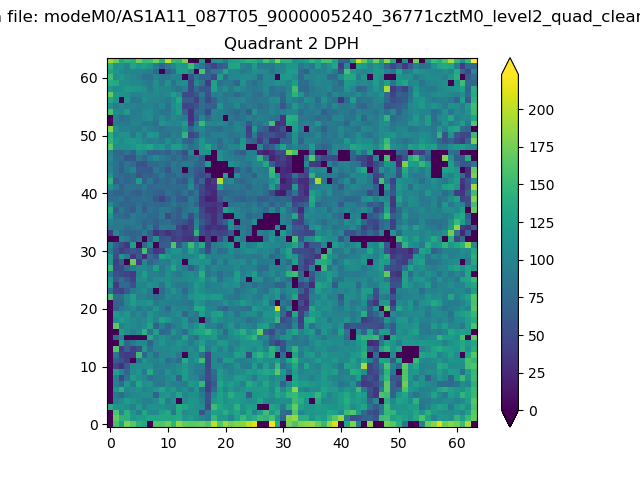 |
Quadrant C |
| Plot type | Count rate plots | Images |
|---|---|---|
| Comparison with Poisson distribution Blue bars denote a histogram of data divided into 1 sec bins. Red curve is a Poisson curve with rate = median count rate of data. |
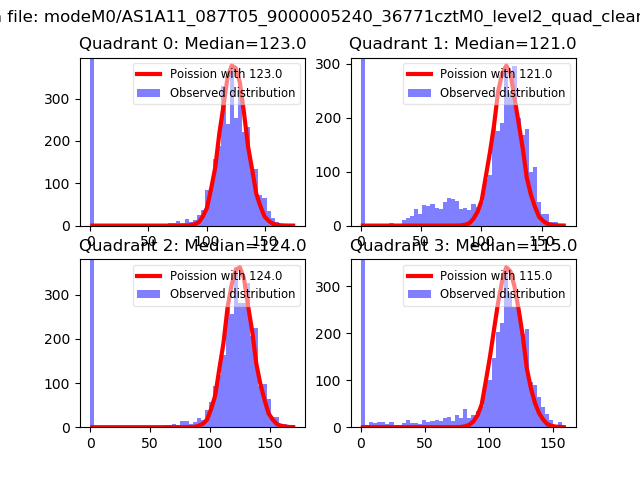 |
 |
| Quadrant-wise count rates Data is divided into 100 sec bins |
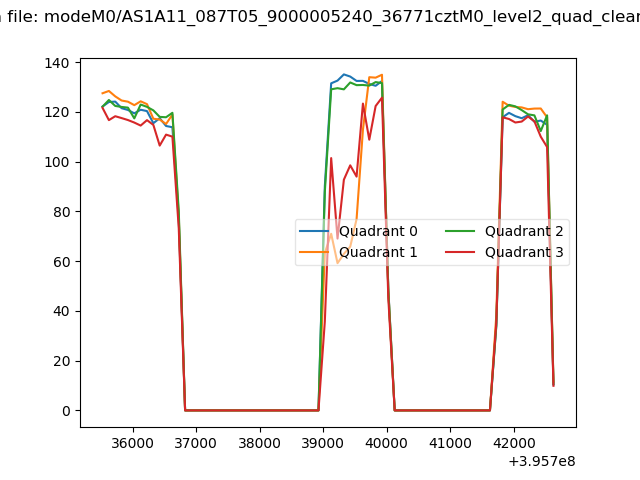 |
|
| Module-wise count rates for Quadrant A Data is divided into 100 sec bins |
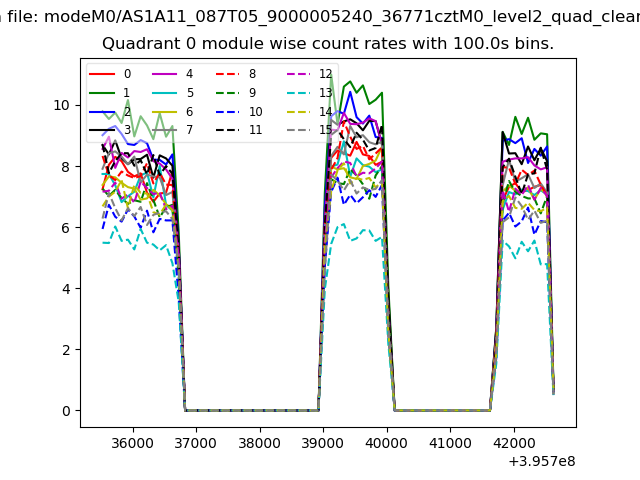 |
 |
| Module-wise count rates for Quadrant B Data is divided into 100 sec bins |
 |
 |
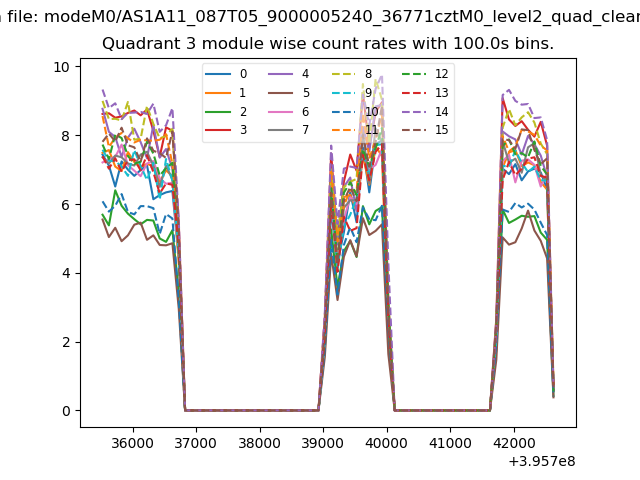
| Module-wise count rates for Quadrant C Data is divided into 100 sec bins |
 |
 |
| Module-wise count rates for Quadrant D Data is divided into 100 sec bins |
 |
 |
| Parameter | Plot |
|---|---|
| CZT HV Monitor |  |
| D_VDD | 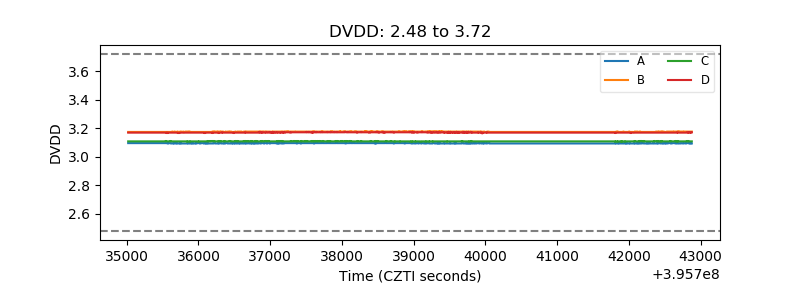 |
| Temperature 1 | 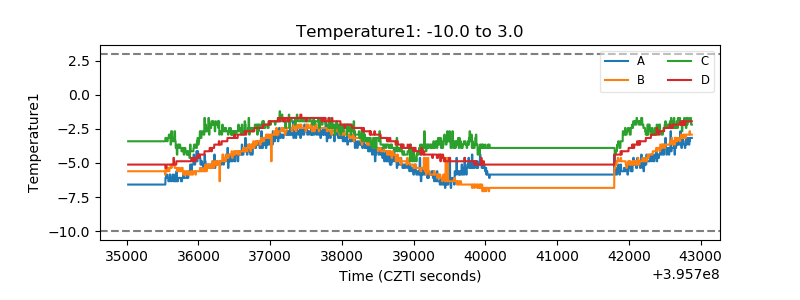 |
| Veto HV Monitor | 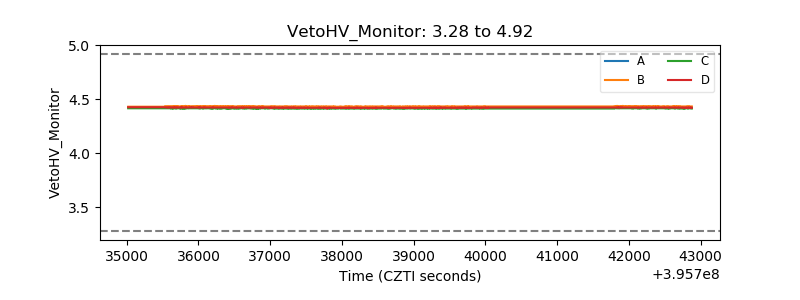 |
| Veto LLD | 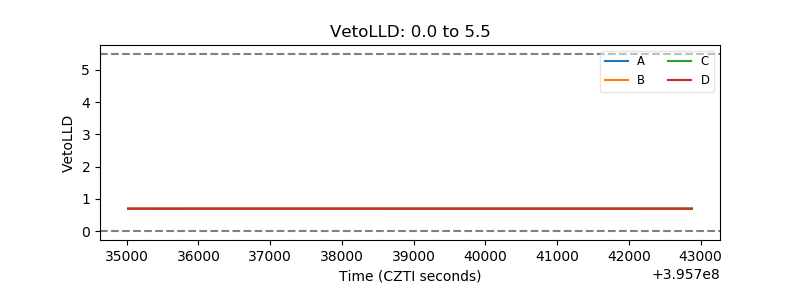 |
| Alpha Counter |  |
| _CPM_Rate | 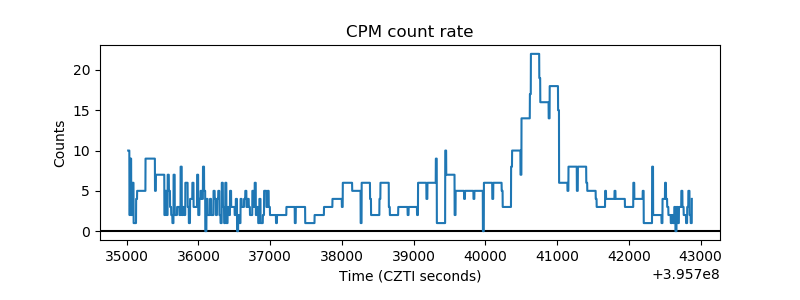 |
| CZT Counter | 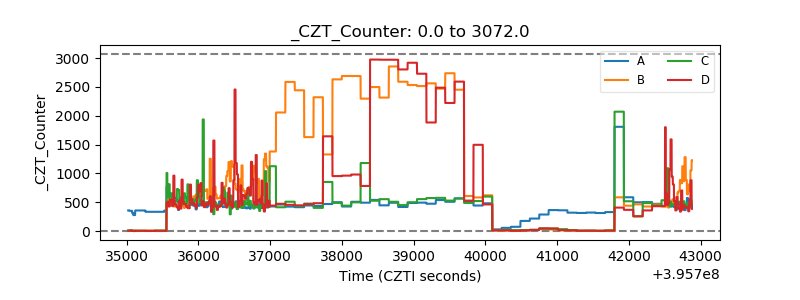 |
| +2.5 Volts monitor |  |
| +5 Volts monitor | 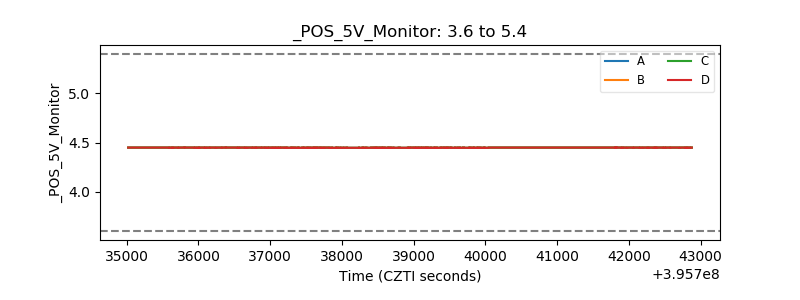 |
| _ROLL_ROT | 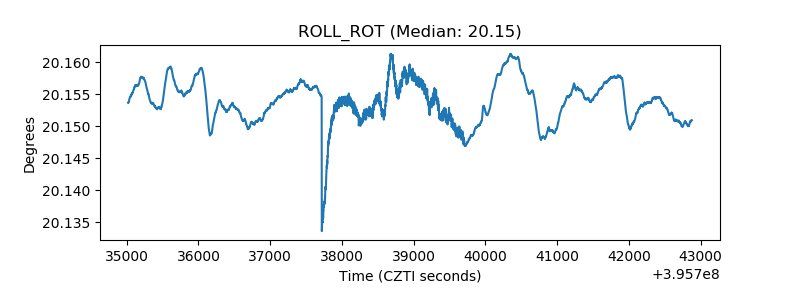 |
| _Roll_DEC | 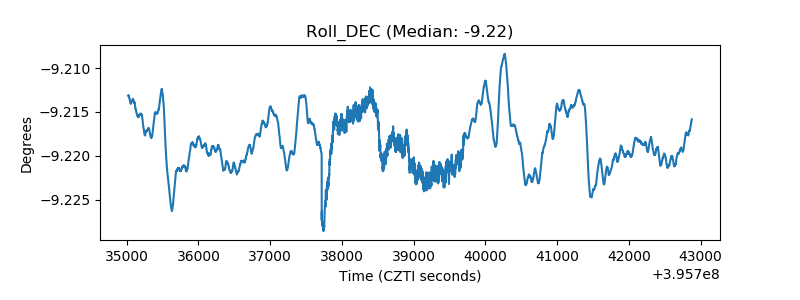 |
| _Roll_RA | 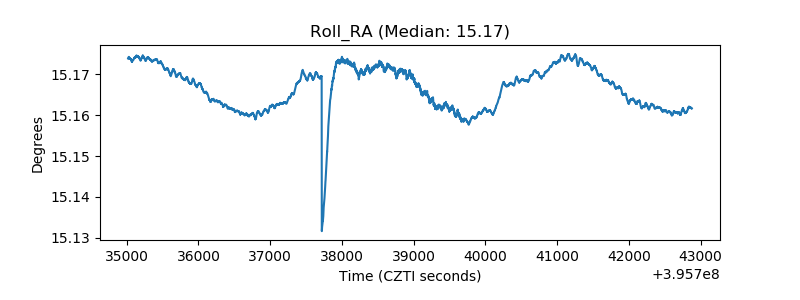 |
| Veto Counter | 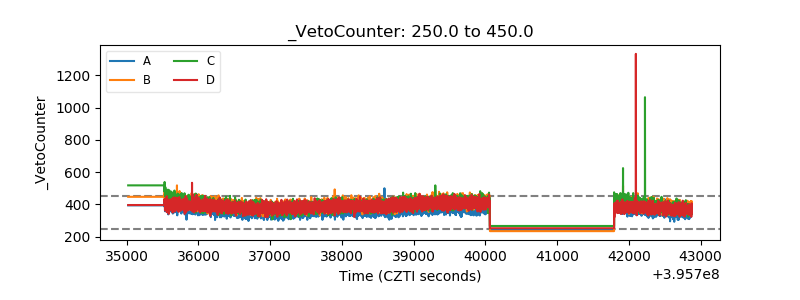 |