| Param | Original file | Final file |
|---|---|---|
| Filename | modeM0/AS1A11_087T05_9000005240_36772cztM0_level2.evt | modeM0/AS1A11_087T05_9000005240_36772cztM0_level2_quad_clean.evt |
| Size (bytes) | 1,648,630,080 | 125,985,600 |
| Size | 1.5 GB | 120.1 MB |
| Events in quadrant A | 6,583,008 | 764,334 |
| Events in quadrant B | 23,775,026 | 656,250 |
| Events in quadrant C | 7,375,091 | 763,956 |
| Events in quadrant D | 11,283,433 | 693,148 |
| Mode M0 | |||
|---|---|---|---|
| Quadrant | BADHDUFLAG | Total packets | Discarded packets |
| A | 0 | 27816 | 4 |
| B | 0 | 79844 | 3 |
| C | 0 | 29907 | 3 |
| D | 0 | 42698 | 3 |
| Mode M9 | |||
|---|---|---|---|
| Quadrant | BADHDUFLAG | Total packets | Discarded packets |
| A | 0 | 52 | 0 |
| B | 0 | 52 | 0 |
| C | 0 | 52 | 0 |
| D | 0 | 52 | 0 |
| Mode SS | |||
|---|---|---|---|
| Quadrant | BADHDUFLAG | Total packets | Discarded packets |
| A | 0 | 276 | 0 |
| B | 0 | 276 | 0 |
| C | 0 | 276 | 0 |
| D | 0 | 276 | 0 |
| Quadrant | Total seconds | Saturated seconds | Saturation percentage |
|---|---|---|---|
| A | 13557 | 17 | 0.125396% |
| B | 13557 | 7544 | 55.646529% |
| C | 13557 | 116 | 0.855647% |
| D | 13557 | 1629 | 12.015933% |
Noise dominated data is calculated using 1-second bins in cleaned event files. If a bin has >2000 counts, and if more than 50% of those come from <1% of pixels, then it is considered to be noise-dominated and hence unusable.
| Quadrant | # 1 sec bins | Bins with >0 counts | Bins with >2000 counts | High rate bins dominated by noise | Noise dominated (total time) | Noise dominated (detector-on time) | Marked lightcurve |
|---|---|---|---|---|---|---|---|
| A | 18755 | 13560 | 8 | 8 | 0.04% | 0.06% | 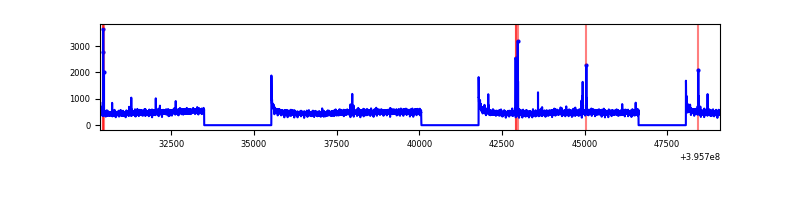 |
| B | 18754 | 13558 | 6877 | 6877 | 36.67% | 50.72% | 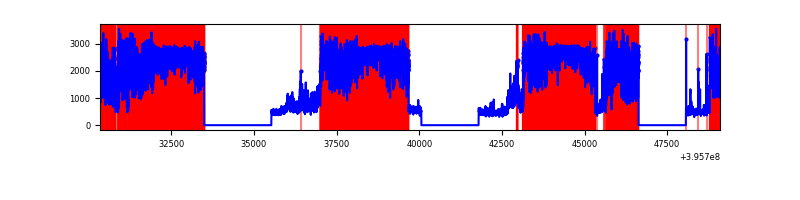 |
| C | 18755 | 13560 | 98 | 98 | 0.52% | 0.72% | 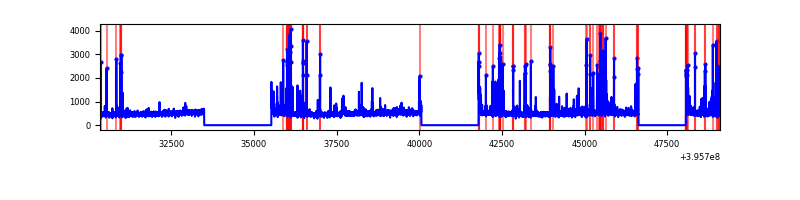 |
| D | 18755 | 13560 | 1531 | 1531 | 8.16% | 11.29% | 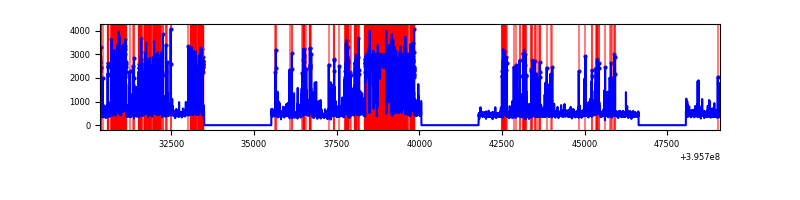 |
Top three noisy pixels from each quadrant. If the there are fewer than three noisy pixels in the level2.evt file, extra rows are filled as -1
| Pixel properties | Quadrant properties | ||||||
|---|---|---|---|---|---|---|---|
| Quadrant | DetID | PixID | Counts | Sigma | Mean | Median | Sigma |
| A | 10 | 83 | 424813 | 1342.52 | 1570 | 1539 | 315.3 |
| A | 9 | 143 | 60903 | 188.29 | 1570 | 1539 | 315.3 |
| A | 13 | 6 | 22442 | 66.3 | 1570 | 1539 | 315.3 |
| B | 12 | 1 | 18751621 | 85689.13 | 1145 | 1115 | 218.8 |
| B | 15 | 85 | 223247 | 1015.13 | 1145 | 1115 | 218.8 |
| B | 0 | 213 | 62582 | 280.9 | 1145 | 1115 | 218.8 |
| C | 15 | 214 | 571865 | 1607.44 | 1524 | 1536 | 354.8 |
| C | 14 | 254 | 393149 | 1103.74 | 1524 | 1536 | 354.8 |
| C | 0 | 207 | 347369 | 974.71 | 1524 | 1536 | 354.8 |
| D | 12 | 227 | 2721762 | 7738.06 | 1436 | 1397 | 351.6 |
| D | 12 | 6 | 1178009 | 3346.86 | 1436 | 1397 | 351.6 |
| D | 13 | 249 | 633119 | 1796.93 | 1436 | 1397 | 351.6 |
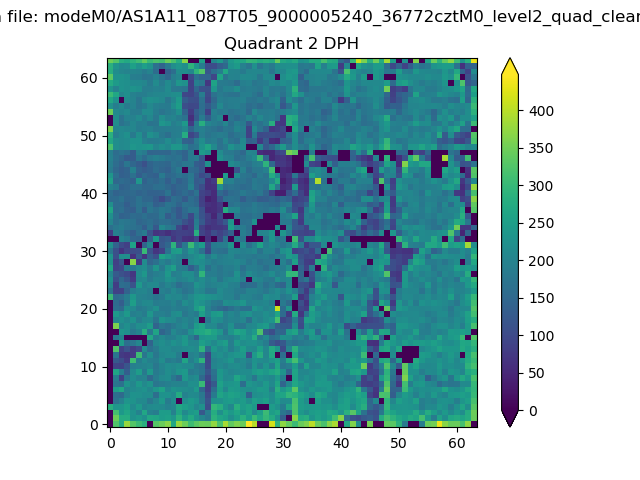
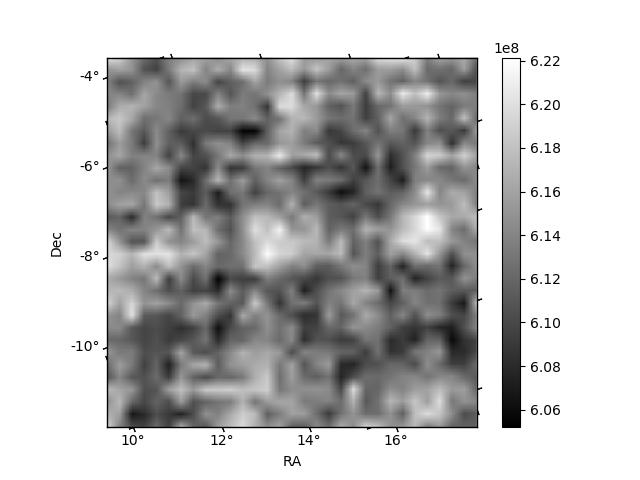
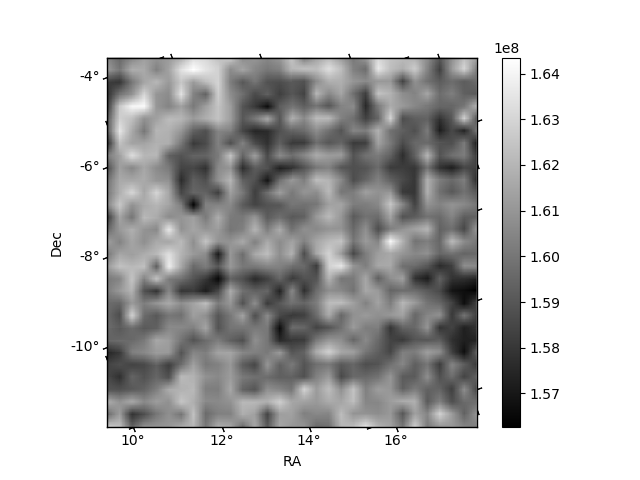
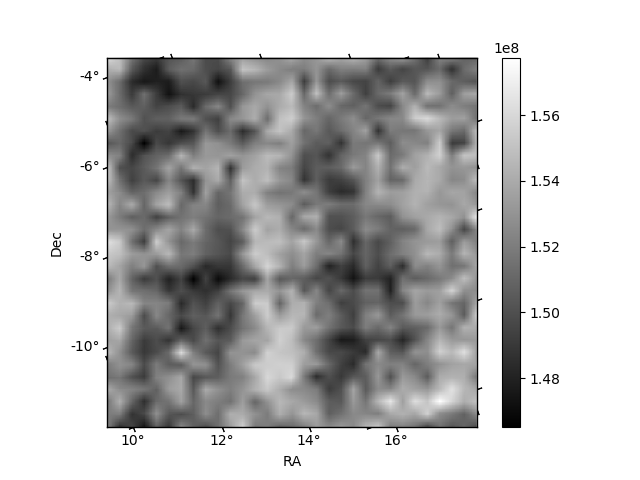
Histogram calculated using DETX and DETY for each event in the final _common_clean file
| Quadrant A | 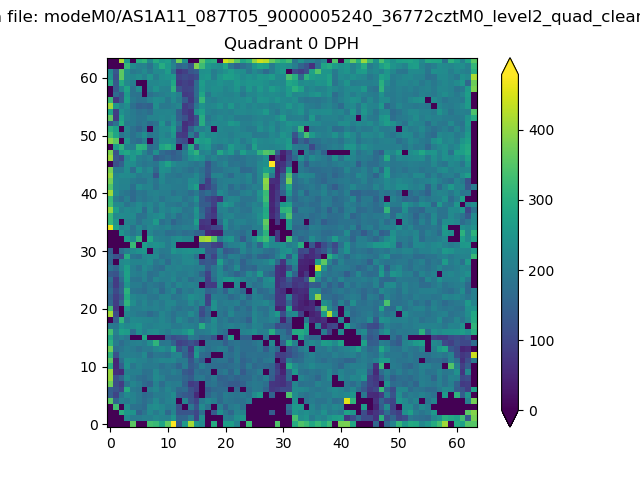 |
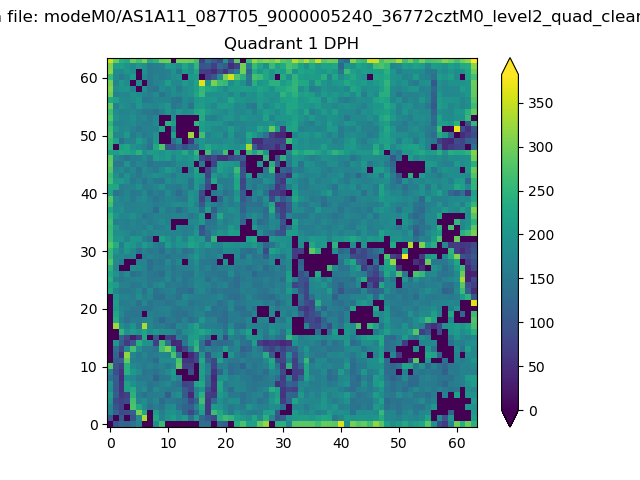 |
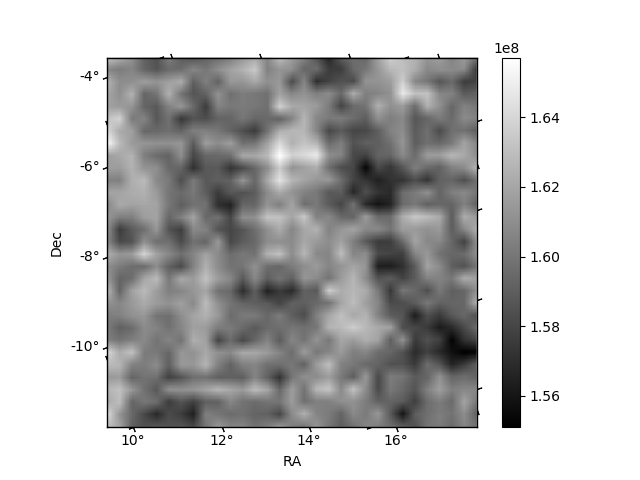
Quadrant B |
|---|---|---|---|
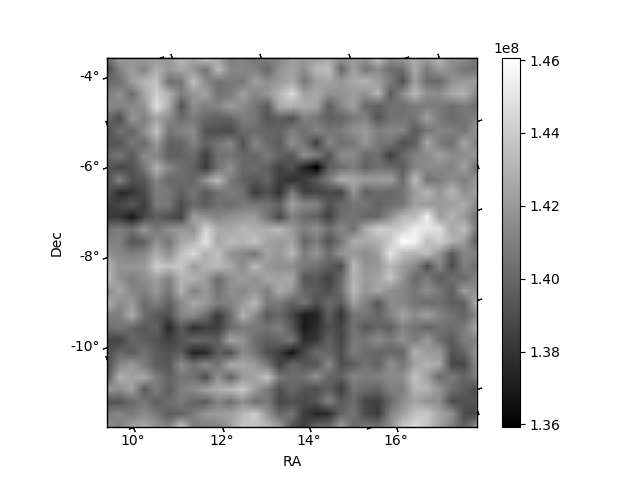
| Quadrant D | 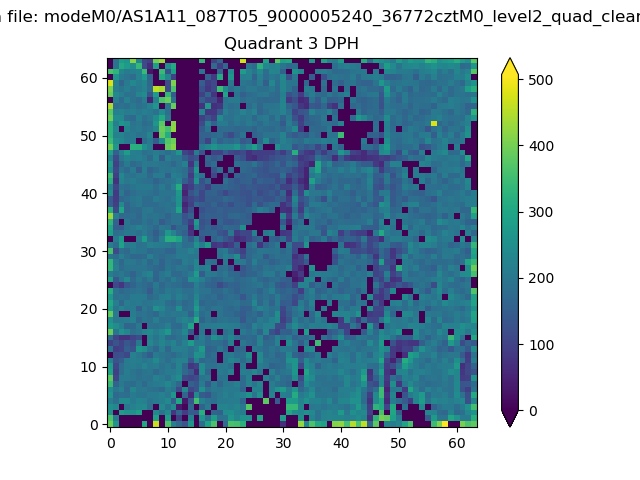 |
 |
Quadrant C |
| Plot type | Count rate plots | Images |
|---|---|---|
| Comparison with Poisson distribution Blue bars denote a histogram of data divided into 1 sec bins. Red curve is a Poisson curve with rate = median count rate of data. |
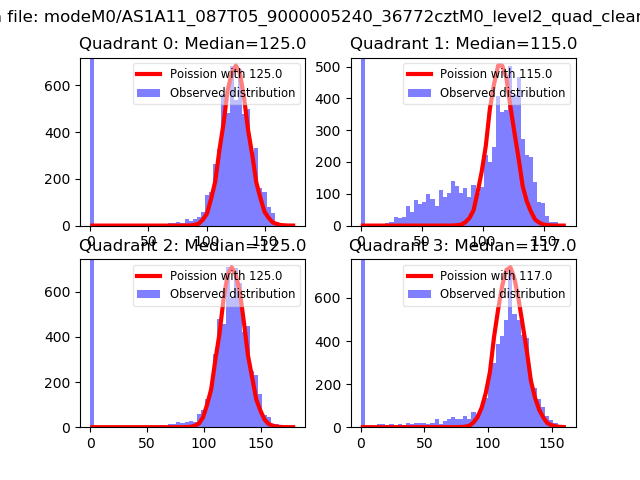 |
 |
| Quadrant-wise count rates Data is divided into 100 sec bins |
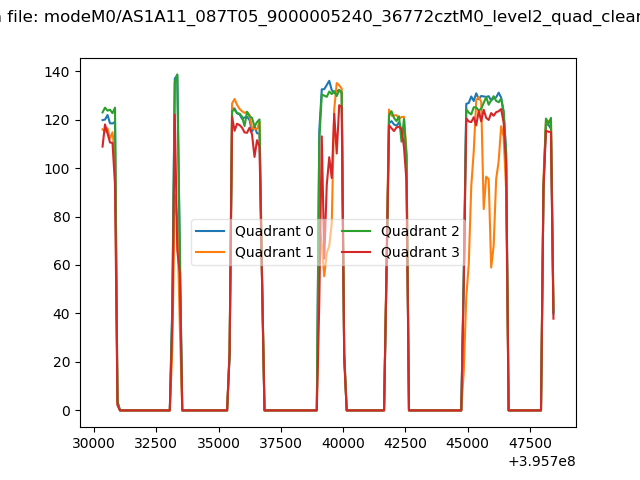 |
|
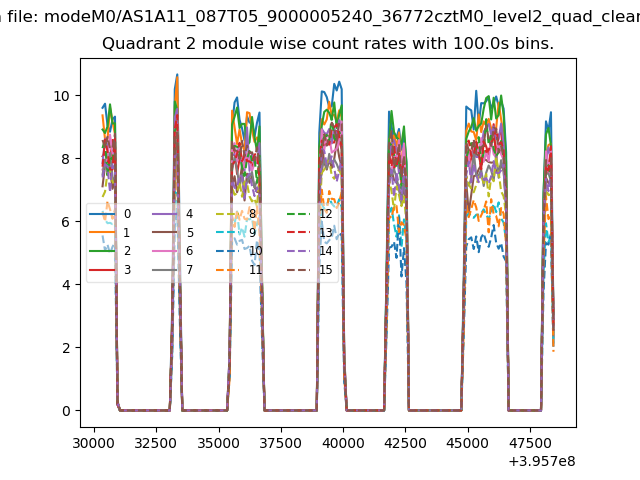
| Module-wise count rates for Quadrant A Data is divided into 100 sec bins |
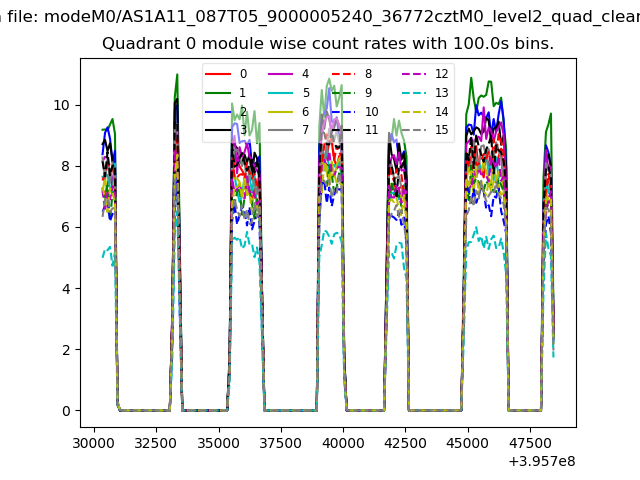 |
 |
| Module-wise count rates for Quadrant B Data is divided into 100 sec bins |
 |
 |
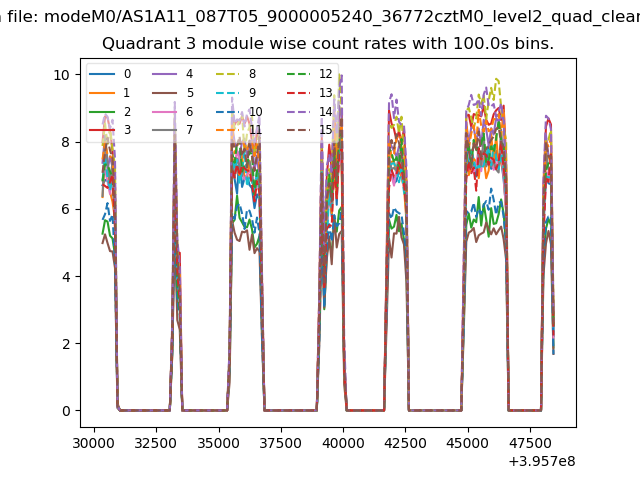
| Module-wise count rates for Quadrant C Data is divided into 100 sec bins |
 |
 |
| Module-wise count rates for Quadrant D Data is divided into 100 sec bins |
 |
 |
| Parameter | Plot |
|---|---|
| CZT HV Monitor | 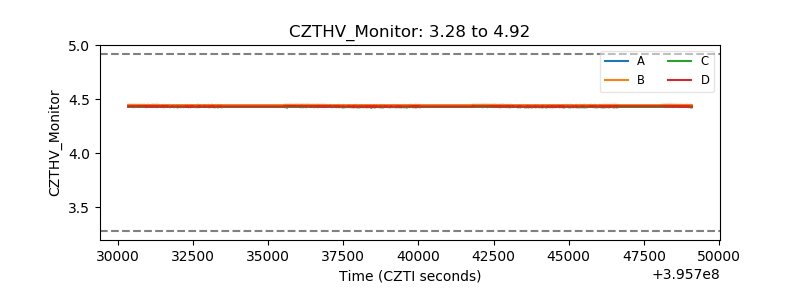 |
| D_VDD | 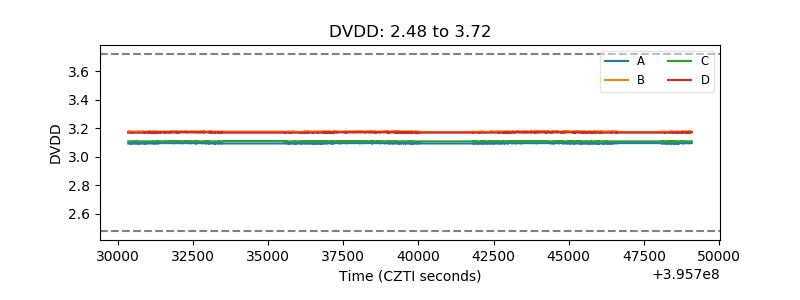 |
| Temperature 1 | 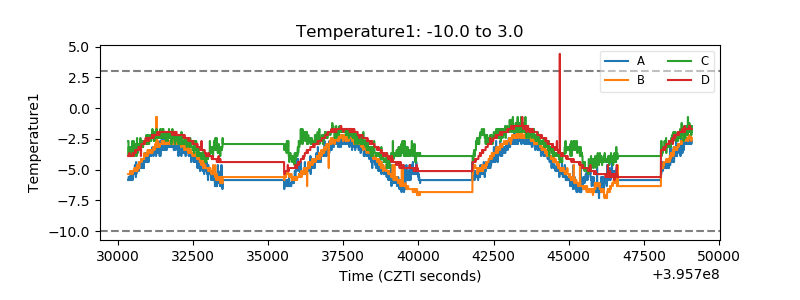 |
| Veto HV Monitor | 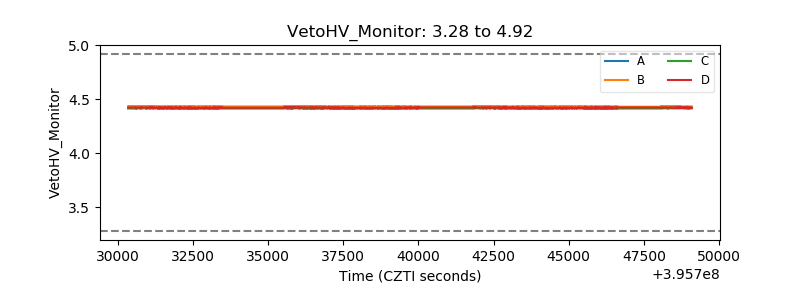 |
| Veto LLD |  |
| Alpha Counter | 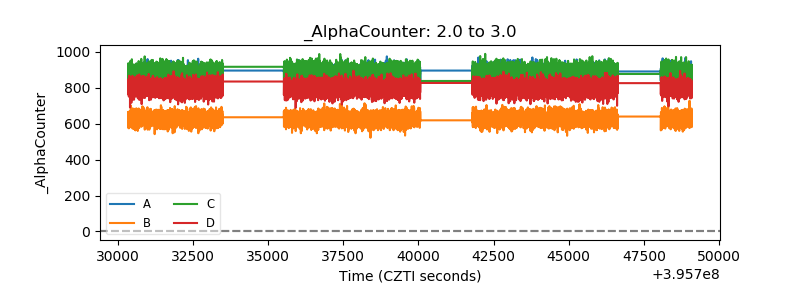 |
| _CPM_Rate | 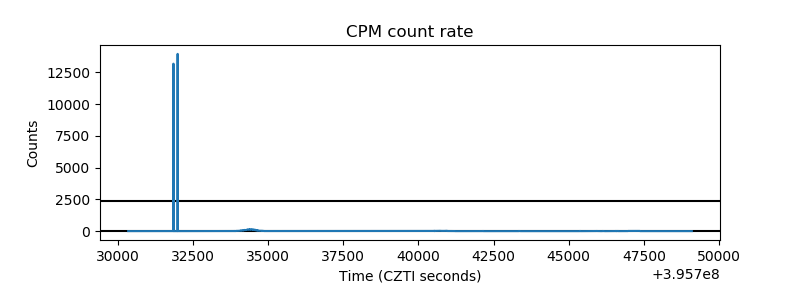 |
| CZT Counter | 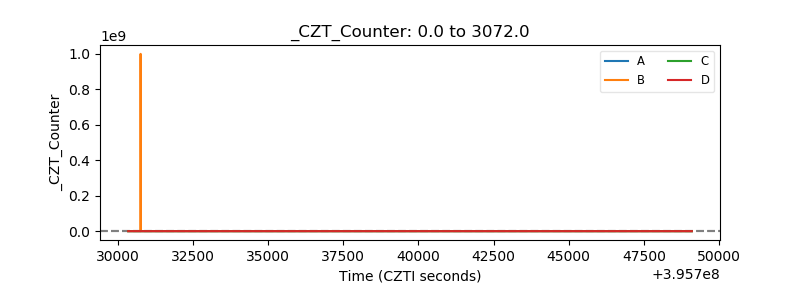 |
| +2.5 Volts monitor |  |
| +5 Volts monitor | 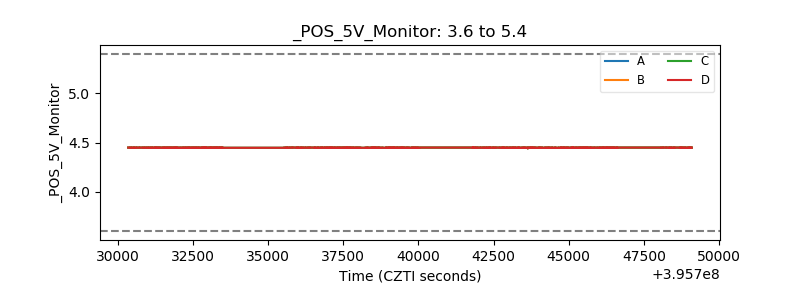 |
| _ROLL_ROT | 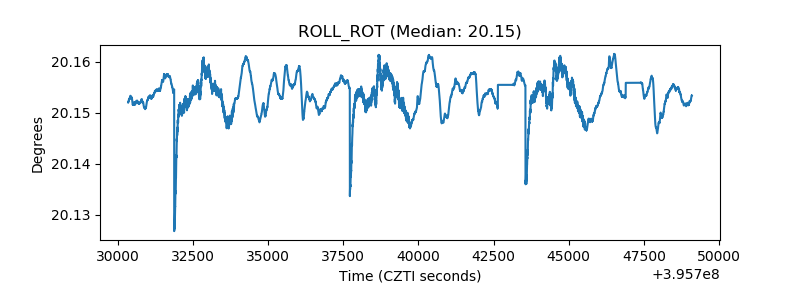 |
| _Roll_DEC | 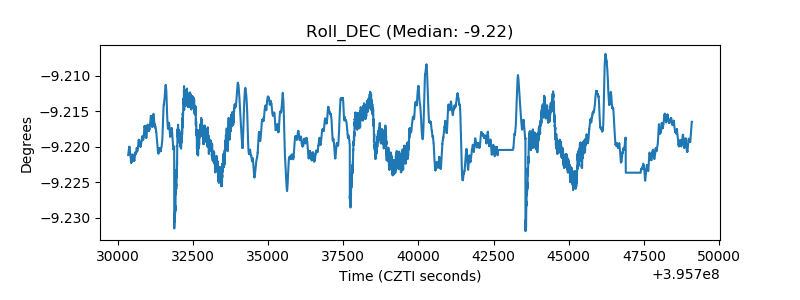 |
| _Roll_RA | 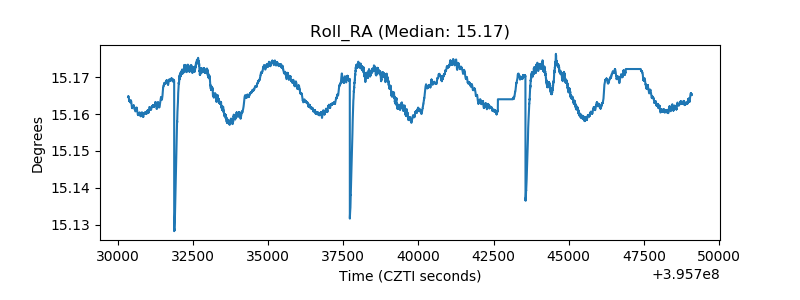 |
| Veto Counter | 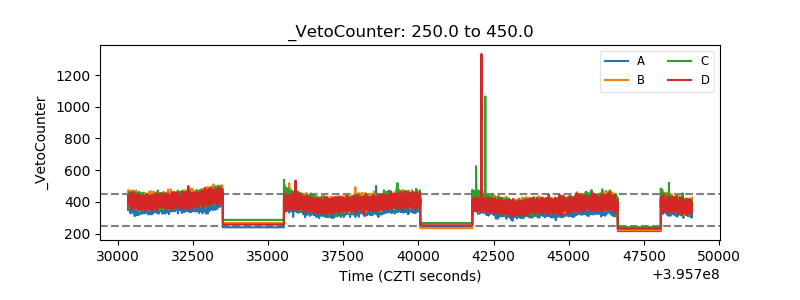 |