| Param | Original file | Final file |
|---|---|---|
| Filename | modeM0/AS1A11_087T05_9000005240_36773cztM0_level2.evt | modeM0/AS1A11_087T05_9000005240_36773cztM0_level2_quad_clean.evt |
| Size (bytes) | 637,041,600 | 55,477,440 |
| Size | 607.5 MB | 52.9 MB |
| Events in quadrant A | 2,842,719 | 334,302 |
| Events in quadrant B | 9,147,530 | 288,361 |
| Events in quadrant C | 3,426,576 | 328,573 |
| Events in quadrant D | 3,479,287 | 318,604 |
| Mode M0 | |||
|---|---|---|---|
| Quadrant | BADHDUFLAG | Total packets | Discarded packets |
| A | 0 | 12100 | 3 |
| B | 0 | 31161 | 2 |
| C | 0 | 13695 | 2 |
| D | 0 | 14275 | 2 |
| Mode M9 | |||
|---|---|---|---|
| Quadrant | BADHDUFLAG | Total packets | Discarded packets |
| A | 0 | 19 | 0 |
| B | 0 | 19 | 0 |
| C | 0 | 19 | 0 |
| D | 0 | 20 | 0 |
| Mode SS | |||
|---|---|---|---|
| Quadrant | BADHDUFLAG | Total packets | Discarded packets |
| A | 0 | 120 | 0 |
| B | 0 | 120 | 0 |
| C | 0 | 120 | 0 |
| D | 0 | 120 | 0 |
| Quadrant | Total seconds | Saturated seconds | Saturation percentage |
|---|---|---|---|
| A | 5854 | 8 | 0.136659% |
| B | 5854 | 2656 | 45.370687% |
| C | 5854 | 86 | 1.469081% |
| D | 5854 | 130 | 2.220704% |
Noise dominated data is calculated using 1-second bins in cleaned event files. If a bin has >2000 counts, and if more than 50% of those come from <1% of pixels, then it is considered to be noise-dominated and hence unusable.
| Quadrant | # 1 sec bins | Bins with >0 counts | Bins with >2000 counts | High rate bins dominated by noise | Noise dominated (total time) | Noise dominated (detector-on time) | Marked lightcurve |
|---|---|---|---|---|---|---|---|
| A | 7167 | 5855 | 3 | 3 | 0.04% | 0.05% | 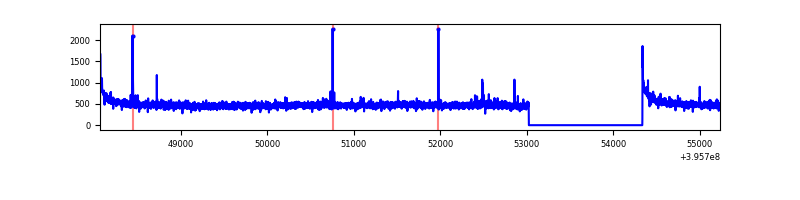 |
| B | 7167 | 5854 | 2434 | 2434 | 33.96% | 41.58% | 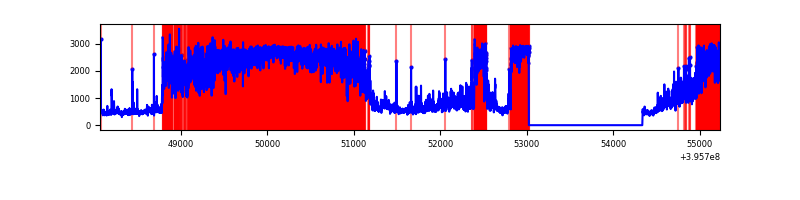 |
| C | 7167 | 5855 | 73 | 73 | 1.02% | 1.25% | 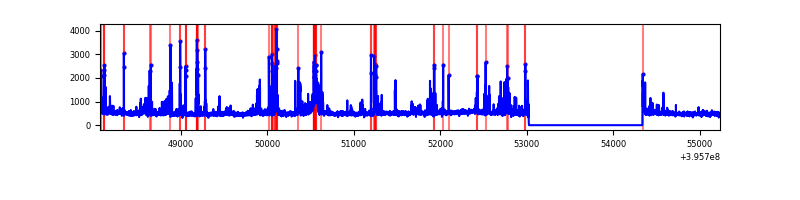 |
| D | 7167 | 5855 | 108 | 108 | 1.51% | 1.84% | 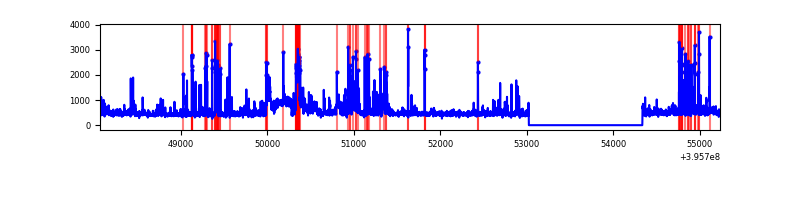 |
Top three noisy pixels from each quadrant. If the there are fewer than three noisy pixels in the level2.evt file, extra rows are filled as -1
| Pixel properties | Quadrant properties | ||||||
|---|---|---|---|---|---|---|---|
| Quadrant | DetID | PixID | Counts | Sigma | Mean | Median | Sigma |
| A | 10 | 83 | 222119 | 1630.41 | 668 | 654 | 135.8 |
| A | 9 | 143 | 19568 | 139.24 | 668 | 654 | 135.8 |
| A | 13 | 6 | 10704 | 73.99 | 668 | 654 | 135.8 |
| B | 12 | 1 | 6803729 | 68298.8 | 520 | 507 | 99.6 |
| B | 5 | 200 | 112950 | 1128.84 | 520 | 507 | 99.6 |
| B | 0 | 213 | 28235 | 278.37 | 520 | 507 | 99.6 |
| C | 0 | 207 | 420416 | 2768.03 | 647 | 650 | 151.6 |
| C | 15 | 214 | 249554 | 1641.33 | 647 | 650 | 151.6 |
| C | 12 | 249 | 125405 | 822.66 | 647 | 650 | 151.6 |
| D | 13 | 249 | 613839 | 3831.07 | 649 | 631 | 160.1 |
| D | 2 | 250 | 95961 | 595.58 | 649 | 631 | 160.1 |
| D | 13 | 171 | 91859 | 569.95 | 649 | 631 | 160.1 |
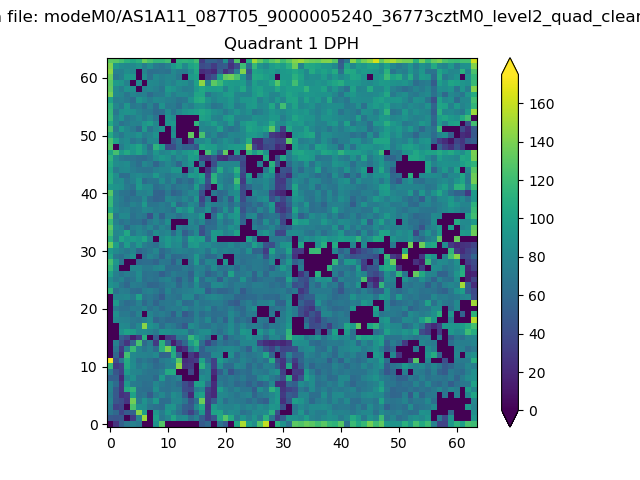
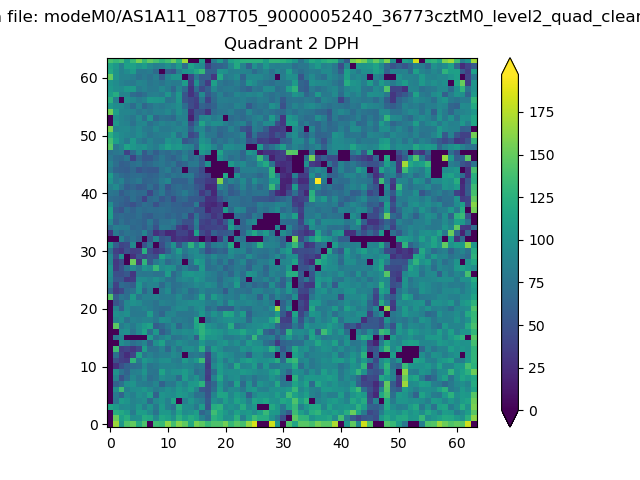
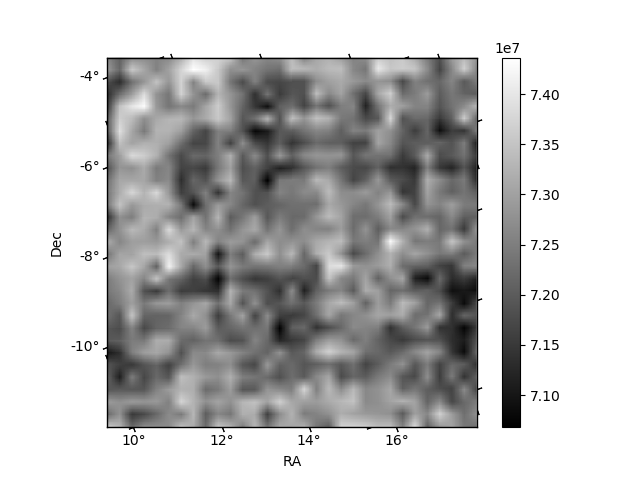
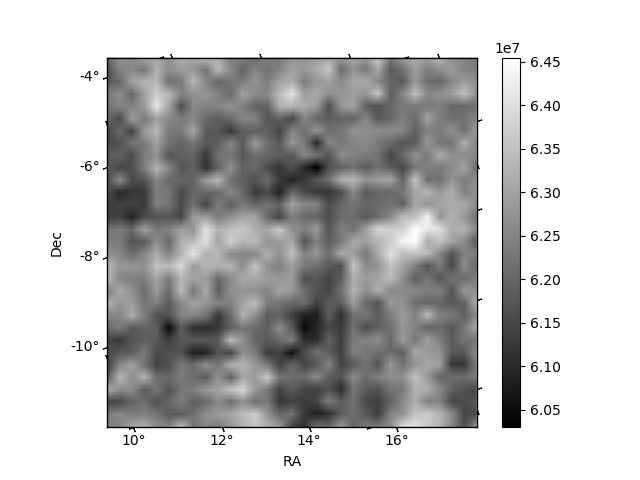
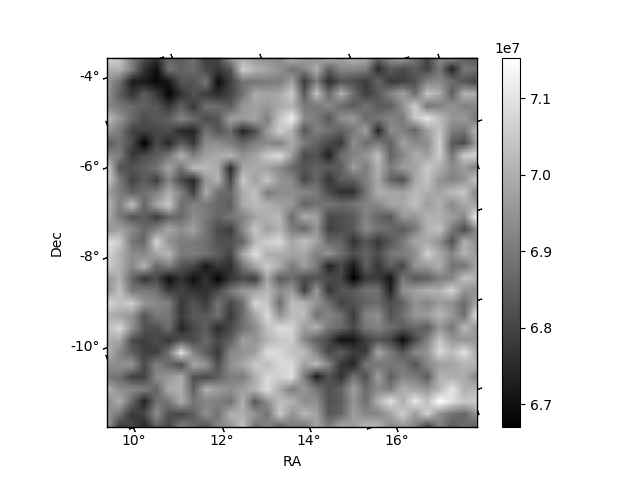
Histogram calculated using DETX and DETY for each event in the final _common_clean file
| Quadrant A |  |
 |
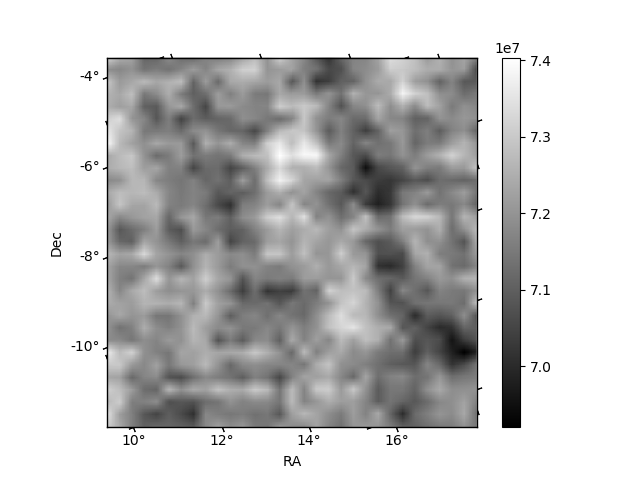
Quadrant B |
|---|---|---|---|
| Quadrant D | 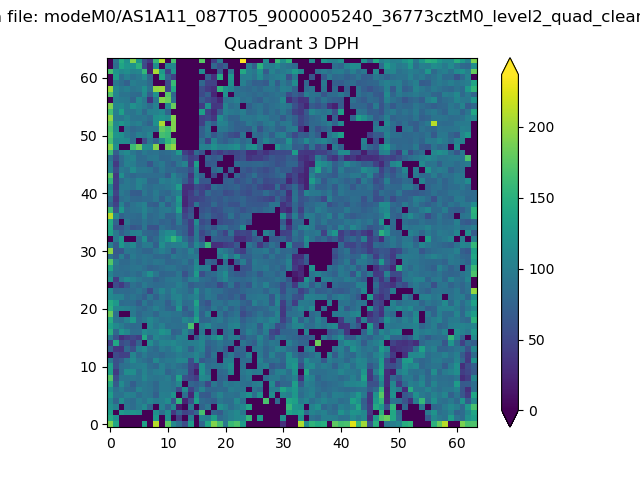 |
 |
Quadrant C |
| Plot type | Count rate plots | Images |
|---|---|---|
| Comparison with Poisson distribution Blue bars denote a histogram of data divided into 1 sec bins. Red curve is a Poisson curve with rate = median count rate of data. |
 |
 |
| Quadrant-wise count rates Data is divided into 100 sec bins |
 |
|
| Module-wise count rates for Quadrant A Data is divided into 100 sec bins |
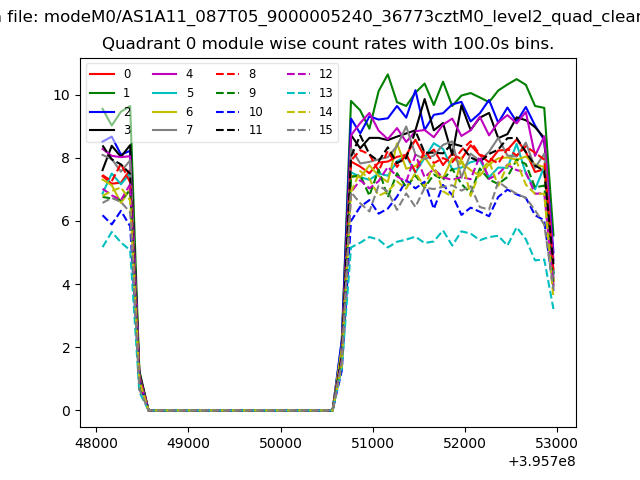 |
 |
| Module-wise count rates for Quadrant B Data is divided into 100 sec bins |
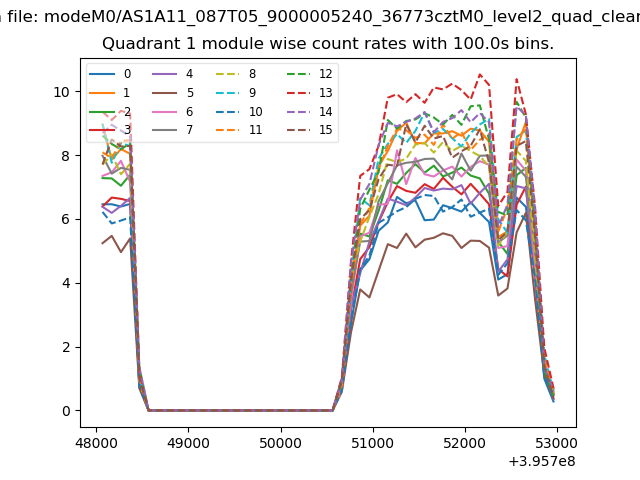 |
 |
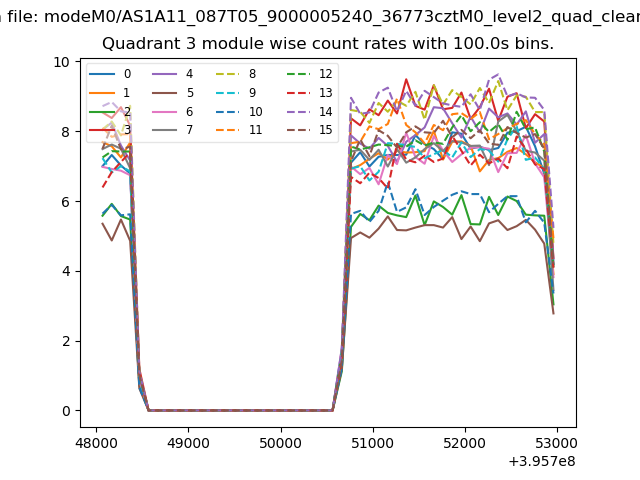
| Module-wise count rates for Quadrant C Data is divided into 100 sec bins |
 |
 |
| Module-wise count rates for Quadrant D Data is divided into 100 sec bins |
 |
 |
| Parameter | Plot |
|---|---|
| CZT HV Monitor | 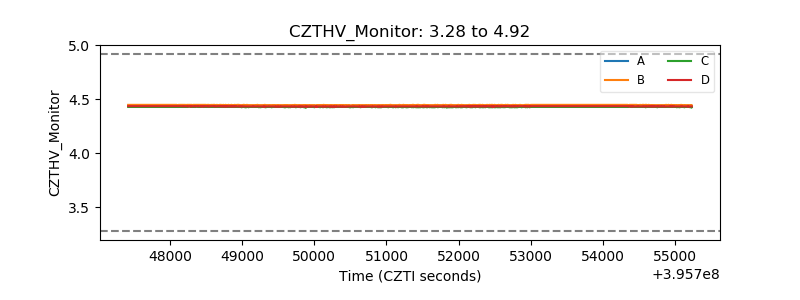 |
| D_VDD | 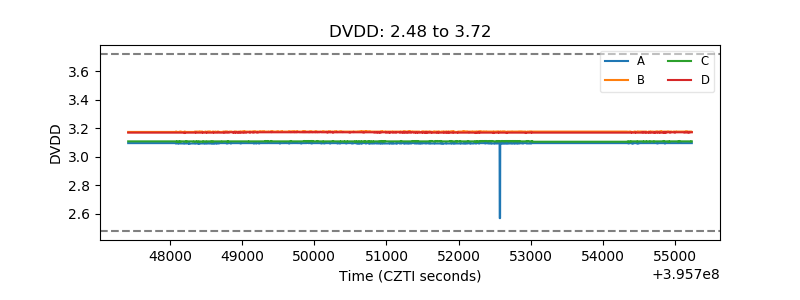 |
| Temperature 1 | 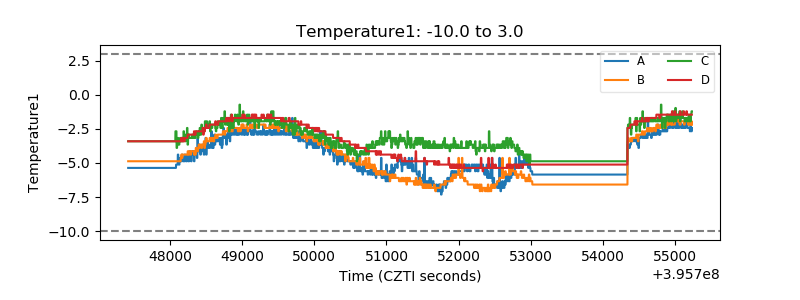 |
| Veto HV Monitor | 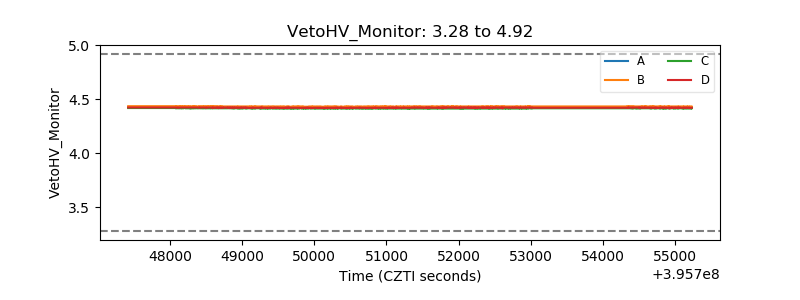 |
| Veto LLD | 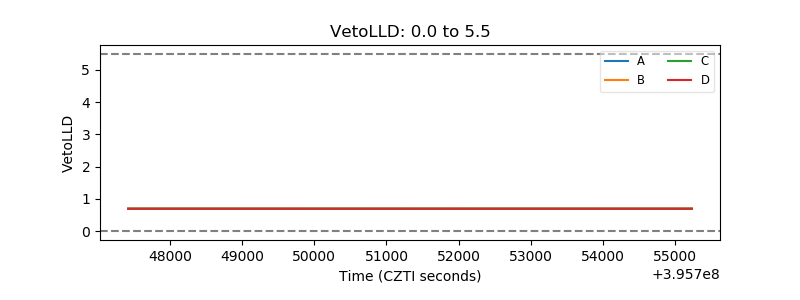 |
| Alpha Counter |  |
| _CPM_Rate | 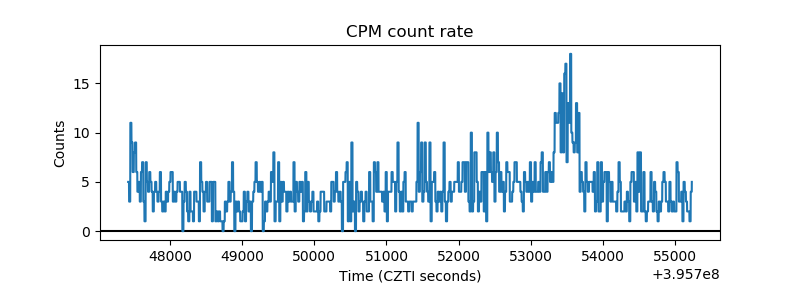 |
| CZT Counter | 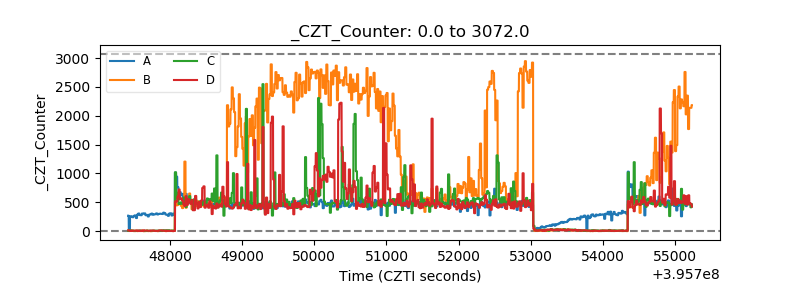 |
| +2.5 Volts monitor |  |
| +5 Volts monitor |  |
| _ROLL_ROT | 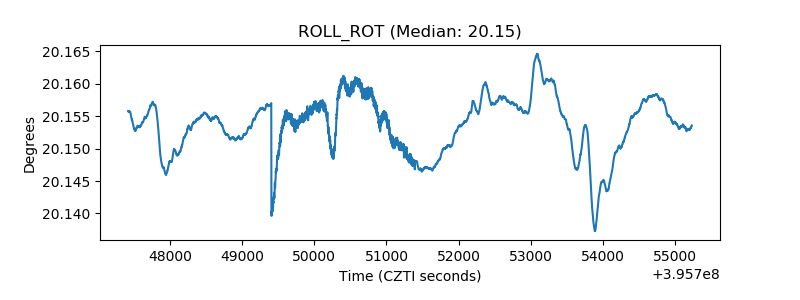 |
| _Roll_DEC | 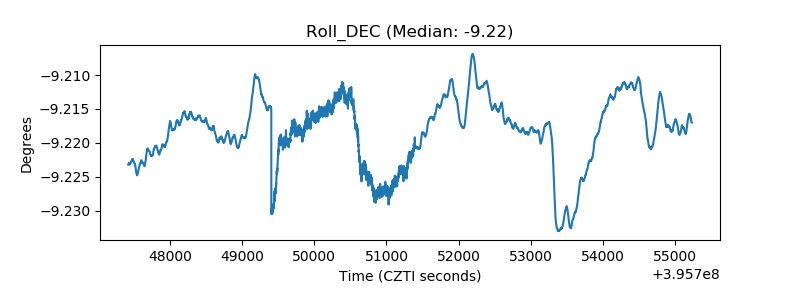 |
| _Roll_RA | 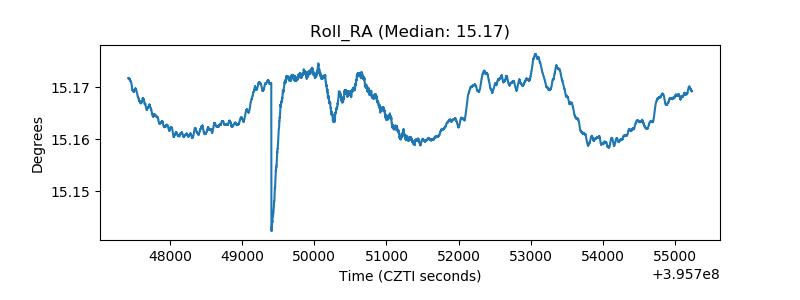 |
| Veto Counter | 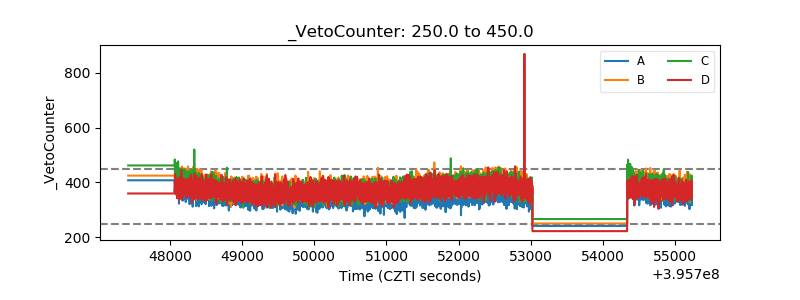 |