| Param | Original file | Final file |
|---|---|---|
| Filename | modeM0/AS1A11_087T05_9000005240_36776cztM0_level2.evt | modeM0/AS1A11_087T05_9000005240_36776cztM0_level2_quad_clean.evt |
| Size (bytes) | 1,985,958,720 | 159,716,160 |
| Size | 1.8 GB | 152.3 MB |
| Events in quadrant A | 7,540,470 | 1,113,266 |
| Events in quadrant B | 33,650,516 | 540,670 |
| Events in quadrant C | 8,759,978 | 1,083,164 |
| Events in quadrant D | 9,143,949 | 1,019,594 |
| Mode M0 | |||
|---|---|---|---|
| Quadrant | BADHDUFLAG | Total packets | Discarded packets |
| A | 0 | 32303 | 5 |
| B | 0 | 110620 | 4 |
| C | 0 | 35392 | 4 |
| D | 0 | 37502 | 4 |
| Mode M9 | |||
|---|---|---|---|
| Quadrant | BADHDUFLAG | Total packets | Discarded packets |
| A | 0 | 44 | 0 |
| B | 0 | 44 | 0 |
| C | 0 | 44 | 0 |
| D | 0 | 45 | 0 |
| Mode SS | |||
|---|---|---|---|
| Quadrant | BADHDUFLAG | Total packets | Discarded packets |
| A | 0 | 320 | 0 |
| B | 0 | 320 | 0 |
| C | 0 | 320 | 0 |
| D | 0 | 320 | 0 |
| Quadrant | Total seconds | Saturated seconds | Saturation percentage |
|---|---|---|---|
| A | 15589 | 35 | 0.224517% |
| B | 15589 | 11918 | 76.451344% |
| C | 15589 | 237 | 1.520303% |
| D | 15589 | 552 | 3.540958% |
Noise dominated data is calculated using 1-second bins in cleaned event files. If a bin has >2000 counts, and if more than 50% of those come from <1% of pixels, then it is considered to be noise-dominated and hence unusable.
| Quadrant | # 1 sec bins | Bins with >0 counts | Bins with >2000 counts | High rate bins dominated by noise | Noise dominated (total time) | Noise dominated (detector-on time) | Marked lightcurve |
|---|---|---|---|---|---|---|---|
| A | 19798 | 15592 | 6 | 6 | 0.03% | 0.04% | 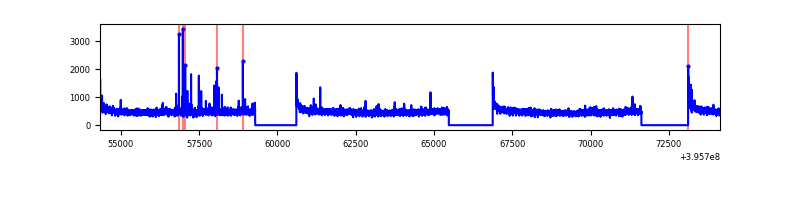 |
| B | 19798 | 15590 | 10898 | 10898 | 55.05% | 69.90% | 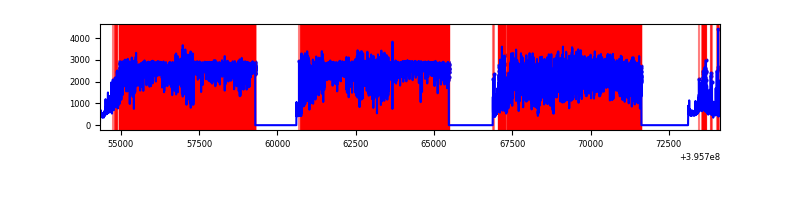 |
| C | 19798 | 15592 | 224 | 224 | 1.13% | 1.44% | 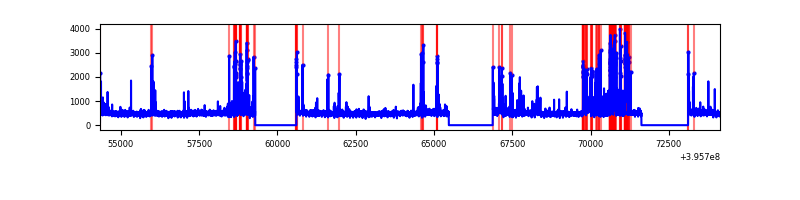 |
| D | 19798 | 15591 | 508 | 508 | 2.57% | 3.26% | 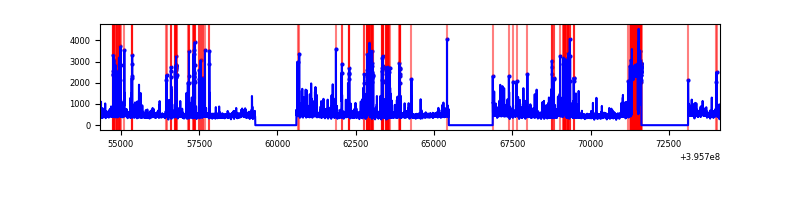 |
Top three noisy pixels from each quadrant. If the there are fewer than three noisy pixels in the level2.evt file, extra rows are filled as -1
| Pixel properties | Quadrant properties | ||||||
|---|---|---|---|---|---|---|---|
| Quadrant | DetID | PixID | Counts | Sigma | Mean | Median | Sigma |
| A | 10 | 83 | 536226 | 1490.46 | 1774 | 1740 | 358.6 |
| A | 7 | 16 | 56775 | 153.47 | 1774 | 1740 | 358.6 |
| A | 9 | 143 | 47236 | 126.87 | 1774 | 1740 | 358.6 |
| B | 12 | 1 | 28551413 | 133969.68 | 1125 | 1096 | 213.1 |
| B | 4 | 171 | 147942 | 689.06 | 1125 | 1096 | 213.1 |
| B | 5 | 172 | 136856 | 637.04 | 1125 | 1096 | 213.1 |
| C | 0 | 207 | 753884 | 1870.93 | 1725 | 1736 | 402.0 |
| C | 15 | 214 | 651981 | 1617.45 | 1725 | 1736 | 402.0 |
| C | 14 | 254 | 501334 | 1242.72 | 1725 | 1736 | 402.0 |
| D | 12 | 6 | 755873 | 1806.97 | 1700 | 1651 | 417.4 |
| D | 13 | 249 | 582846 | 1392.43 | 1700 | 1651 | 417.4 |
| D | 2 | 249 | 256051 | 609.49 | 1700 | 1651 | 417.4 |
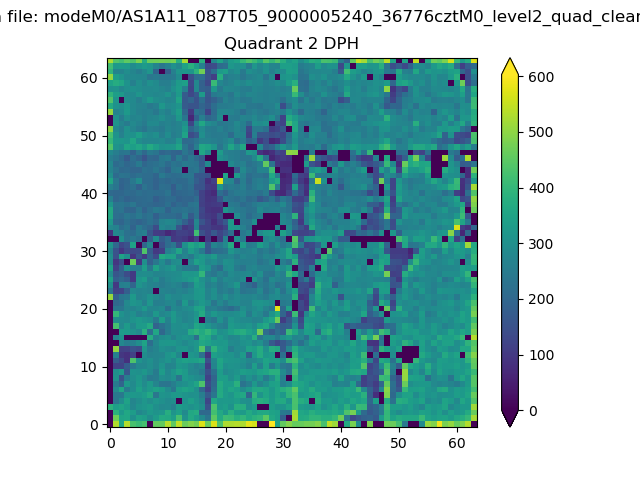
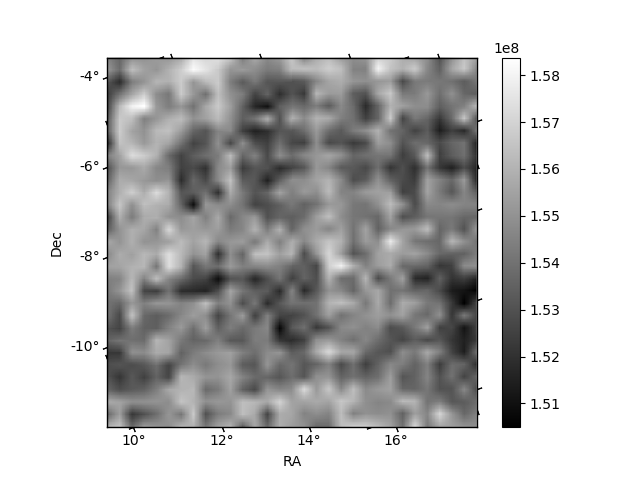
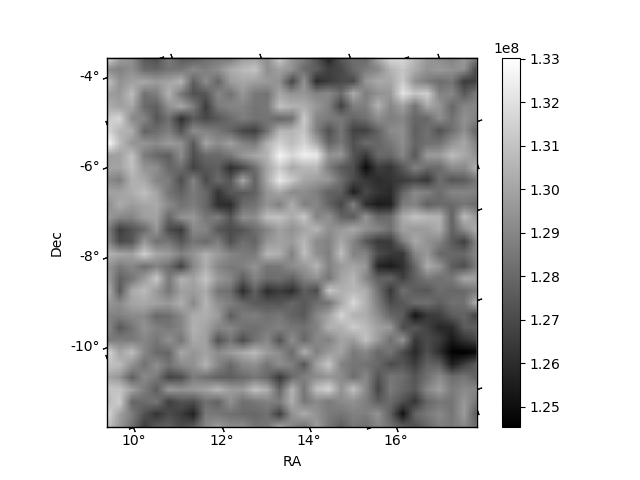
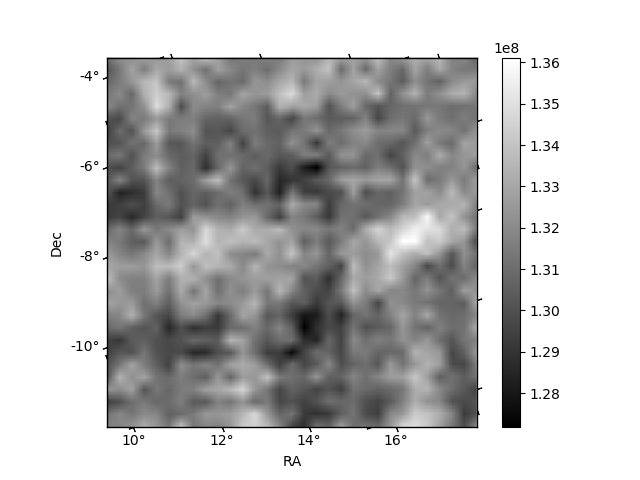
Histogram calculated using DETX and DETY for each event in the final _common_clean file
| Quadrant A | 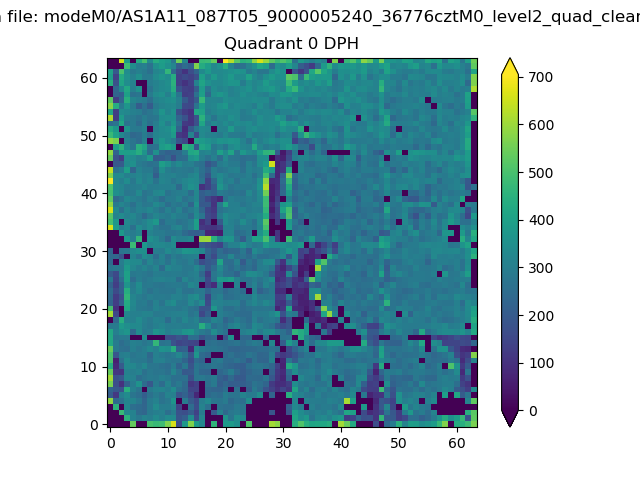 |
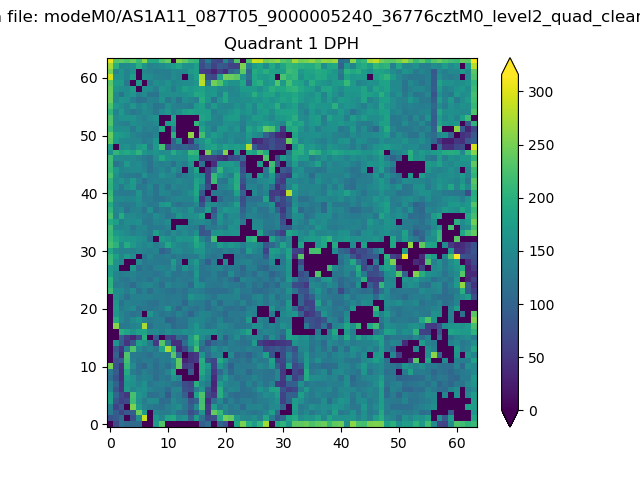 |
Quadrant B |
|---|---|---|---|
| Quadrant D | 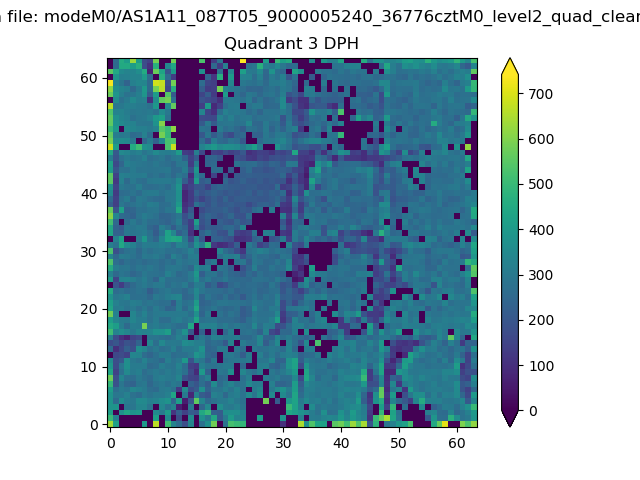 |
 |
Quadrant C |
| Plot type | Count rate plots | Images |
|---|---|---|
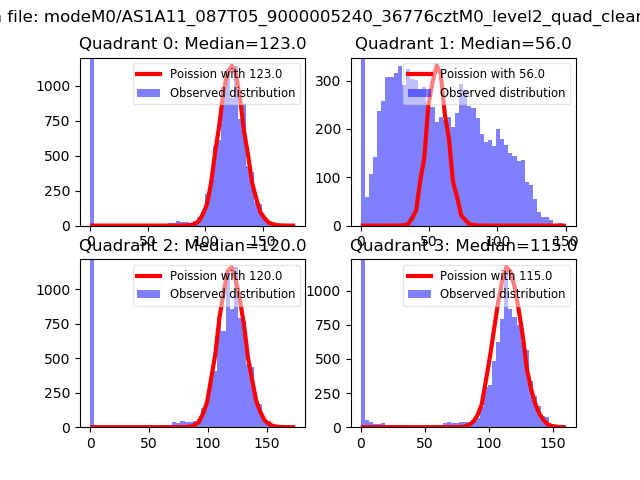
| Comparison with Poisson distribution Blue bars denote a histogram of data divided into 1 sec bins. Red curve is a Poisson curve with rate = median count rate of data. |
 |
 |
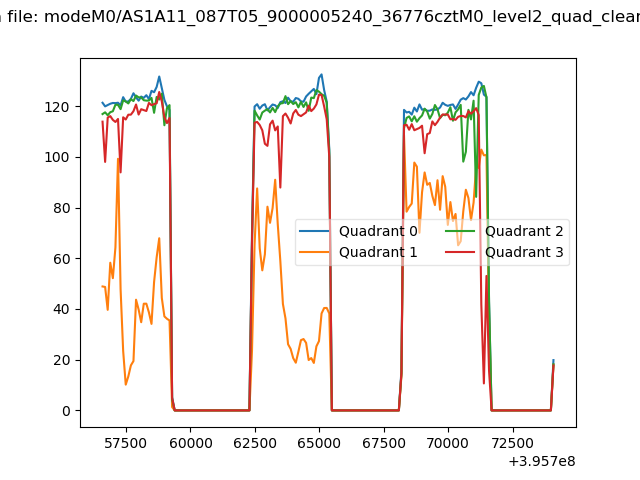
| Quadrant-wise count rates Data is divided into 100 sec bins |
 |
|
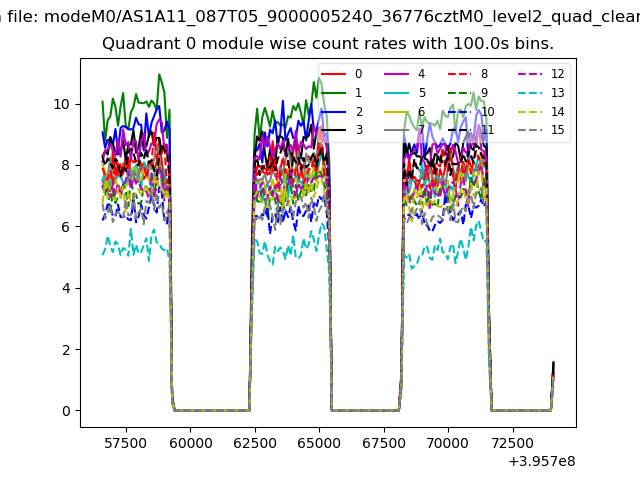
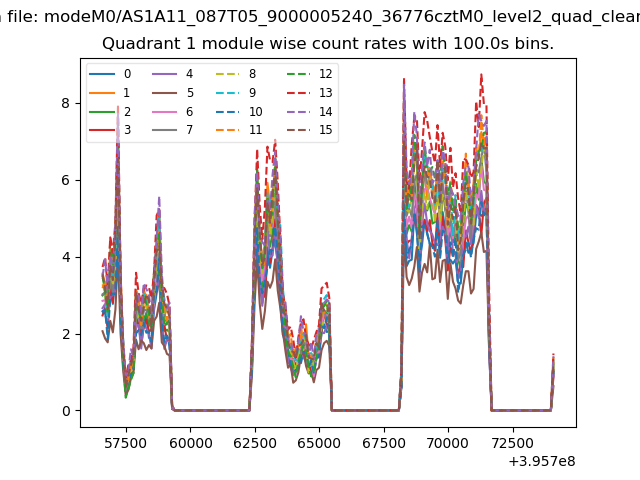
| Module-wise count rates for Quadrant A Data is divided into 100 sec bins |
 |
 |
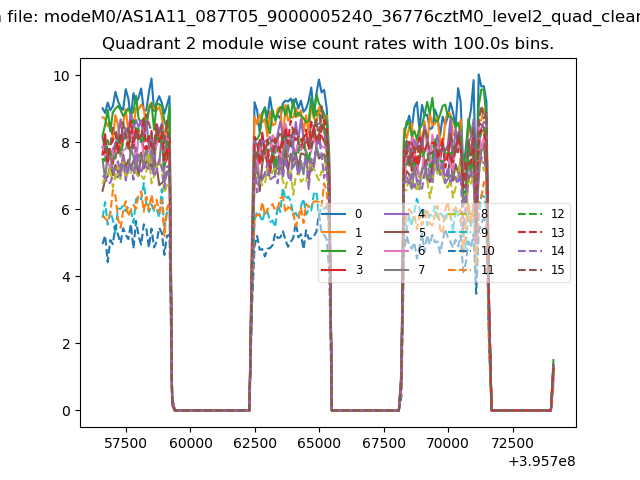
| Module-wise count rates for Quadrant B Data is divided into 100 sec bins |
 |
 |
| Module-wise count rates for Quadrant C Data is divided into 100 sec bins |
 |
 |
| Module-wise count rates for Quadrant D Data is divided into 100 sec bins |
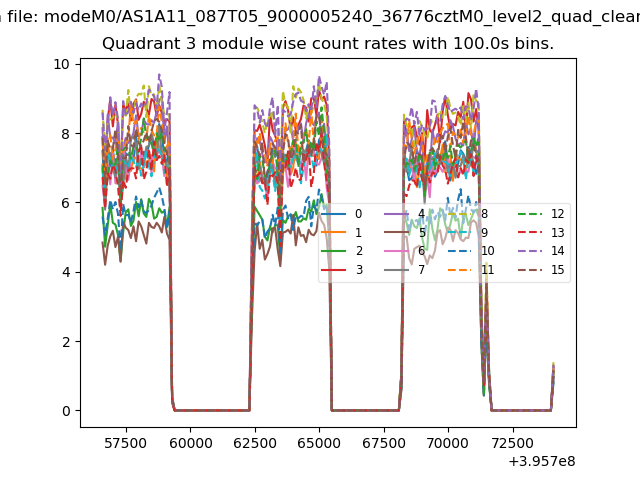 |
 |
| Parameter | Plot |
|---|---|
| CZT HV Monitor | 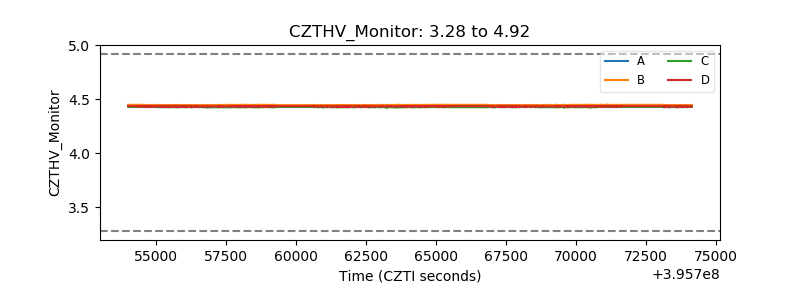 |
| D_VDD | 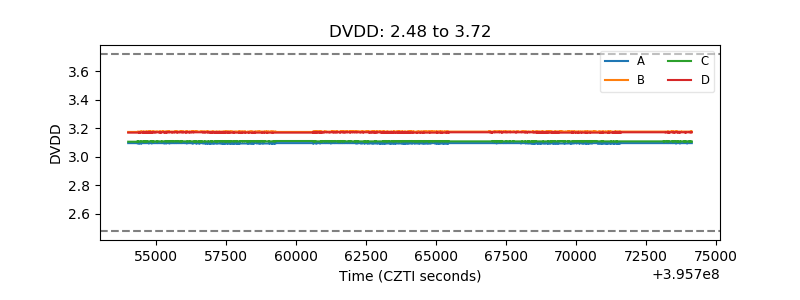 |
| Temperature 1 | 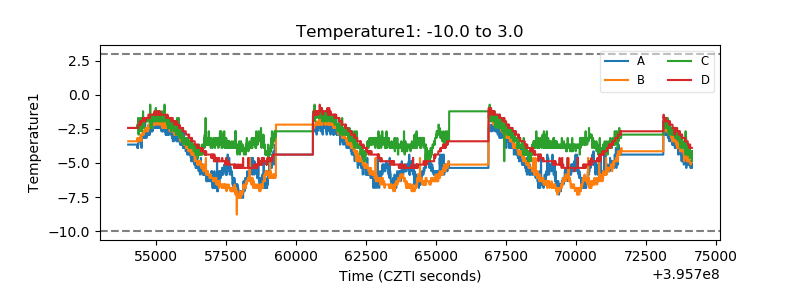 |
| Veto HV Monitor | 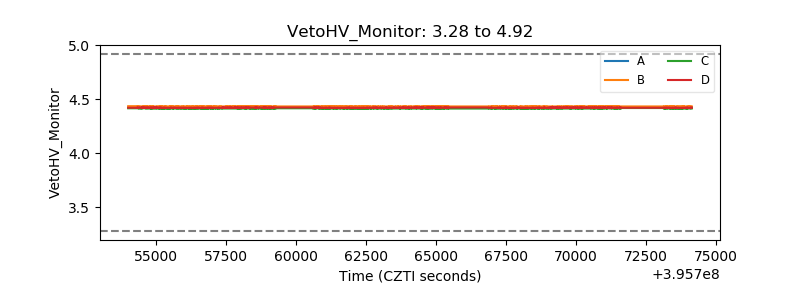 |
| Veto LLD | 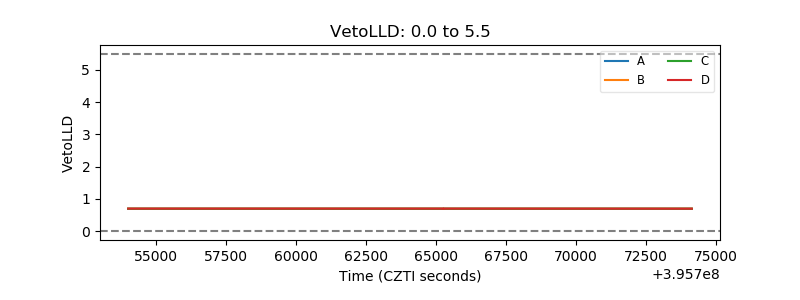 |
| Alpha Counter | 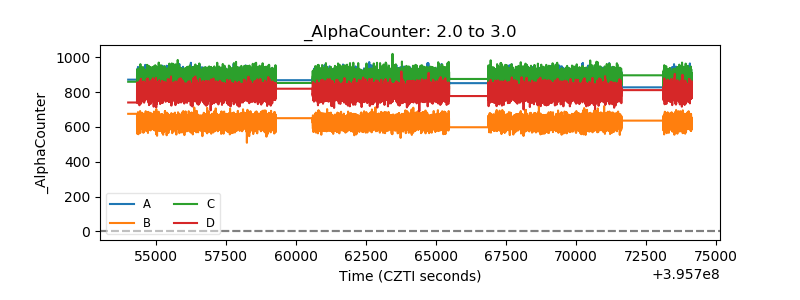 |
| _CPM_Rate | 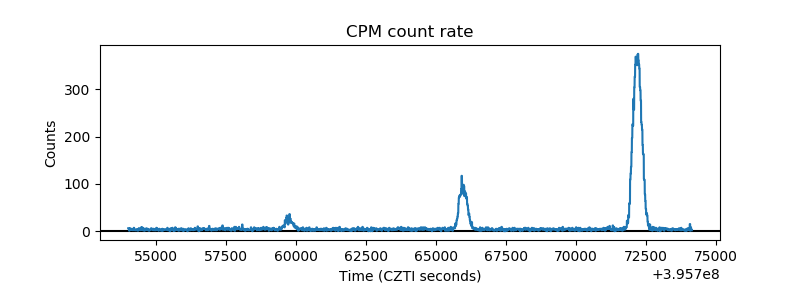 |
| CZT Counter | 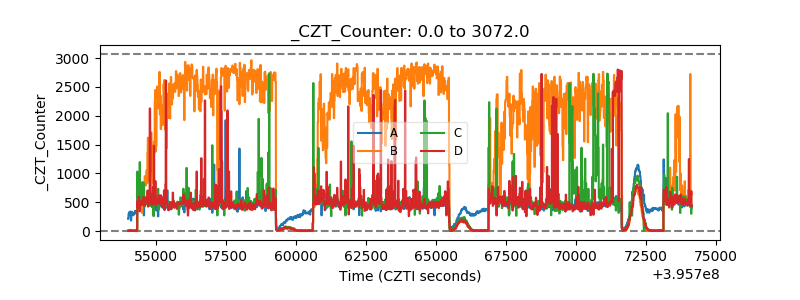 |
| +2.5 Volts monitor | 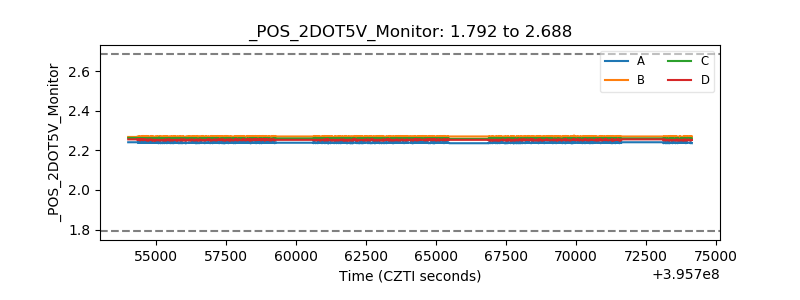 |
| +5 Volts monitor | 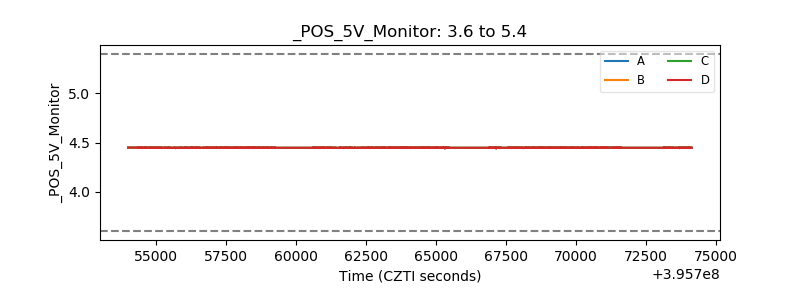 |
| _ROLL_ROT | 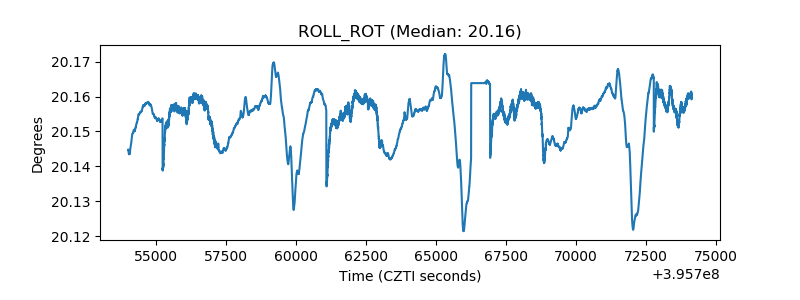 |
| _Roll_DEC | 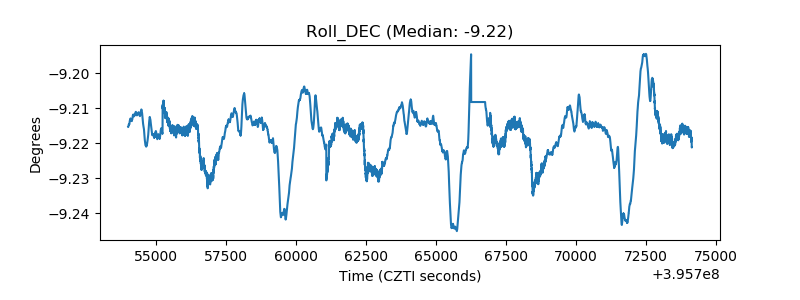 |
| _Roll_RA | 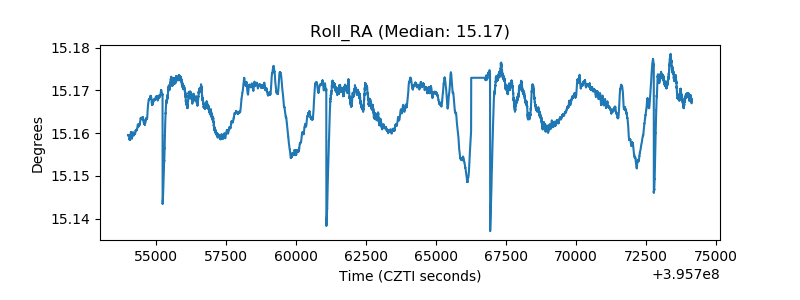 |
| Veto Counter |  |