| Param | Original file | Final file |
|---|---|---|
| Filename | modeM0/AS1A11_087T05_9000005240_36780cztM0_level2.evt | modeM0/AS1A11_087T05_9000005240_36780cztM0_level2_quad_clean.evt |
| Size (bytes) | 99,236,160 | 17,591,040 |
| Size | 94.6 MB | 16.8 MB |
| Events in quadrant A | 611,986 | 113,480 |
| Events in quadrant B | 620,348 | 115,698 |
| Events in quadrant C | 616,543 | 114,333 |
| Events in quadrant D | 1,080,291 | 106,204 |
| Mode M0 | |||
|---|---|---|---|
| Quadrant | BADHDUFLAG | Total packets | Discarded packets |
| A | 0 | 2459 | 1 |
| B | 0 | 2486 | 1 |
| C | 0 | 2442 | 1 |
| D | 0 | 3967 | 1 |
| Mode M9 | |||
|---|---|---|---|
| Quadrant | BADHDUFLAG | Total packets | Discarded packets |
| A | 0 | 17 | 0 |
| B | 0 | 17 | 0 |
| C | 0 | 17 | 0 |
| D | 0 | 17 | 0 |
| Mode SS | |||
|---|---|---|---|
| Quadrant | BADHDUFLAG | Total packets | Discarded packets |
| A | 0 | 26 | 0 |
| B | 0 | 26 | 0 |
| C | 0 | 26 | 0 |
| D | 0 | 26 | 0 |
| Quadrant | Total seconds | Saturated seconds | Saturation percentage |
|---|---|---|---|
| A | 1071 | 8 | 0.746965% |
| B | 1071 | 4 | 0.373483% |
| C | 1071 | 10 | 0.933707% |
| D | 1071 | 53 | 4.948646% |
Noise dominated data is calculated using 1-second bins in cleaned event files. If a bin has >2000 counts, and if more than 50% of those come from <1% of pixels, then it is considered to be noise-dominated and hence unusable.
| Quadrant | # 1 sec bins | Bins with >0 counts | Bins with >2000 counts | High rate bins dominated by noise | Noise dominated (total time) | Noise dominated (detector-on time) | Marked lightcurve |
|---|---|---|---|---|---|---|---|
| A | 2804 | 1072 | 1 | 1 | 0.04% | 0.09% | 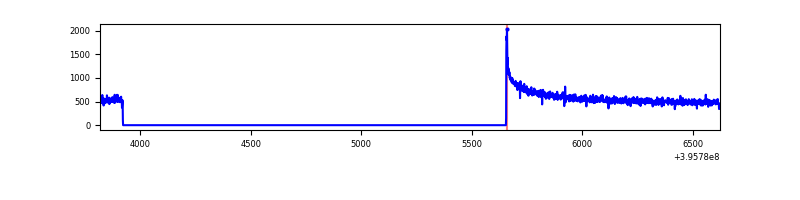 |
| B | 2804 | 1072 | 3 | 3 | 0.11% | 0.28% | 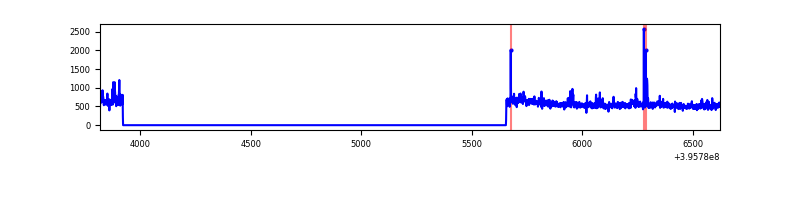 |
| C | 2804 | 1072 | 7 | 7 | 0.25% | 0.65% | 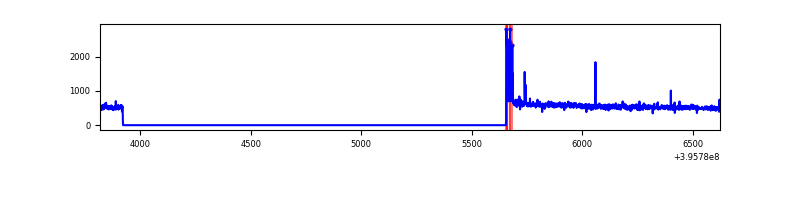 |
| D | 2804 | 1072 | 42 | 42 | 1.50% | 3.92% | 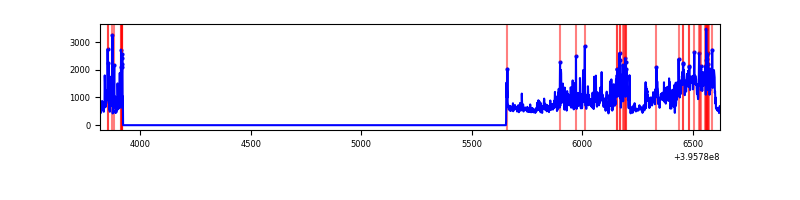 |
Top three noisy pixels from each quadrant. If the there are fewer than three noisy pixels in the level2.evt file, extra rows are filled as -1
| Pixel properties | Quadrant properties | ||||||
|---|---|---|---|---|---|---|---|
| Quadrant | DetID | PixID | Counts | Sigma | Mean | Median | Sigma |
| A | 10 | 83 | 76799 | 2601.33 | 137 | 134 | 29.5 |
| A | 13 | 6 | 2986 | 96.77 | 137 | 134 | 29.5 |
| A | 10 | 67 | 2315 | 74.0 | 137 | 134 | 29.5 |
| B | 12 | 1 | 30330 | 1050.58 | 138 | 134 | 28.7 |
| B | 0 | 221 | 12202 | 419.87 | 138 | 134 | 28.7 |
| B | 4 | 171 | 11440 | 393.36 | 138 | 134 | 28.7 |
| C | 15 | 214 | 49188 | 1482.94 | 135 | 136 | 33.1 |
| C | 0 | 10 | 32779 | 986.86 | 135 | 136 | 33.1 |
| C | 14 | 254 | 4716 | 138.46 | 135 | 136 | 33.1 |
| D | 2 | 249 | 204907 | 5973.25 | 132 | 128 | 34.3 |
| D | 12 | 227 | 199901 | 5827.23 | 132 | 128 | 34.3 |
| D | 13 | 249 | 76369 | 2223.89 | 132 | 128 | 34.3 |
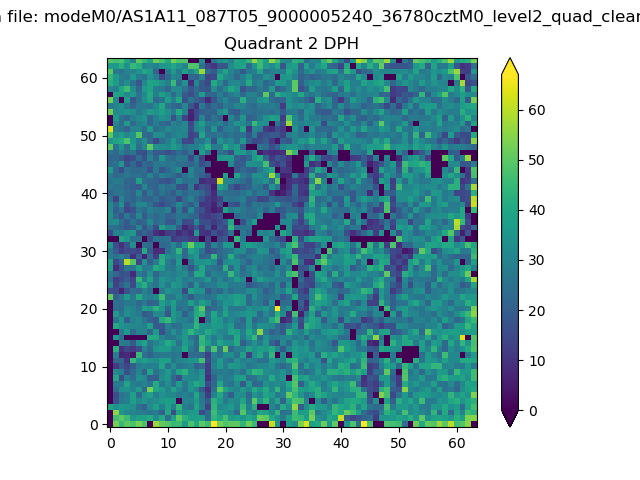
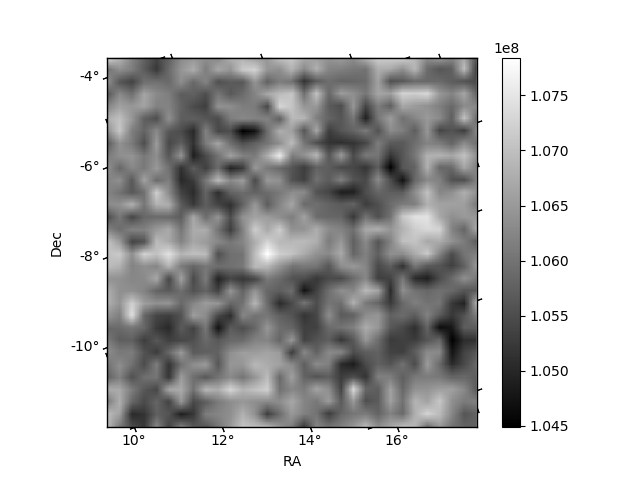
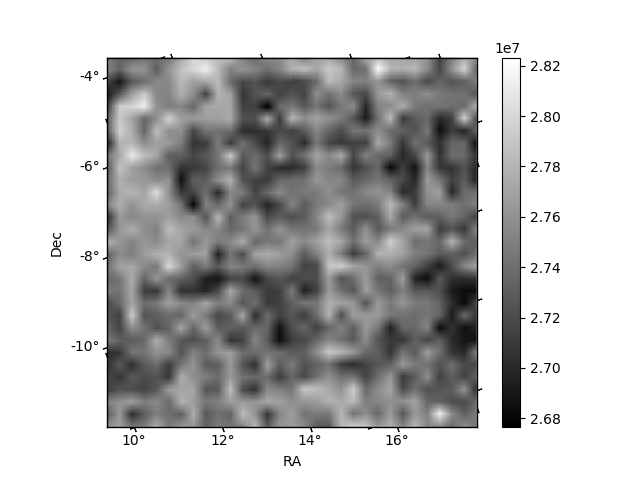
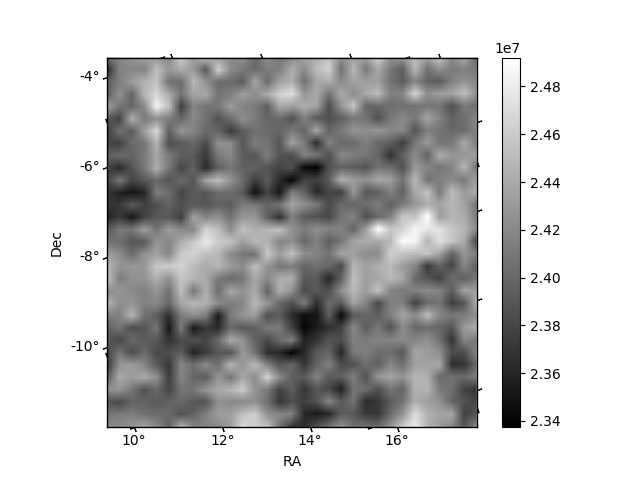
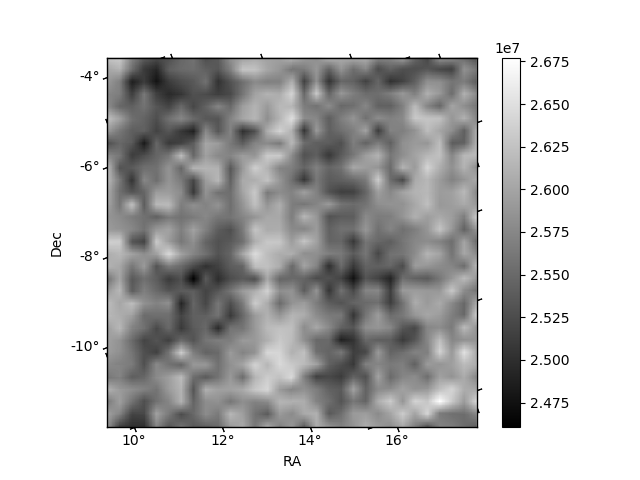
Histogram calculated using DETX and DETY for each event in the final _common_clean file
| Quadrant A | 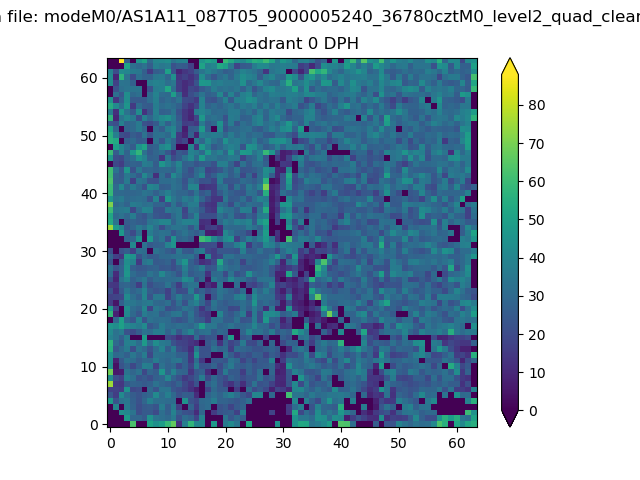 |
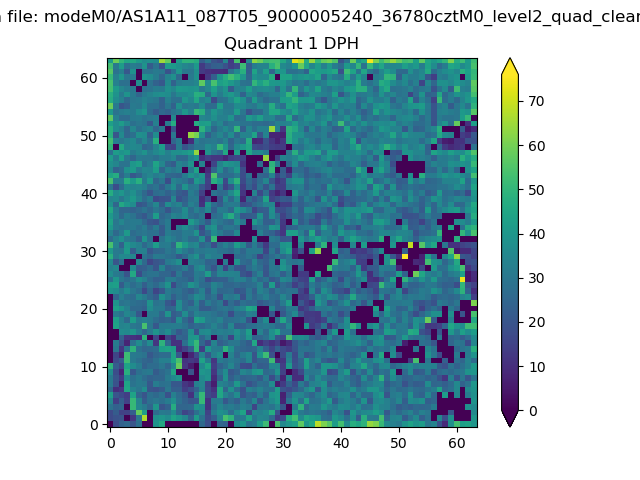 |
Quadrant B |
|---|---|---|---|
| Quadrant D | 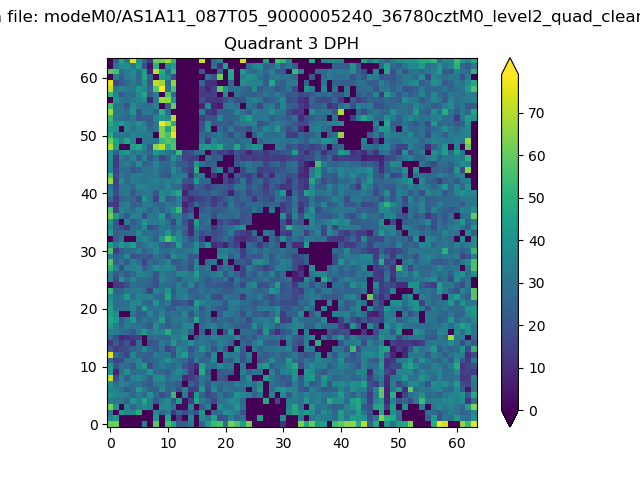 |
 |
Quadrant C |
| Plot type | Count rate plots | Images |
|---|---|---|
| Comparison with Poisson distribution Blue bars denote a histogram of data divided into 1 sec bins. Red curve is a Poisson curve with rate = median count rate of data. |
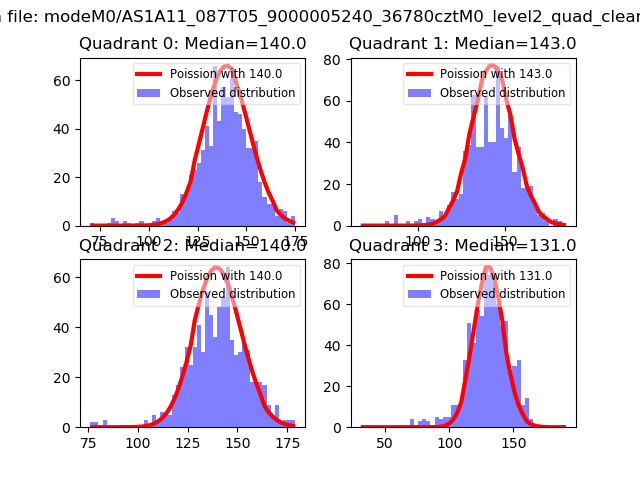 |
 |
| Quadrant-wise count rates Data is divided into 100 sec bins |
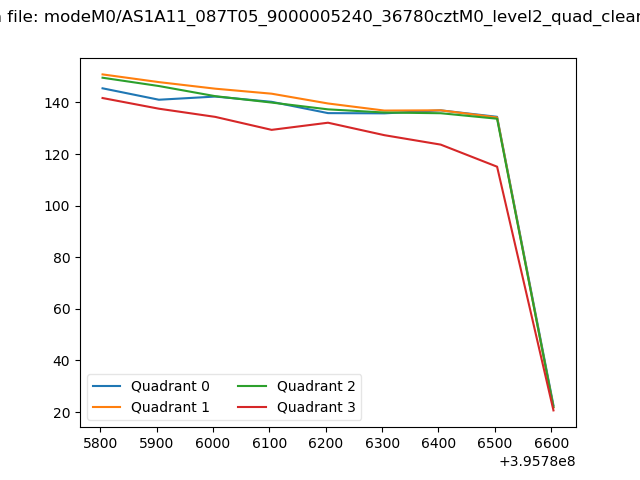 |
|
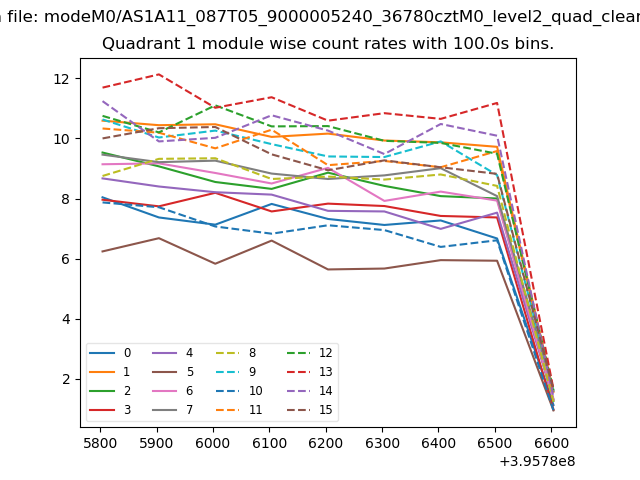
| Module-wise count rates for Quadrant A Data is divided into 100 sec bins |
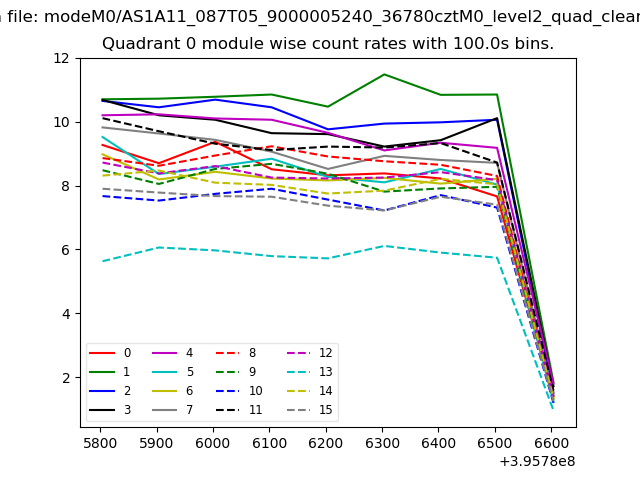 |
 |
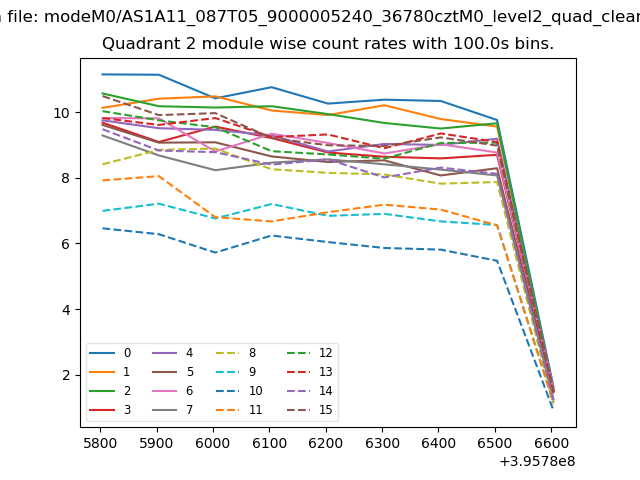
| Module-wise count rates for Quadrant B Data is divided into 100 sec bins |
 |
 |
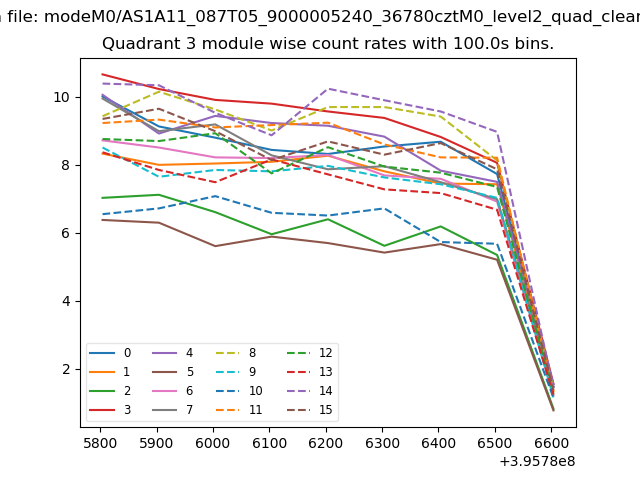
| Module-wise count rates for Quadrant C Data is divided into 100 sec bins |
 |
 |
| Module-wise count rates for Quadrant D Data is divided into 100 sec bins |
 |
 |
| Parameter | Plot |
|---|---|
| CZT HV Monitor | 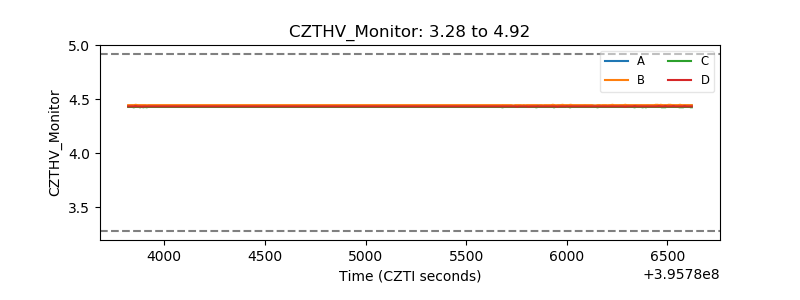 |
| D_VDD | 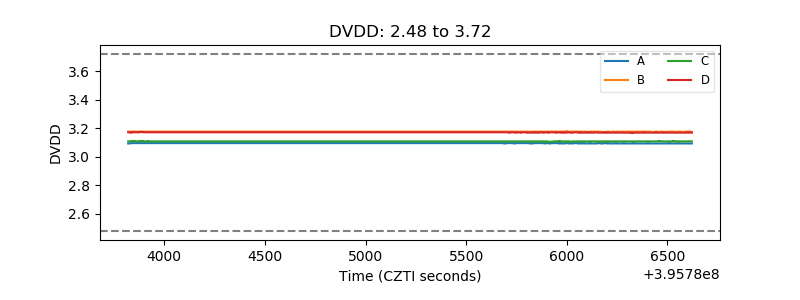 |
| Temperature 1 | 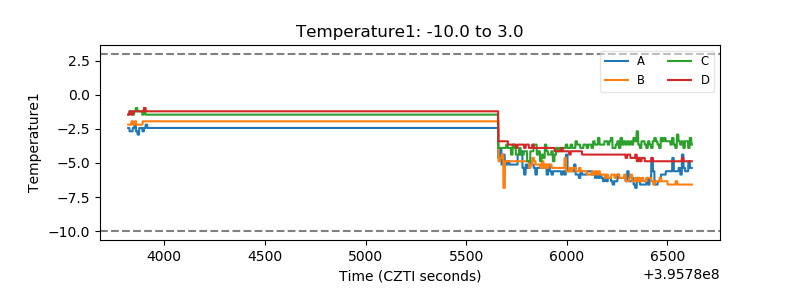 |
| Veto HV Monitor |  |
| Veto LLD | 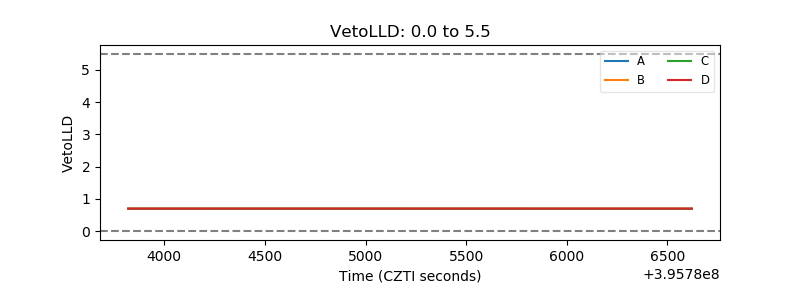 |
| Alpha Counter | 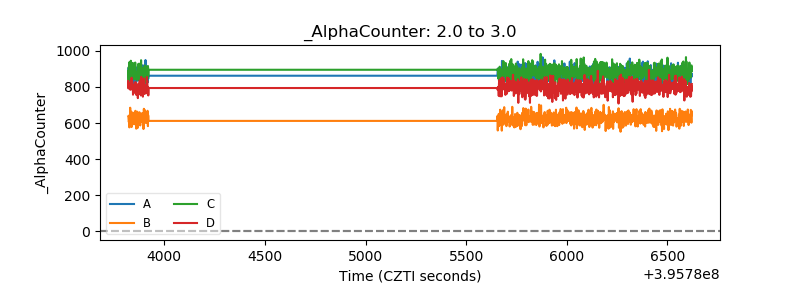 |
| _CPM_Rate | 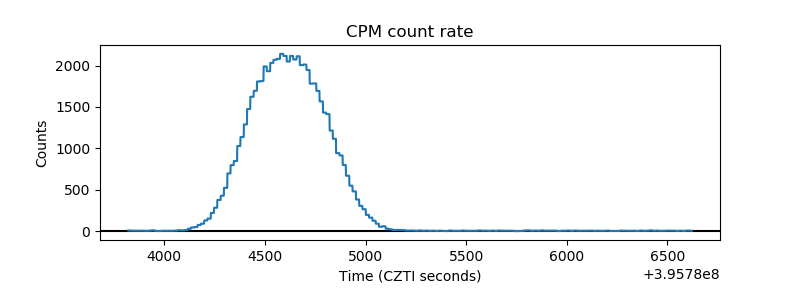 |
| CZT Counter | 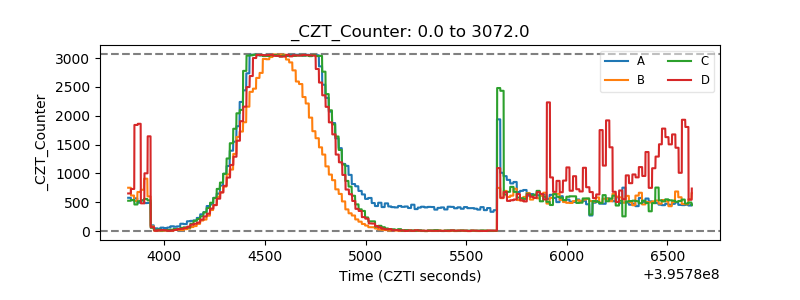 |
| +2.5 Volts monitor |  |
| +5 Volts monitor | 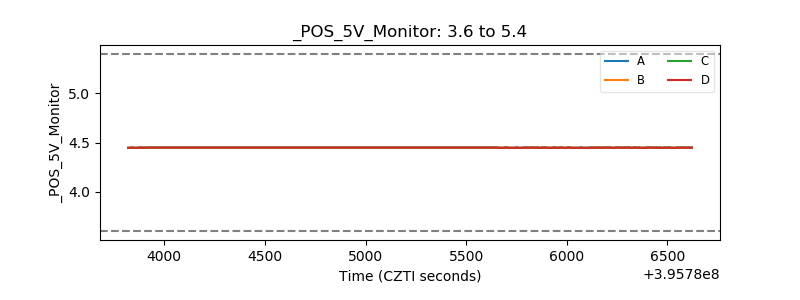 |
| _ROLL_ROT | 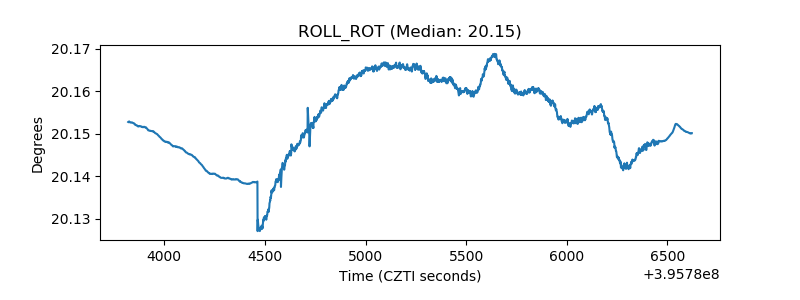 |
| _Roll_DEC | 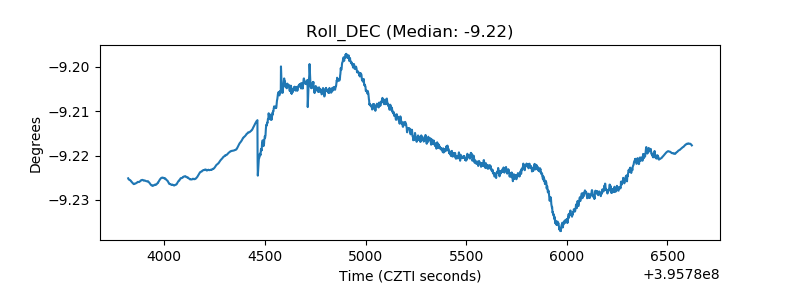 |
| _Roll_RA | 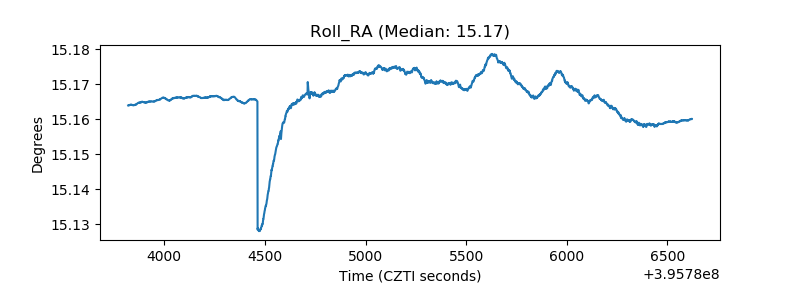 |
| Veto Counter | 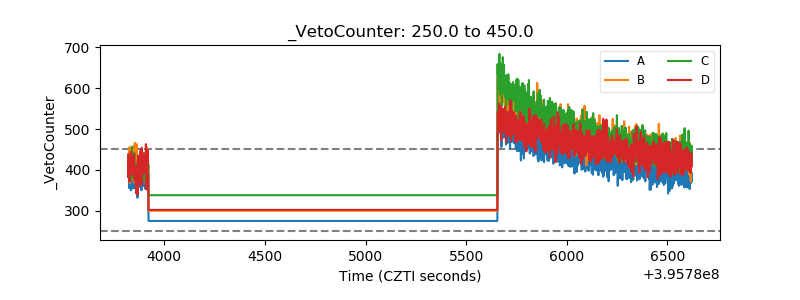 |